| Param | Original file | Final file |
|---|---|---|
| Filename | modeM0/AS1A12_035T01_9000005666_41422cztM0_level2.fits | modeM0/AS1A12_035T01_9000005666_41422cztM0_level2_quad_clean.evt |
| Size (bytes) | 450,498,240 | 94,685,760 |
| Size | 429.6 MB | 90.3 MB |
| Events in quadrant A | 3,183,642 | 637,022 |
| Events in quadrant B | 2,925,248 | 655,690 |
| Events in quadrant C | 3,183,812 | 617,039 |
| Events in quadrant D | 6,922,584 | 543,118 |
| Mode M0 | |||
|---|---|---|---|
| Quadrant | BADHDUFLAG | Total packets | Discarded packets |
| A | 0 | 12858 | 3 |
| B | 0 | 12845 | 2 |
| C | 0 | 13196 | 2 |
| D | 0 | 24755 | 2 |
| Mode SS | |||
|---|---|---|---|
| Quadrant | BADHDUFLAG | Total packets | Discarded packets |
| A | 0 | 118 | 0 |
| B | 0 | 118 | 0 |
| C | 0 | 118 | 0 |
| D | 0 | 118 | 0 |
| Mode M9 | |||
|---|---|---|---|
| Quadrant | BADHDUFLAG | Total packets | Discarded packets |
| A | 0 | 24 | 0 |
| B | 0 | 24 | 0 |
| C | 0 | 24 | 0 |
| D | 0 | 25 | 0 |
| Quadrant | Total seconds | Saturated seconds | Saturation percentage |
|---|---|---|---|
| A | 5932 | 13 | 0.219150% |
| B | 5932 | 16 | 0.269724% |
| C | 5932 | 140 | 2.360081% |
| D | 5932 | 596 | 10.047202% |
Noise dominated data is calculated using 1-second bins in cleaned event files. If a bin has >2000 counts, and if more than 50% of those come from <1% of pixels, then it is considered to be noise-dominated and hence unusable.
| Quadrant | # 1 sec bins | Bins with >0 counts | Bins with >2000 counts | High rate bins dominated by noise | Noise dominated (total time) | Noise dominated (detector-on time) | Marked lightcurve |
|---|---|---|---|---|---|---|---|
| A | 7246 | 5933 | 6 | 6 | 0.08% | 0.10% | 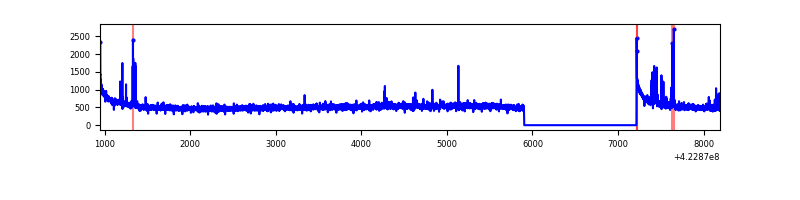 |
| B | 7246 | 5933 | 1 | 1 | 0.01% | 0.02% | 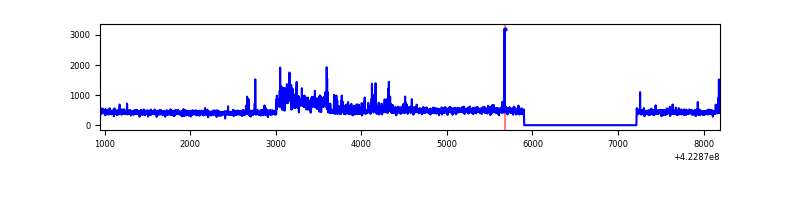 |
| C | 7246 | 5933 | 136 | 136 | 1.88% | 2.29% | 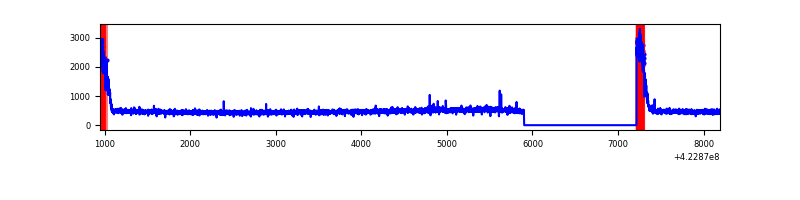 |
| D | 7246 | 5933 | 574 | 574 | 7.92% | 9.67% | 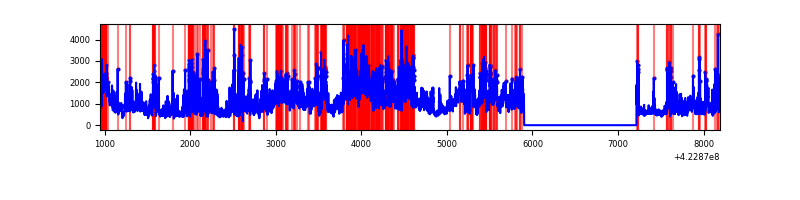 |
Top three noisy pixels from each quadrant. If the there are fewer than three noisy pixels in the level2.evt file, extra rows are filled as -1
| Pixel properties | Quadrant properties | ||||||
|---|---|---|---|---|---|---|---|
| Quadrant | DetID | PixID | Counts | Sigma | Mean | Median | Sigma |
| A | 10 | 83 | 565830 | 4178.65 | 656 | 641 | 135.3 |
| A | 13 | 248 | 56589 | 413.64 | 656 | 641 | 135.3 |
| A | 2 | 79 | 18360 | 131.0 | 656 | 641 | 135.3 |
| B | 0 | 186 | 248557 | 1946.19 | 651 | 633 | 127.4 |
| B | 0 | 190 | 71113 | 553.26 | 651 | 633 | 127.4 |
| B | 5 | 255 | 18119 | 137.26 | 651 | 633 | 127.4 |
| C | 0 | 10 | 430732 | 2874.97 | 634 | 637 | 149.6 |
| C | 15 | 214 | 263556 | 1757.48 | 634 | 637 | 149.6 |
| C | 15 | 111 | 10695 | 67.23 | 634 | 637 | 149.6 |
| D | 1 | 52 | 3185056 | 20575.22 | 626 | 607 | 154.8 |
| D | 2 | 249 | 722793 | 4666.16 | 626 | 607 | 154.8 |
| D | 5 | 222 | 175236 | 1128.3 | 626 | 607 | 154.8 |
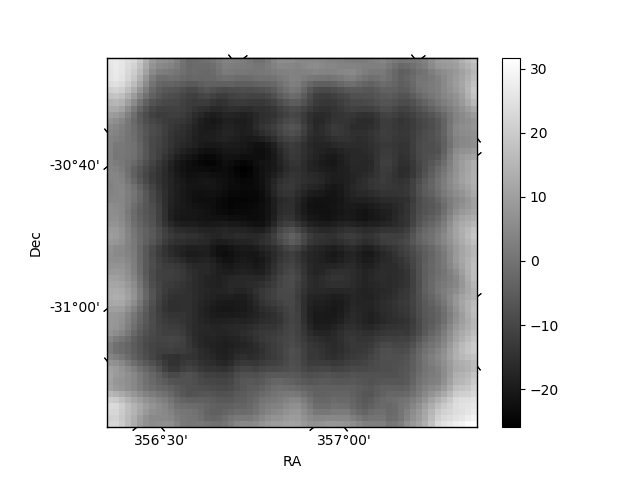
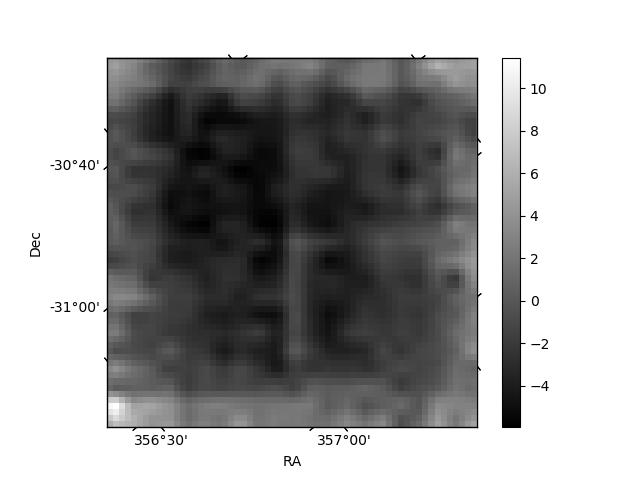
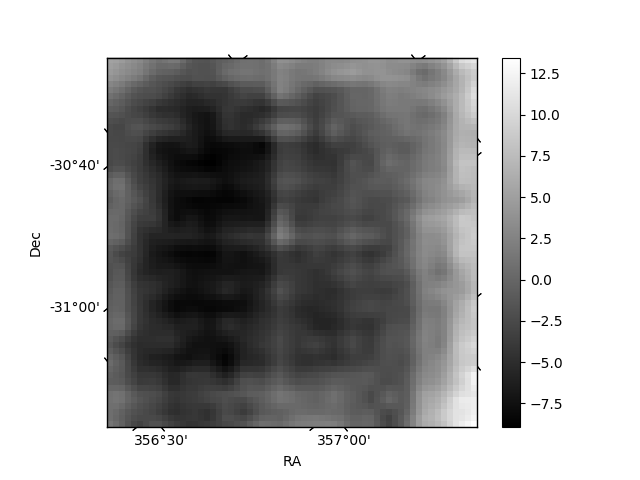
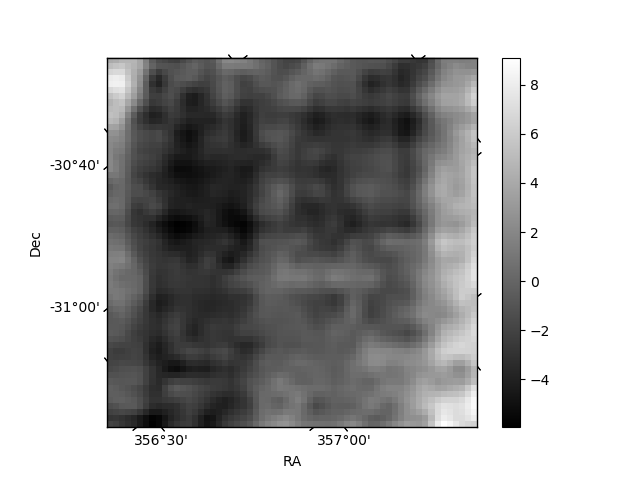
Histogram calculated using DETX and DETY for each event in the final _common_clean file
| Quadrant A | 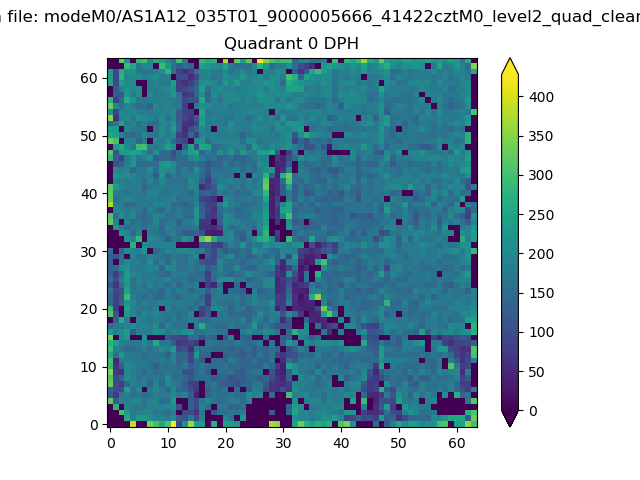 |
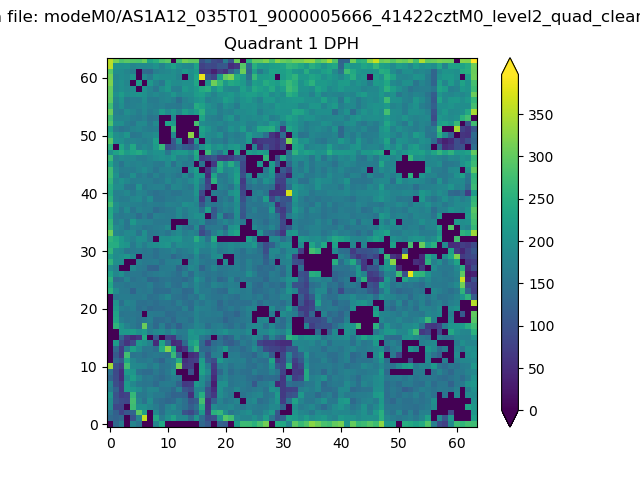 |
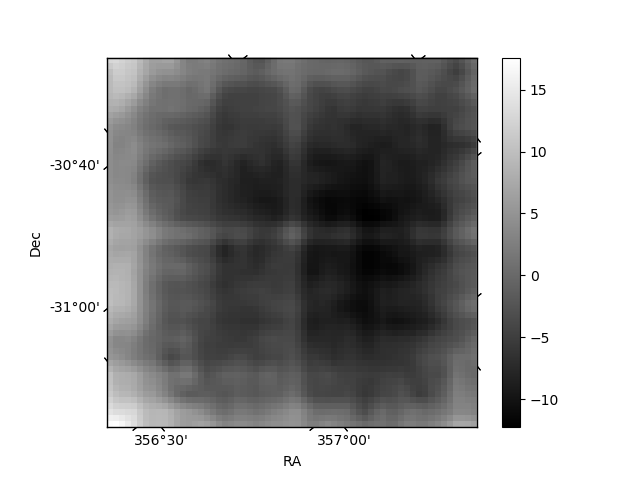
Quadrant B |
|---|---|---|---|
| Quadrant D | 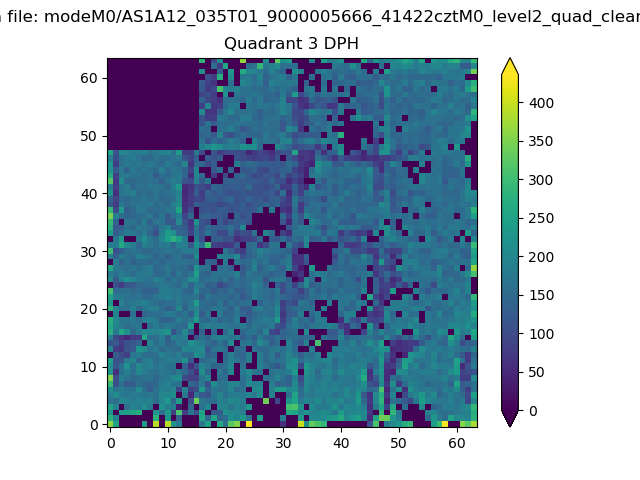 |
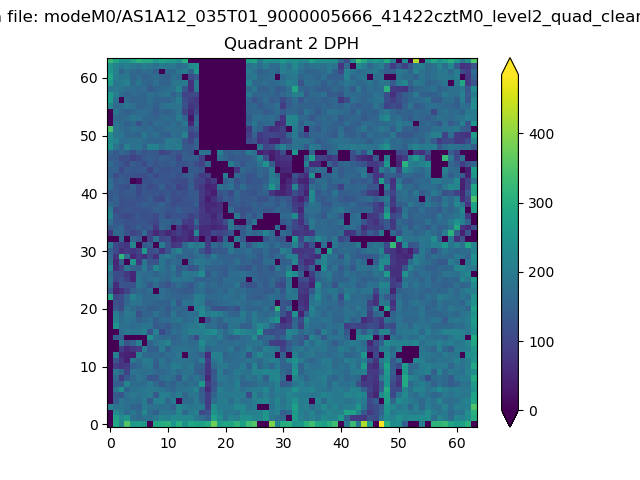 |
Quadrant C |
| Plot type | Count rate plots | Images |
|---|---|---|
| Comparison with Poisson distribution Blue bars denote a histogram of data divided into 1 sec bins. Red curve is a Poisson curve with rate = median count rate of data. |
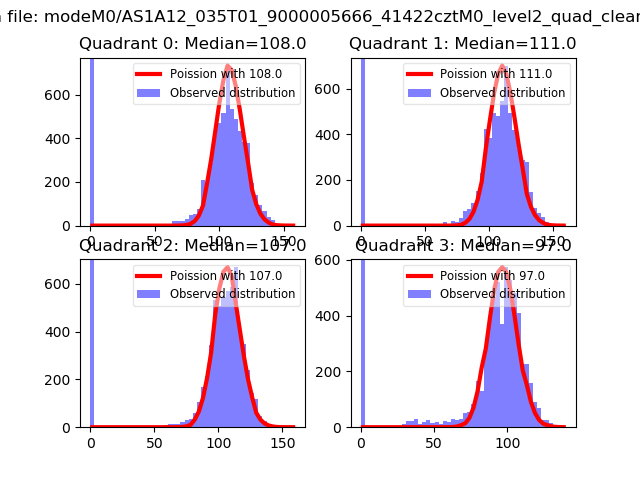 |
 |
| Quadrant-wise count rates Data is divided into 100 sec bins |
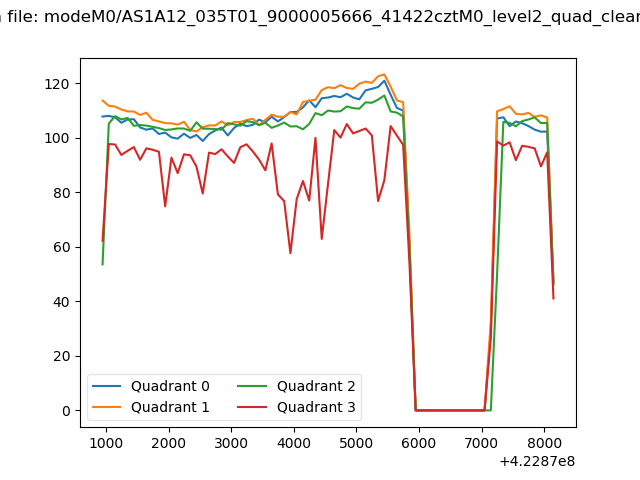 |
|
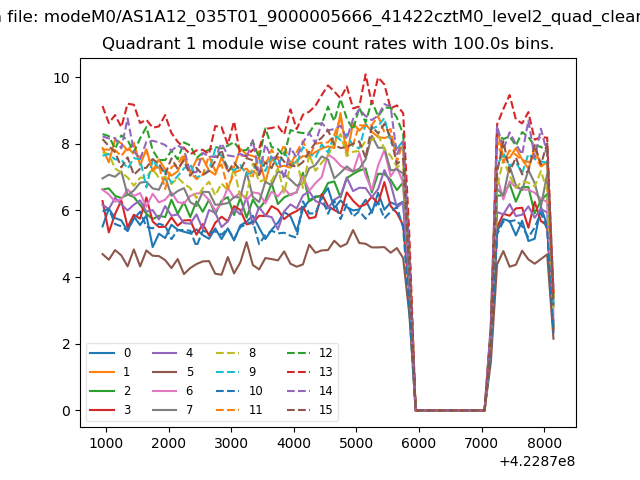
| Module-wise count rates for Quadrant A Data is divided into 100 sec bins |
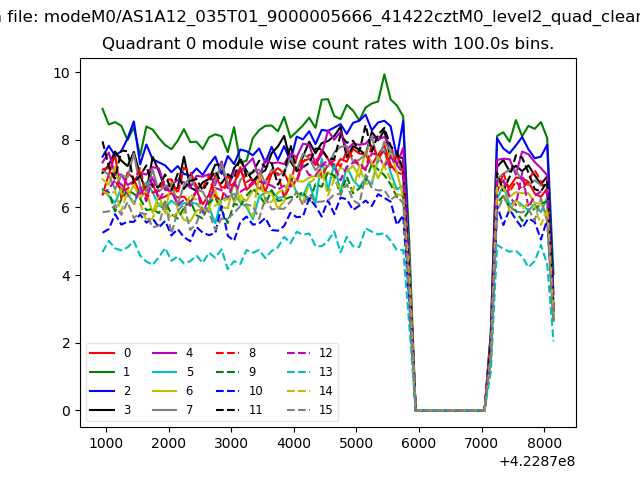 |
 |
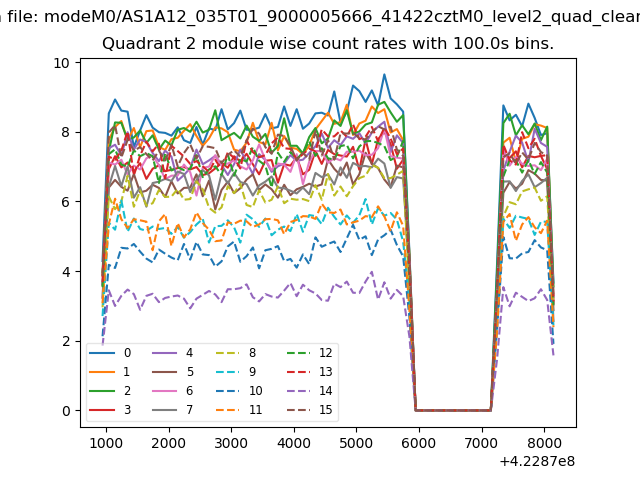
| Module-wise count rates for Quadrant B Data is divided into 100 sec bins |
 |
 |
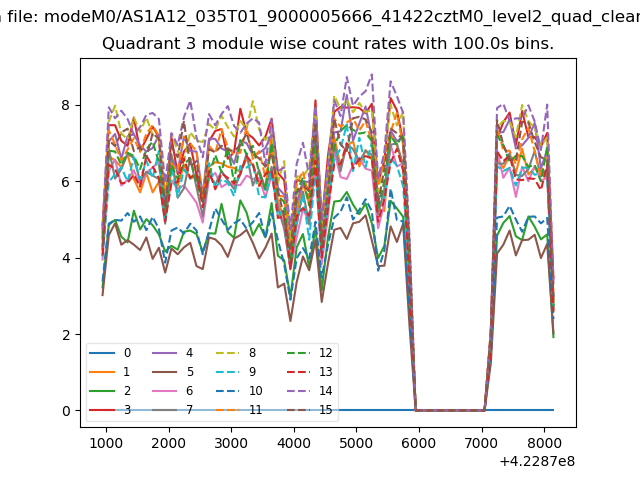
| Module-wise count rates for Quadrant C Data is divided into 100 sec bins |
 |
 |
| Module-wise count rates for Quadrant D Data is divided into 100 sec bins |
 |
 |
| Parameter | Plot |
|---|---|
| CZT HV Monitor | 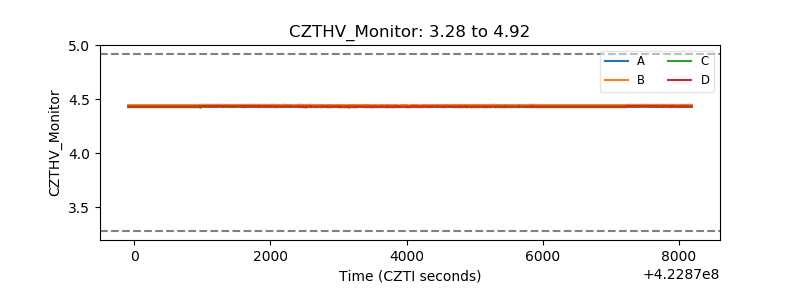 |
| D_VDD | 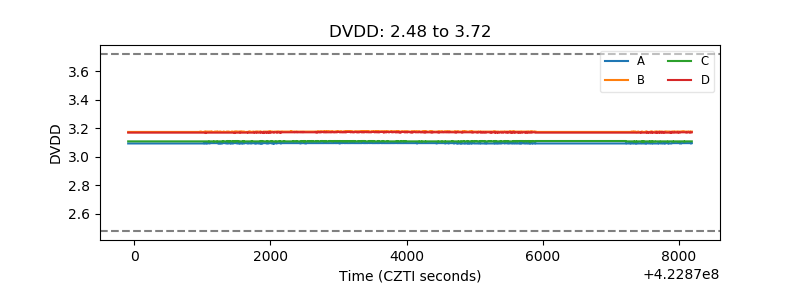 |
| Temperature 1 | 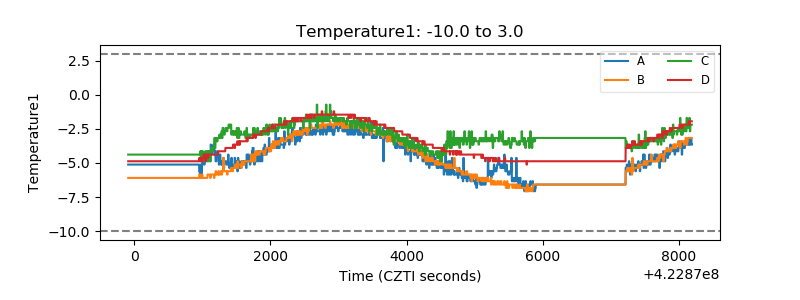 |
| Veto HV Monitor | 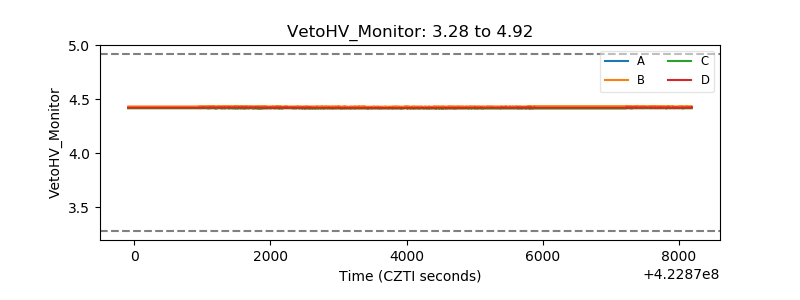 |
| Veto LLD | 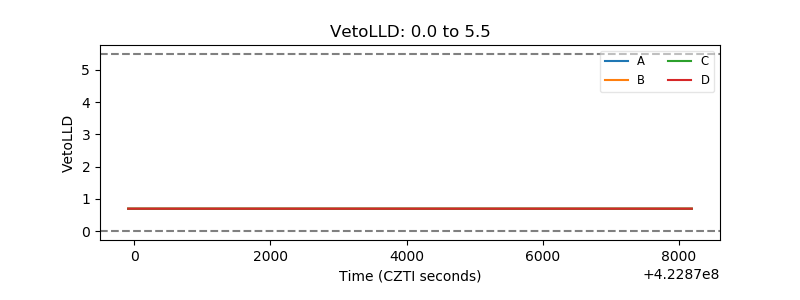 |
| Alpha Counter | 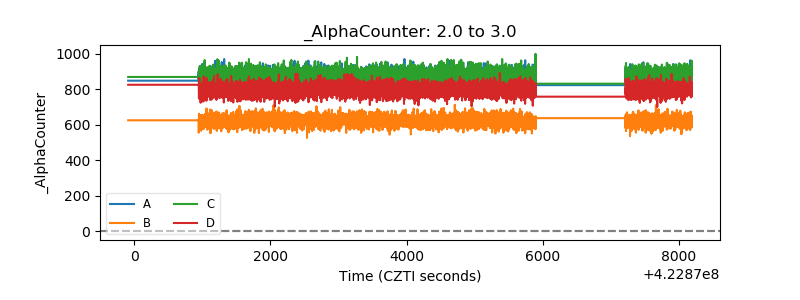 |
| _CPM_Rate | 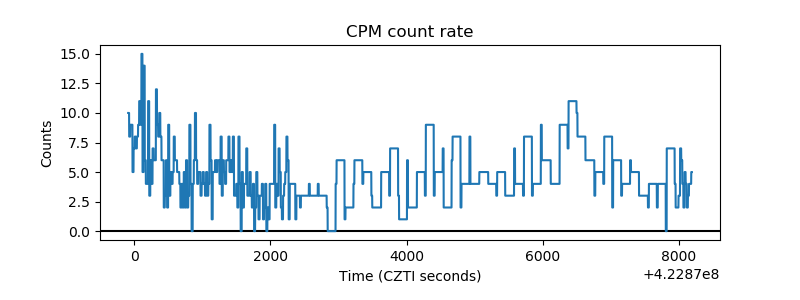 |
| CZT Counter | 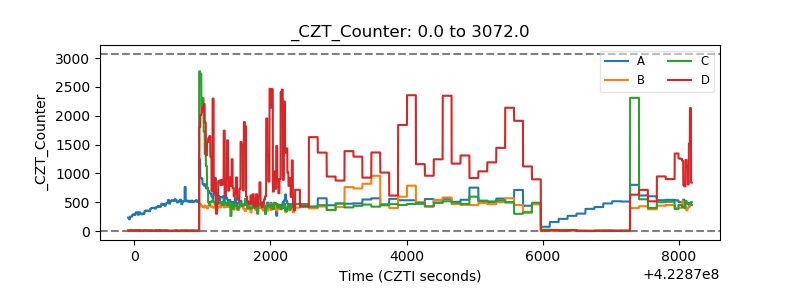 |
| +2.5 Volts monitor | 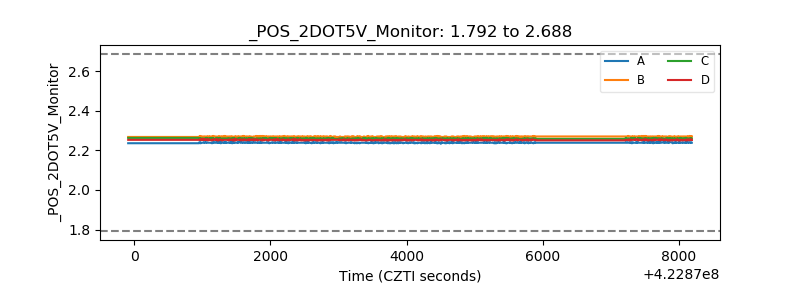 |
| +5 Volts monitor | 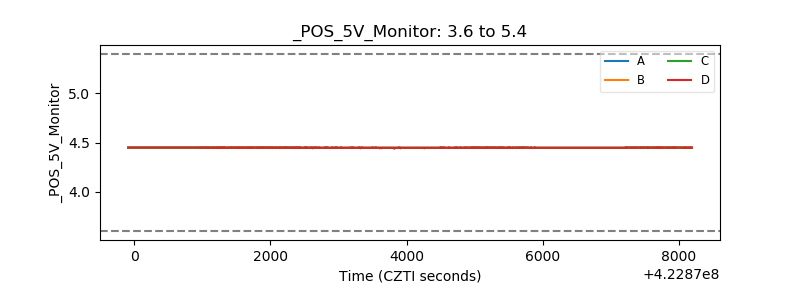 |
| _ROLL_ROT | 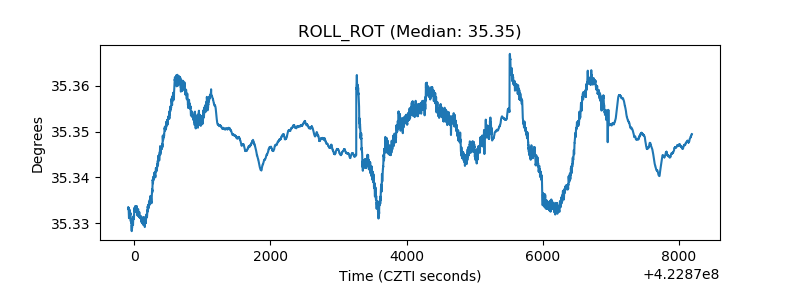 |
| _Roll_DEC | 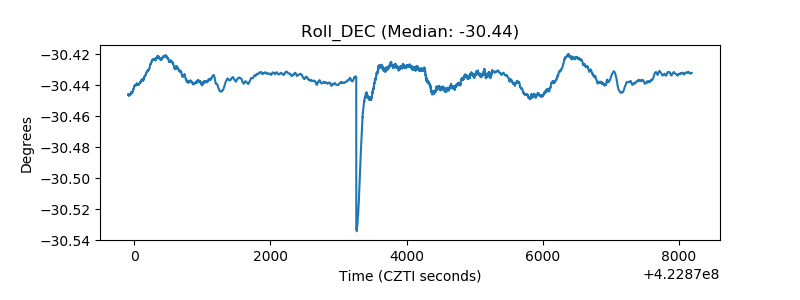 |
| _Roll_RA | 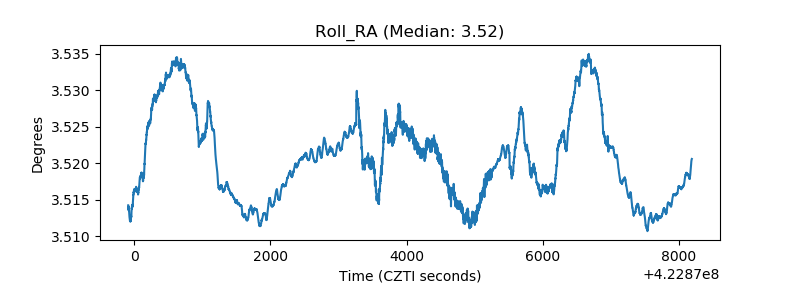 |
| Veto Counter | 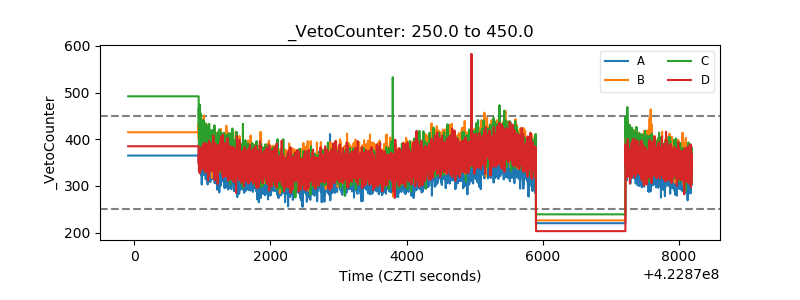 |