| Param | Original file | Final file |
|---|---|---|
| Filename | modeM0/AS1A12_035T01_9000005666_41425cztM0_level2.fits | modeM0/AS1A12_035T01_9000005666_41425cztM0_level2_quad_clean.evt |
| Size (bytes) | 1,015,594,560 | 245,594,880 |
| Size | 968.5 MB | 234.2 MB |
| Events in quadrant A | 8,214,804 | 1,640,079 |
| Events in quadrant B | 7,397,050 | 1,674,878 |
| Events in quadrant C | 8,276,003 | 1,582,850 |
| Events in quadrant D | 12,501,381 | 1,464,802 |
| Mode M0 | |||
|---|---|---|---|
| Quadrant | BADHDUFLAG | Total packets | Discarded packets |
| A | 0 | 33245 | 5 |
| B | 0 | 32510 | 4 |
| C | 0 | 34209 | 4 |
| D | 0 | 47851 | 4 |
| Mode SS | |||
|---|---|---|---|
| Quadrant | BADHDUFLAG | Total packets | Discarded packets |
| A | 0 | 316 | 0 |
| B | 0 | 316 | 0 |
| C | 0 | 316 | 0 |
| D | 0 | 316 | 0 |
| Mode M9 | |||
|---|---|---|---|
| Quadrant | BADHDUFLAG | Total packets | Discarded packets |
| A | 0 | 57 | 0 |
| B | 0 | 57 | 0 |
| C | 0 | 57 | 0 |
| D | 0 | 57 | 0 |
| Quadrant | Total seconds | Saturated seconds | Saturation percentage |
|---|---|---|---|
| A | 15565 | 33 | 0.212014% |
| B | 15565 | 71 | 0.456152% |
| C | 15565 | 377 | 2.422101% |
| D | 15565 | 723 | 4.645037% |
Noise dominated data is calculated using 1-second bins in cleaned event files. If a bin has >2000 counts, and if more than 50% of those come from <1% of pixels, then it is considered to be noise-dominated and hence unusable.
| Quadrant | # 1 sec bins | Bins with >0 counts | Bins with >2000 counts | High rate bins dominated by noise | Noise dominated (total time) | Noise dominated (detector-on time) | Marked lightcurve |
|---|---|---|---|---|---|---|---|
| A | 21116 | 15569 | 10 | 10 | 0.05% | 0.06% | 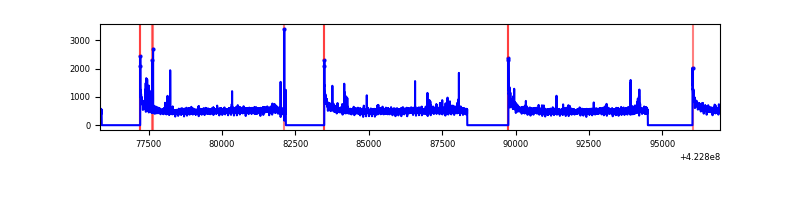 |
| B | 21116 | 15569 | 28 | 28 | 0.13% | 0.18% | 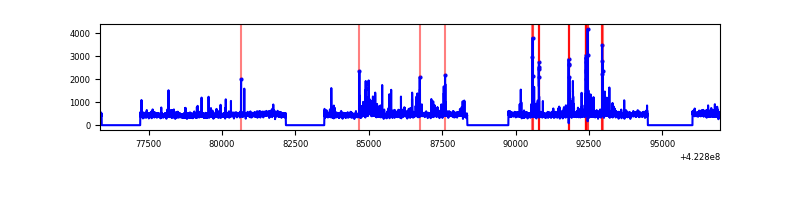 |
| C | 21116 | 15569 | 367 | 367 | 1.74% | 2.36% | 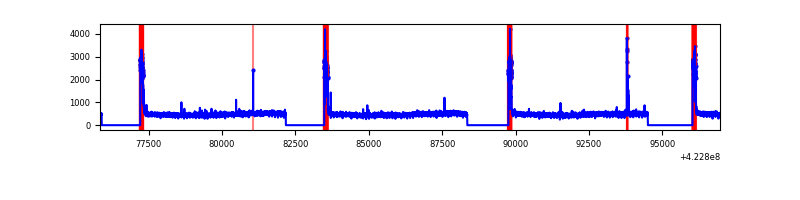 |
| D | 21116 | 15569 | 649 | 649 | 3.07% | 4.17% | 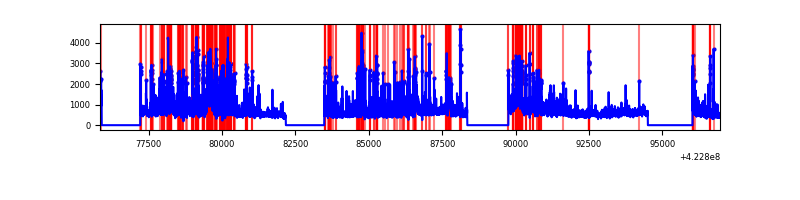 |
Top three noisy pixels from each quadrant. If the there are fewer than three noisy pixels in the level2.evt file, extra rows are filled as -1
| Pixel properties | Quadrant properties | ||||||
|---|---|---|---|---|---|---|---|
| Quadrant | DetID | PixID | Counts | Sigma | Mean | Median | Sigma |
| A | 10 | 83 | 1378407 | 3873.17 | 1731 | 1688 | 355.5 |
| A | 13 | 248 | 107727 | 298.32 | 1731 | 1688 | 355.5 |
| A | 13 | 254 | 25247 | 66.28 | 1731 | 1688 | 355.5 |
| B | 5 | 255 | 234903 | 707.71 | 1713 | 1662 | 329.6 |
| B | 0 | 190 | 212196 | 638.81 | 1713 | 1662 | 329.6 |
| B | 0 | 186 | 156104 | 468.62 | 1713 | 1662 | 329.6 |
| C | 0 | 10 | 1049236 | 2700.52 | 1666 | 1677 | 387.9 |
| C | 15 | 214 | 672377 | 1729.01 | 1666 | 1677 | 387.9 |
| C | 15 | 111 | 42004 | 103.96 | 1666 | 1677 | 387.9 |
| D | 1 | 52 | 2456011 | 5961.72 | 1672 | 1622 | 411.7 |
| D | 12 | 79 | 2042219 | 4956.62 | 1672 | 1622 | 411.7 |
| D | 5 | 222 | 491787 | 1190.61 | 1672 | 1622 | 411.7 |
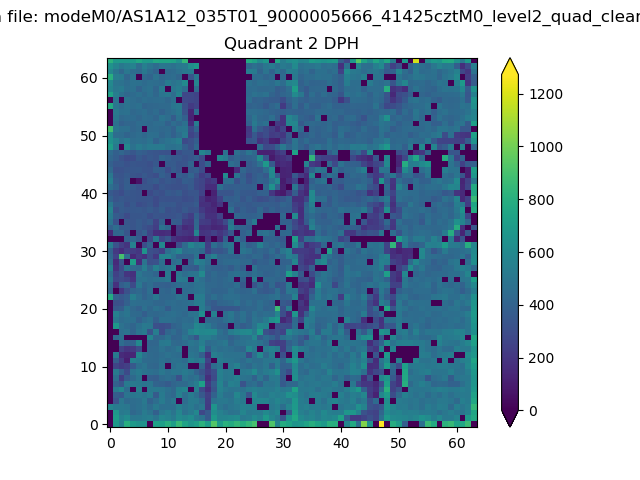
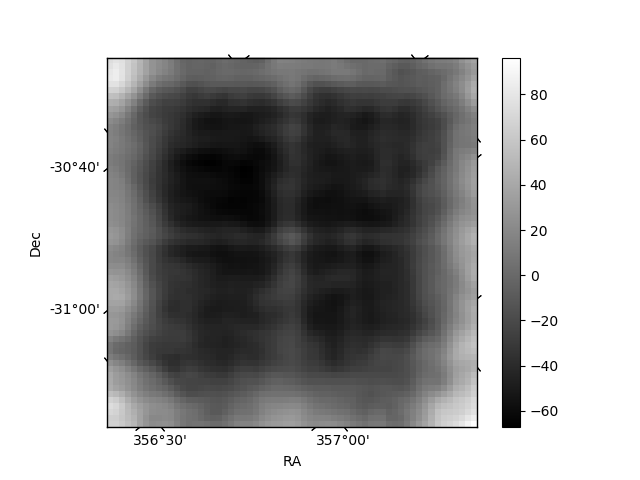
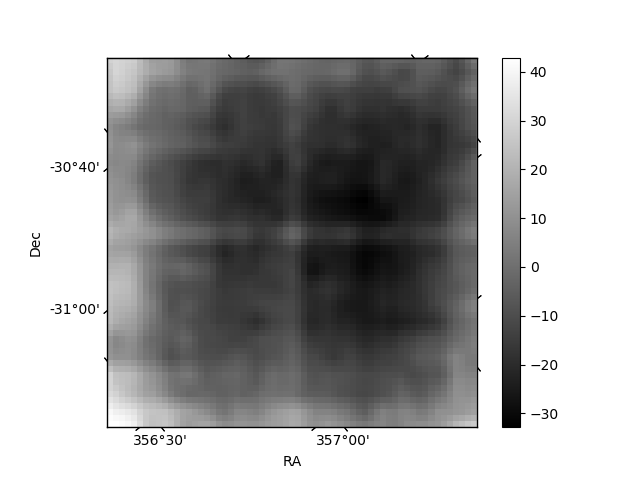
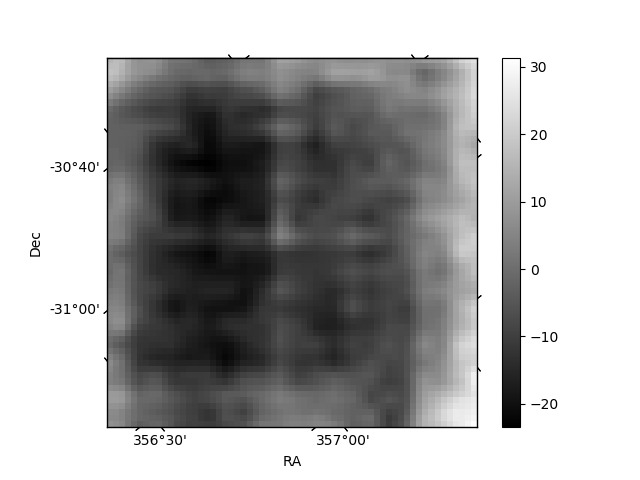
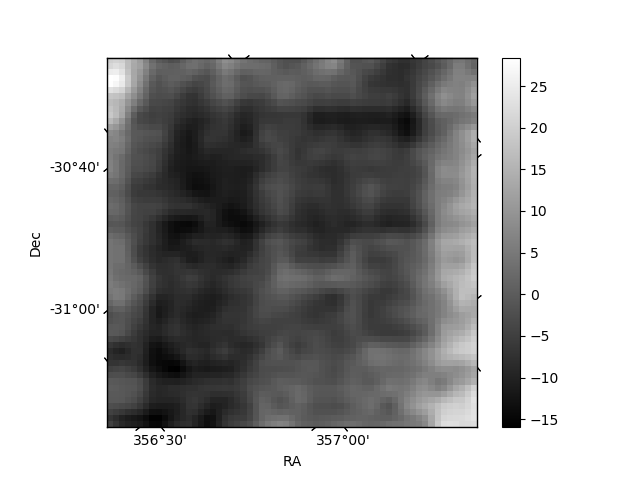
Histogram calculated using DETX and DETY for each event in the final _common_clean file
| Quadrant A | 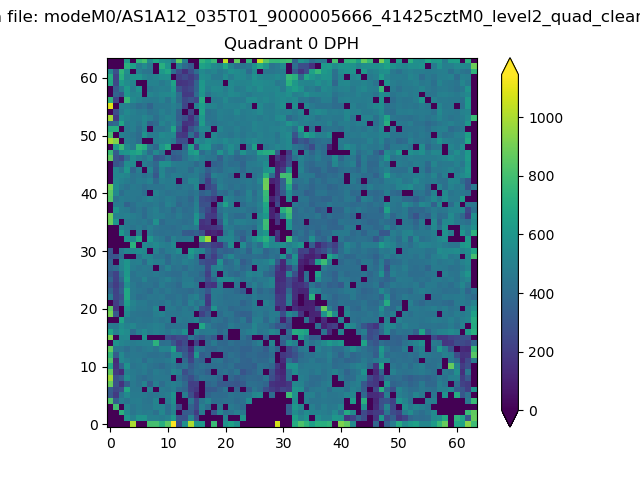 |
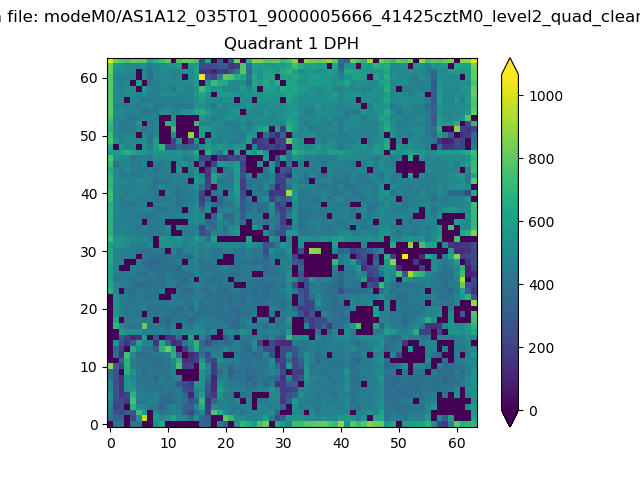 |
Quadrant B |
|---|---|---|---|
| Quadrant D | 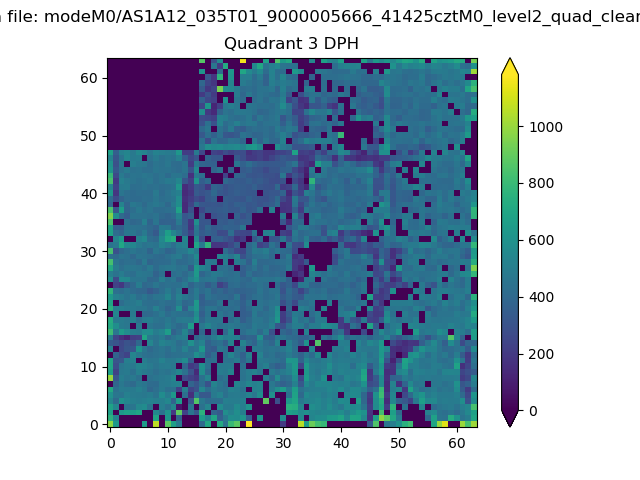 |
 |
Quadrant C |
| Plot type | Count rate plots | Images |
|---|---|---|
| Comparison with Poisson distribution Blue bars denote a histogram of data divided into 1 sec bins. Red curve is a Poisson curve with rate = median count rate of data. |
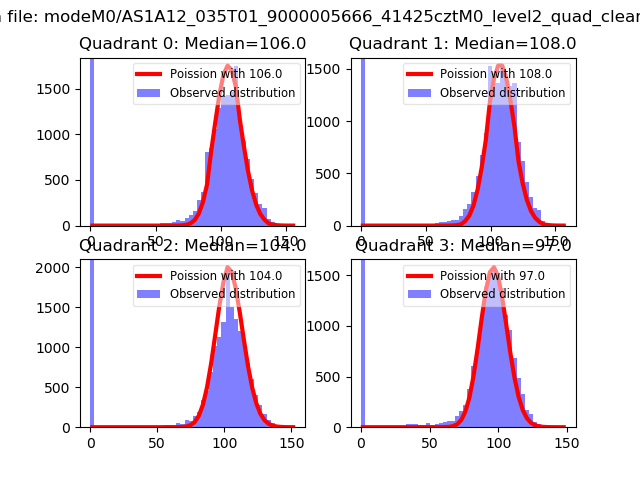 |
 |
| Quadrant-wise count rates Data is divided into 100 sec bins |
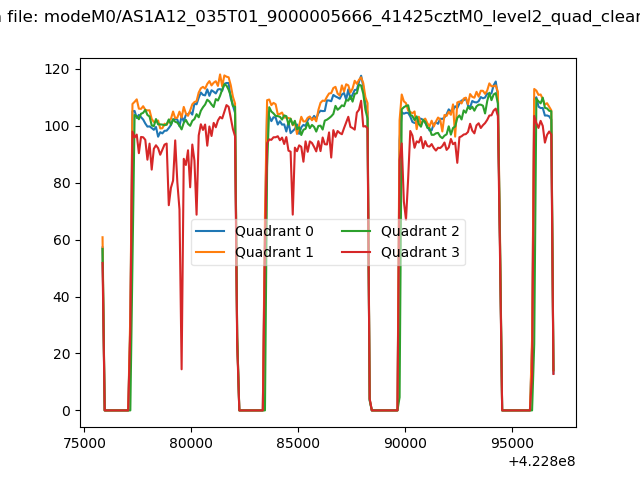 |
|
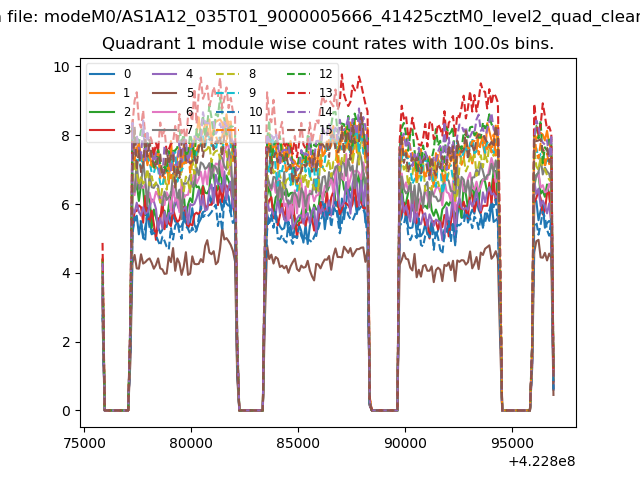
| Module-wise count rates for Quadrant A Data is divided into 100 sec bins |
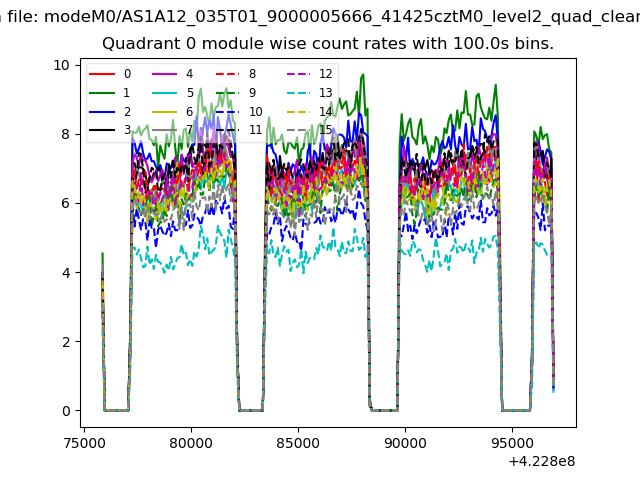 |
 |
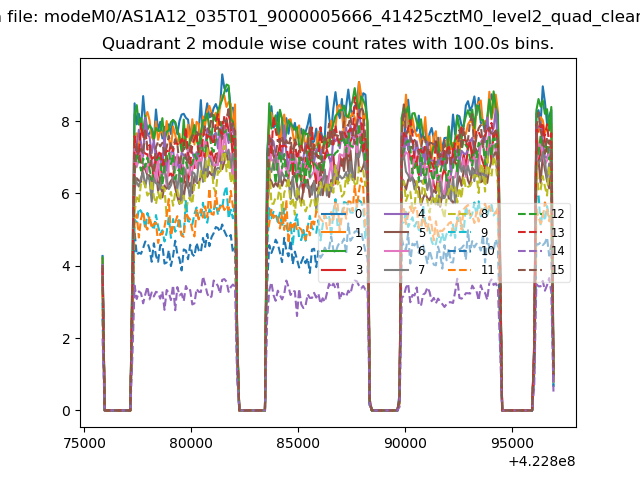
| Module-wise count rates for Quadrant B Data is divided into 100 sec bins |
 |
 |
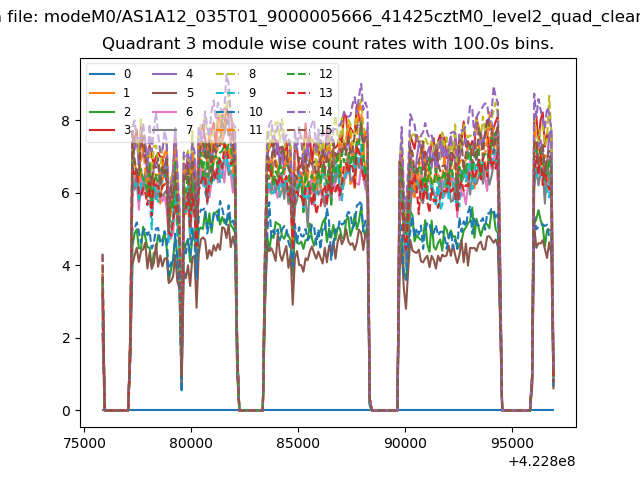
| Module-wise count rates for Quadrant C Data is divided into 100 sec bins |
 |
 |
| Module-wise count rates for Quadrant D Data is divided into 100 sec bins |
 |
 |
| Parameter | Plot |
|---|---|
| CZT HV Monitor | 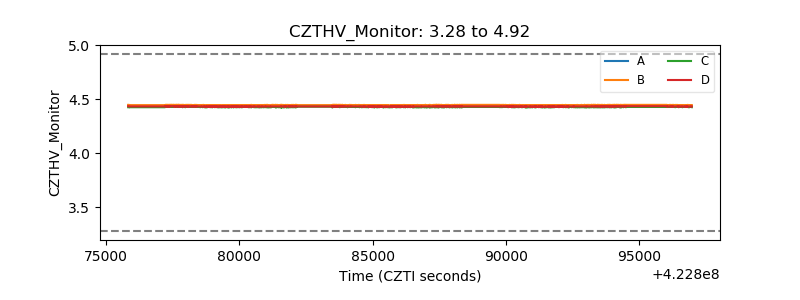 |
| D_VDD | 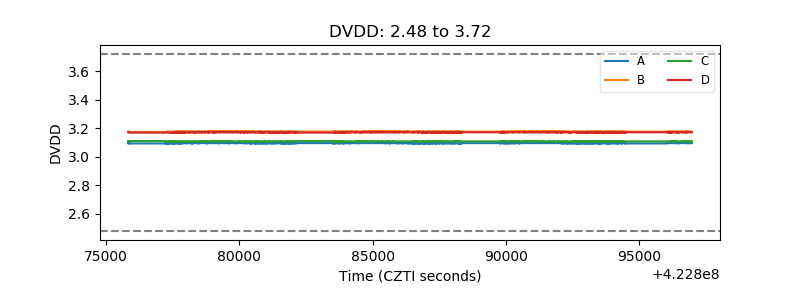 |
| Temperature 1 | 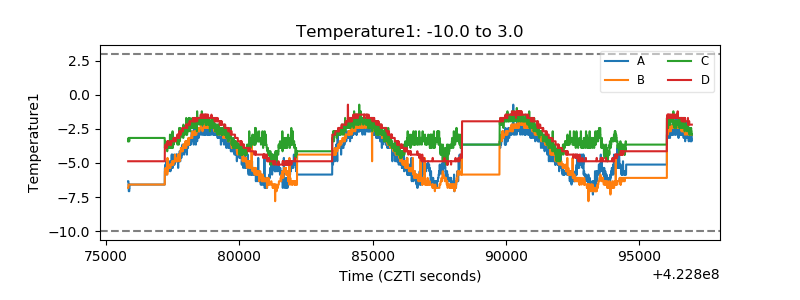 |
| Veto HV Monitor | 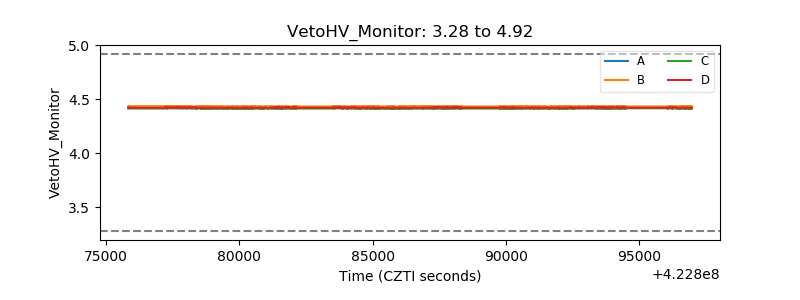 |
| Veto LLD | 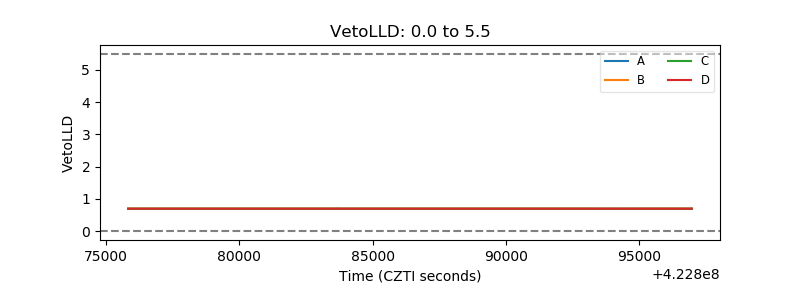 |
| Alpha Counter | 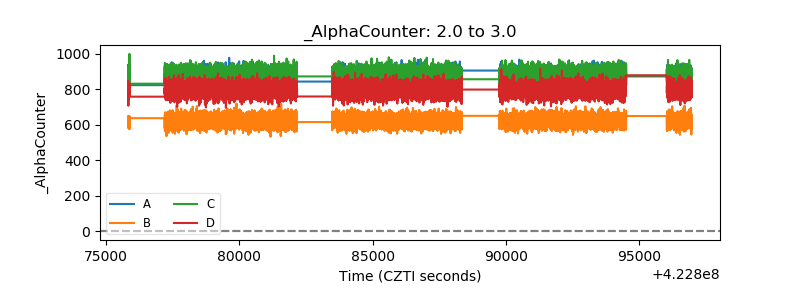 |
| _CPM_Rate |  |
| CZT Counter | 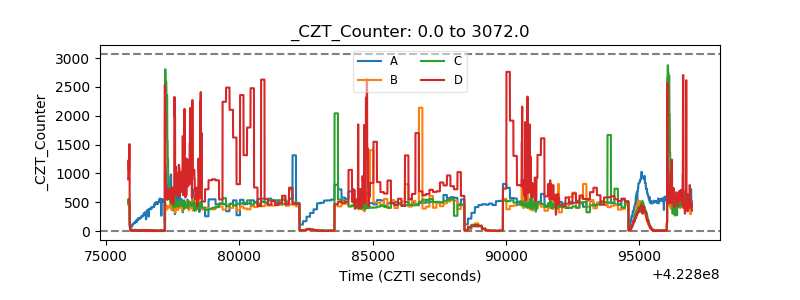 |
| +2.5 Volts monitor | 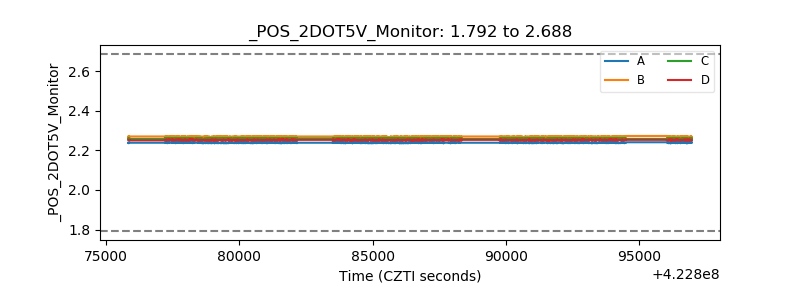 |
| +5 Volts monitor | 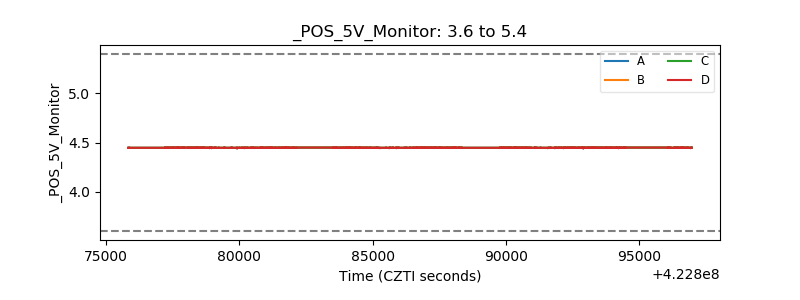 |
| _ROLL_ROT | 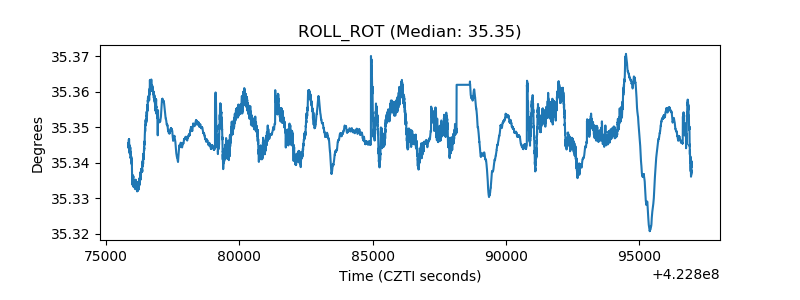 |
| _Roll_DEC | 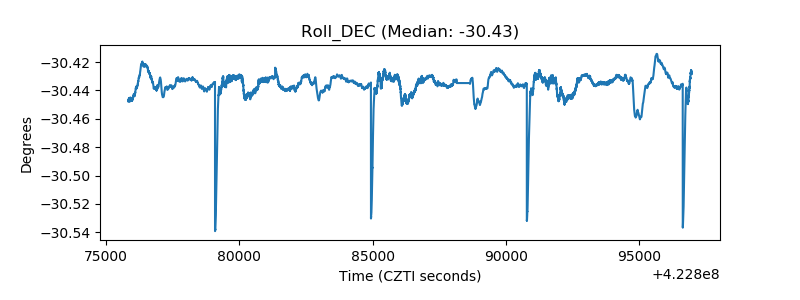 |
| _Roll_RA | 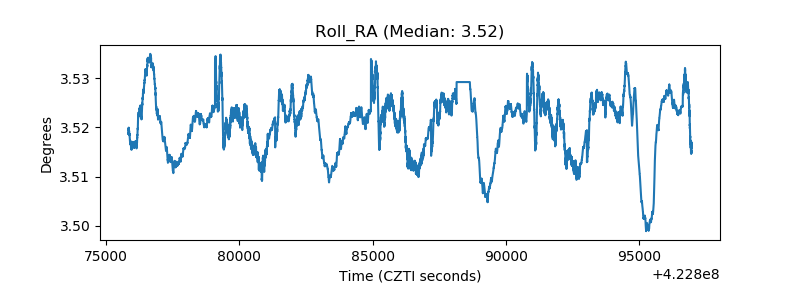 |
| Veto Counter | 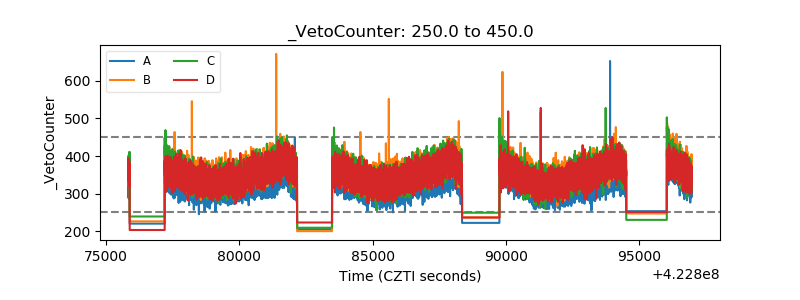 |