| Param | Original file | Final file |
|---|---|---|
| Filename | modeM0/AS1A12_035T01_9000005666_41426cztM0_level2.fits | modeM0/AS1A12_035T01_9000005666_41426cztM0_level2_quad_clean.evt |
| Size (bytes) | 346,417,920 | 91,031,040 |
| Size | 330.4 MB | 86.8 MB |
| Events in quadrant A | 3,301,333 | 613,634 |
| Events in quadrant B | 2,647,123 | 627,030 |
| Events in quadrant C | 3,189,157 | 569,572 |
| Events in quadrant D | 3,250,247 | 554,891 |
| Mode M0 | |||
|---|---|---|---|
| Quadrant | BADHDUFLAG | Total packets | Discarded packets |
| A | 0 | 13264 | 3 |
| B | 0 | 11640 | 2 |
| C | 0 | 12890 | 2 |
| D | 0 | 13407 | 2 |
| Mode SS | |||
|---|---|---|---|
| Quadrant | BADHDUFLAG | Total packets | Discarded packets |
| A | 0 | 114 | 0 |
| B | 0 | 114 | 0 |
| C | 0 | 114 | 0 |
| D | 0 | 114 | 0 |
| Mode M9 | |||
|---|---|---|---|
| Quadrant | BADHDUFLAG | Total packets | Discarded packets |
| A | 0 | 29 | 0 |
| B | 0 | 29 | 0 |
| C | 0 | 29 | 0 |
| D | 0 | 30 | 0 |
| Quadrant | Total seconds | Saturated seconds | Saturation percentage |
|---|---|---|---|
| A | 5591 | 31 | 0.554463% |
| B | 5591 | 33 | 0.590234% |
| C | 5591 | 231 | 4.131640% |
| D | 5591 | 78 | 1.395099% |
Noise dominated data is calculated using 1-second bins in cleaned event files. If a bin has >2000 counts, and if more than 50% of those come from <1% of pixels, then it is considered to be noise-dominated and hence unusable.
| Quadrant | # 1 sec bins | Bins with >0 counts | Bins with >2000 counts | High rate bins dominated by noise | Noise dominated (total time) | Noise dominated (detector-on time) | Marked lightcurve |
|---|---|---|---|---|---|---|---|
| A | 7204 | 5592 | 10 | 10 | 0.14% | 0.18% | 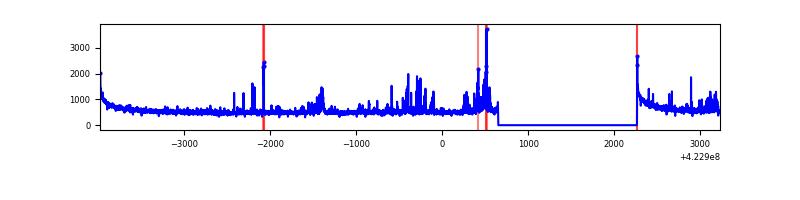 |
| B | 7204 | 5592 | 19 | 19 | 0.26% | 0.34% | 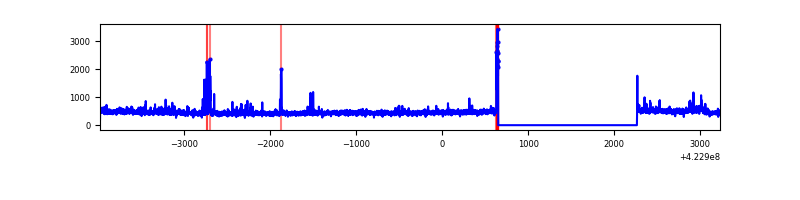 |
| C | 7204 | 5592 | 222 | 222 | 3.08% | 3.97% | 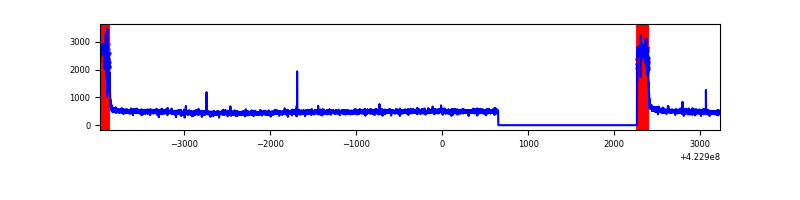 |
| D | 7204 | 5592 | 59 | 59 | 0.82% | 1.06% | 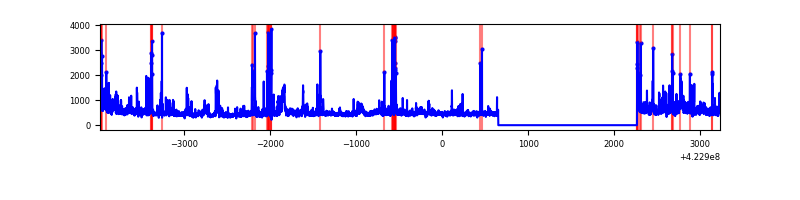 |
Top three noisy pixels from each quadrant. If the there are fewer than three noisy pixels in the level2.evt file, extra rows are filled as -1
| Pixel properties | Quadrant properties | ||||||
|---|---|---|---|---|---|---|---|
| Quadrant | DetID | PixID | Counts | Sigma | Mean | Median | Sigma |
| A | 10 | 83 | 553978 | 4233.18 | 625 | 611 | 130.7 |
| A | 2 | 79 | 274348 | 2094.05 | 625 | 611 | 130.7 |
| A | 13 | 248 | 43703 | 329.65 | 625 | 611 | 130.7 |
| B | 5 | 255 | 117493 | 986.41 | 616 | 600 | 118.5 |
| B | 0 | 190 | 63155 | 527.87 | 616 | 600 | 118.5 |
| B | 0 | 186 | 25223 | 207.78 | 616 | 600 | 118.5 |
| C | 0 | 10 | 650350 | 4753.01 | 587 | 589 | 136.7 |
| C | 15 | 214 | 227804 | 1662.08 | 587 | 589 | 136.7 |
| C | 15 | 111 | 13452 | 94.09 | 587 | 589 | 136.7 |
| D | 12 | 79 | 330411 | 2210.2 | 608 | 591 | 149.2 |
| D | 13 | 249 | 198410 | 1325.63 | 608 | 591 | 149.2 |
| D | 1 | 47 | 138293 | 922.77 | 608 | 591 | 149.2 |
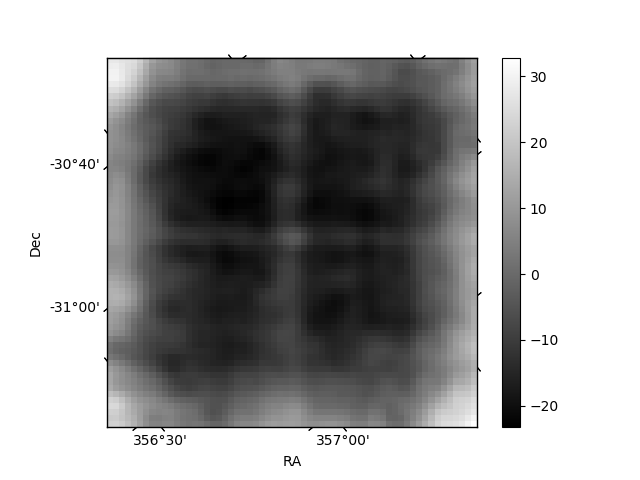
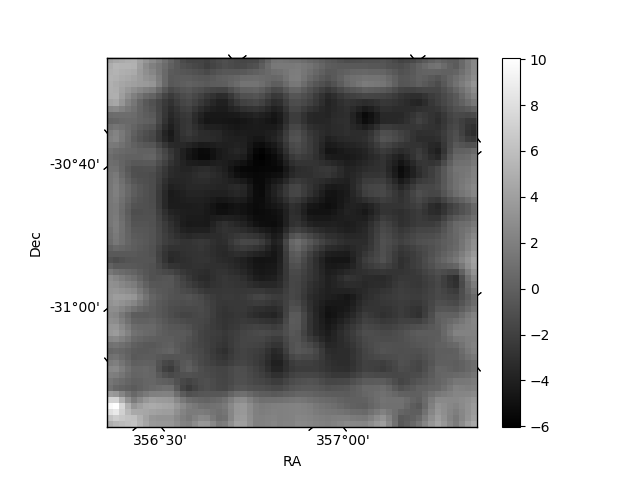
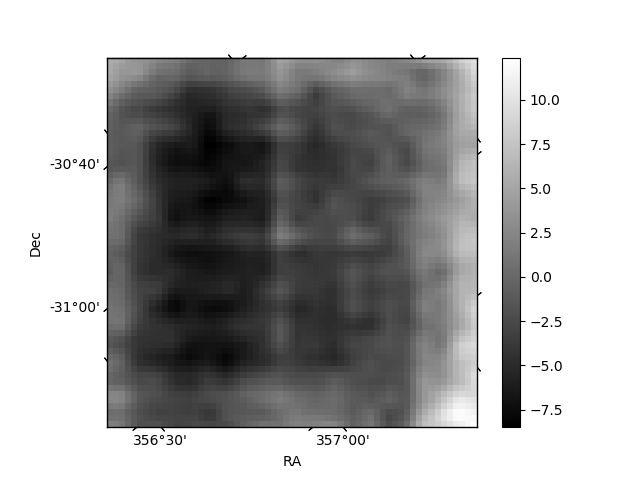
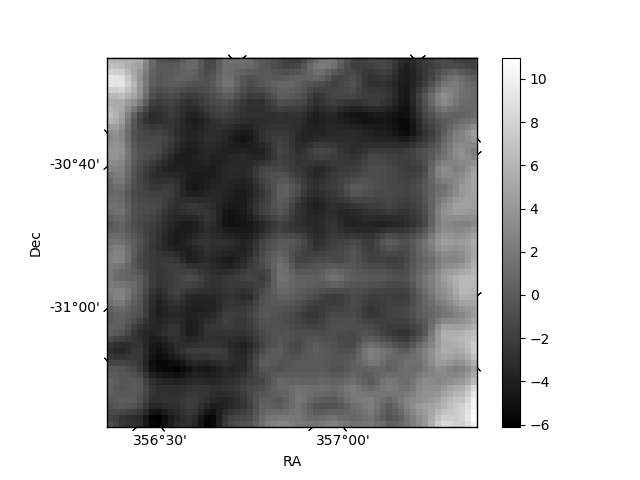
Histogram calculated using DETX and DETY for each event in the final _common_clean file
| Quadrant A | 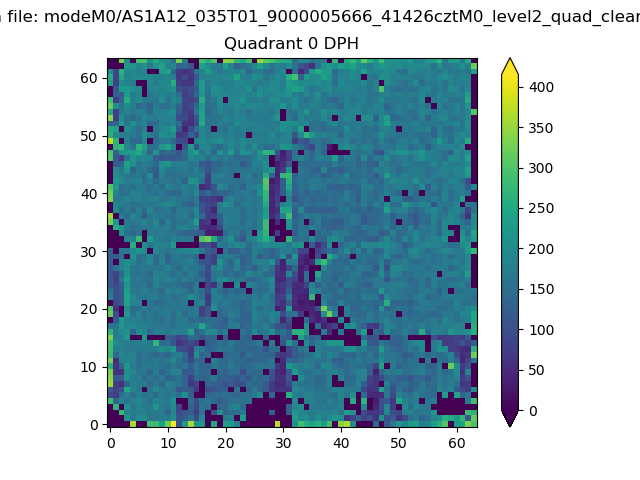 |
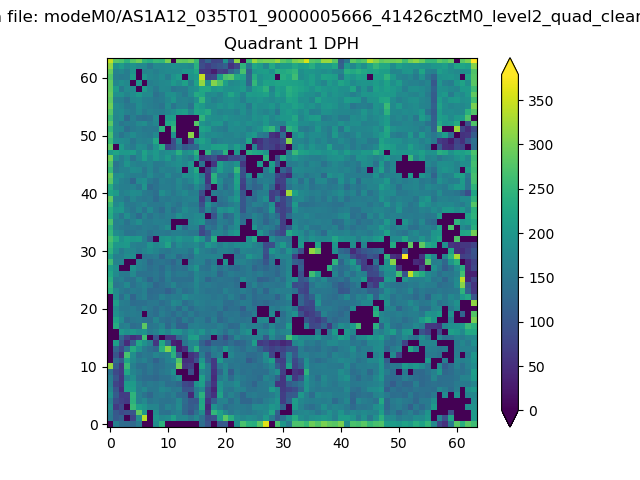 |
Quadrant B |
|---|---|---|---|
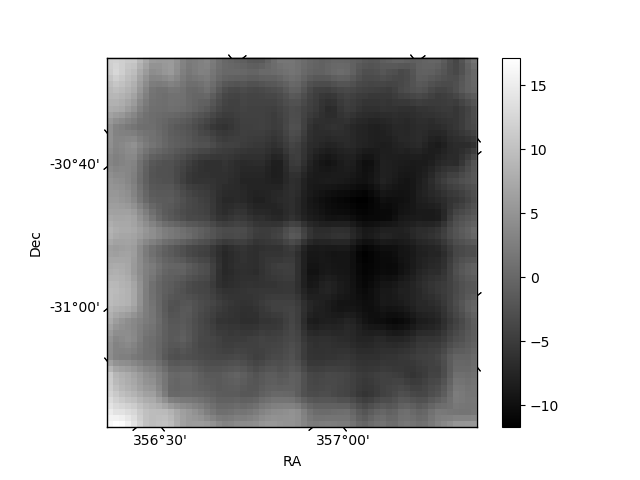
| Quadrant D | 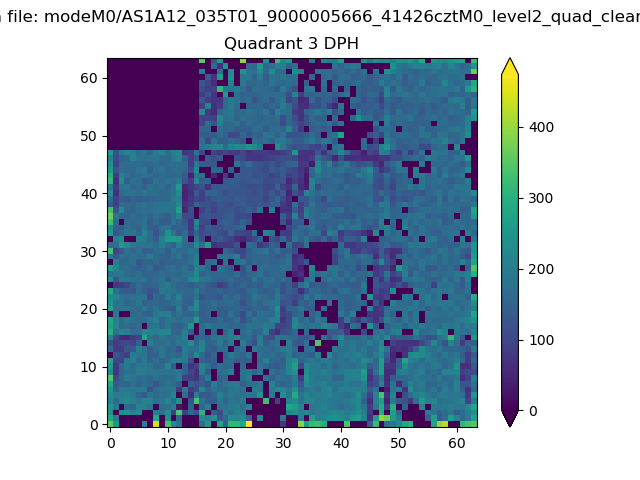 |
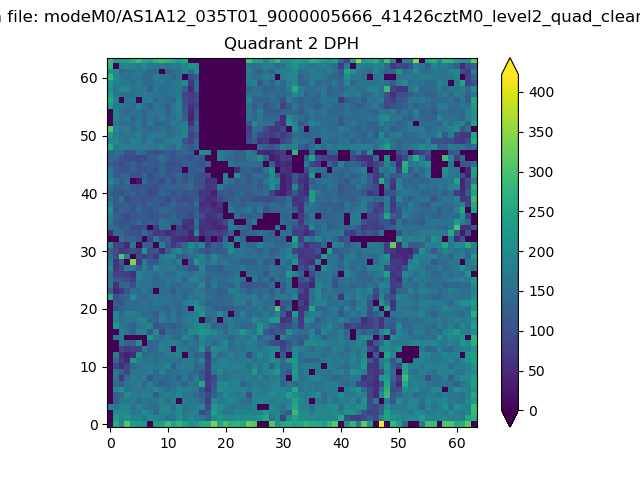 |
Quadrant C |
| Plot type | Count rate plots | Images |
|---|---|---|
| Comparison with Poisson distribution Blue bars denote a histogram of data divided into 1 sec bins. Red curve is a Poisson curve with rate = median count rate of data. |
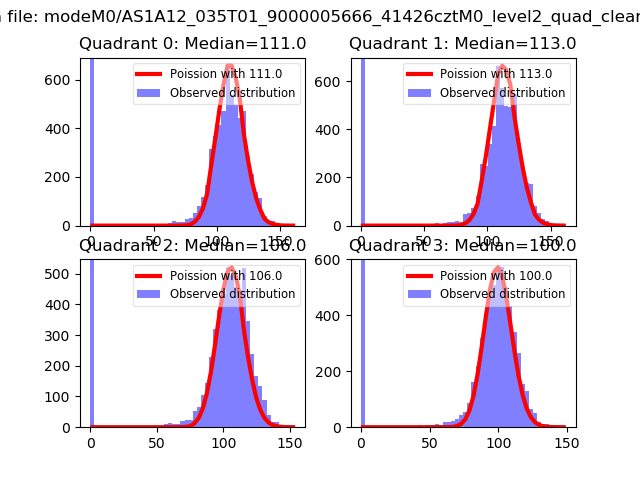 |
 |
| Quadrant-wise count rates Data is divided into 100 sec bins |
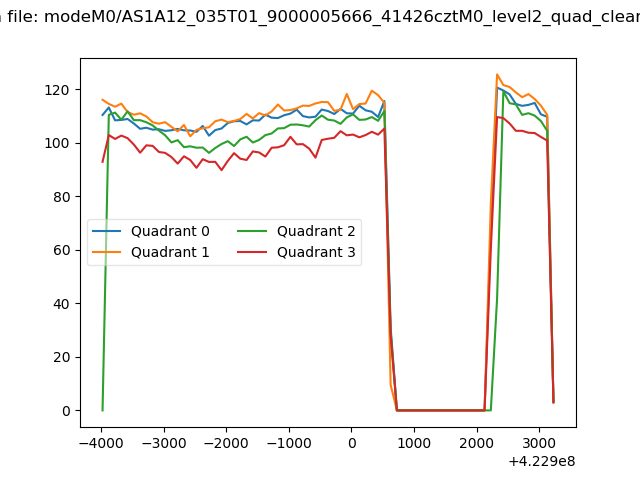 |
|
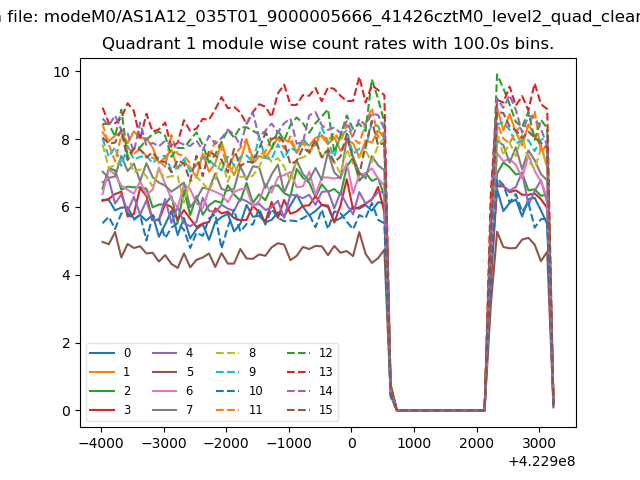
| Module-wise count rates for Quadrant A Data is divided into 100 sec bins |
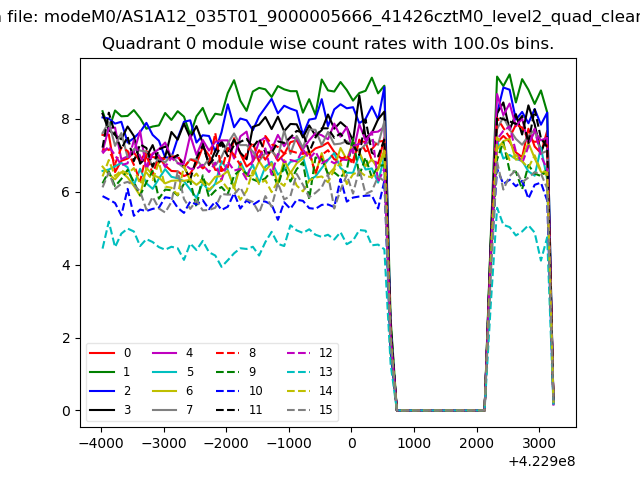 |
 |
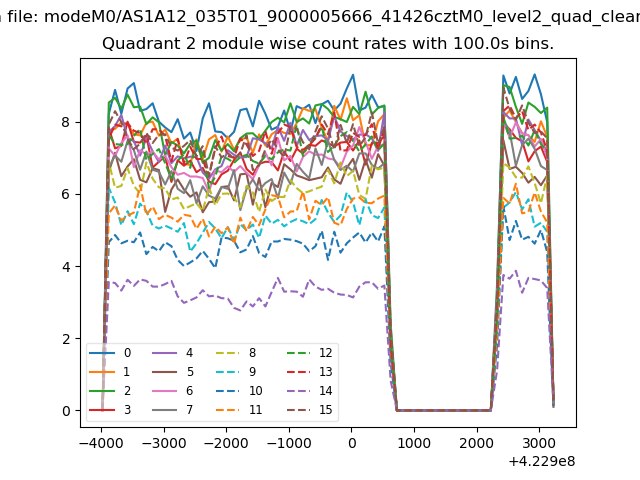
| Module-wise count rates for Quadrant B Data is divided into 100 sec bins |
 |
 |
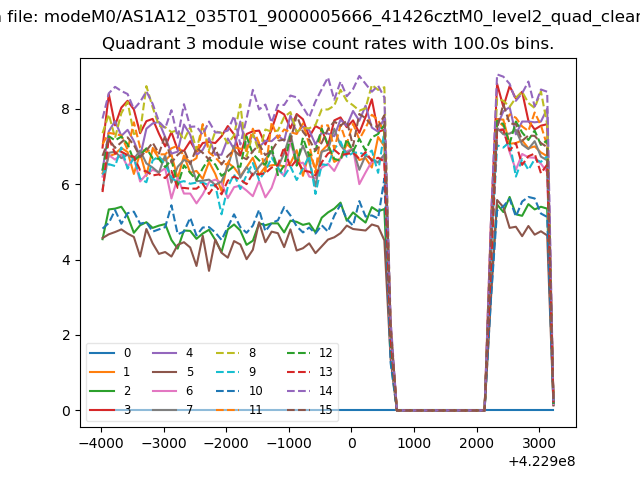
| Module-wise count rates for Quadrant C Data is divided into 100 sec bins |
 |
 |
| Module-wise count rates for Quadrant D Data is divided into 100 sec bins |
 |
 |
| Parameter | Plot |
|---|---|
| CZT HV Monitor |  |
| D_VDD | 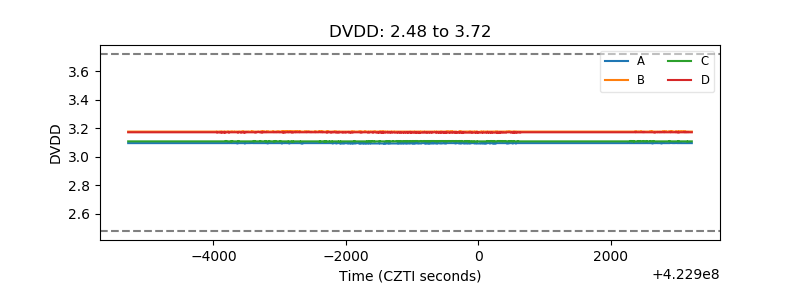 |
| Temperature 1 | 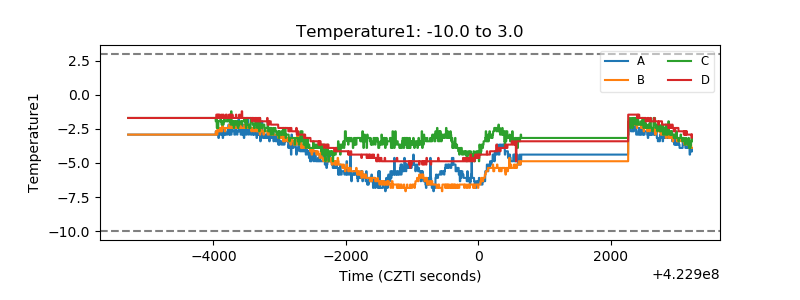 |
| Veto HV Monitor | 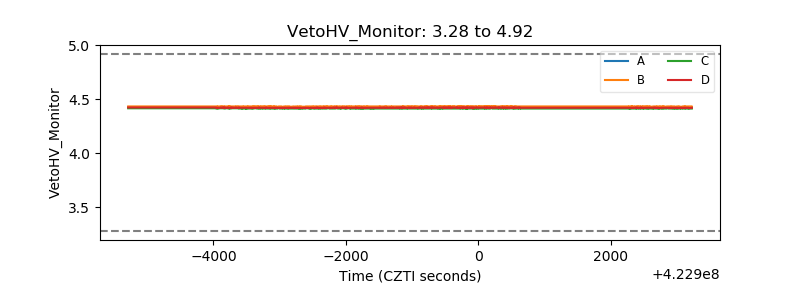 |
| Veto LLD | 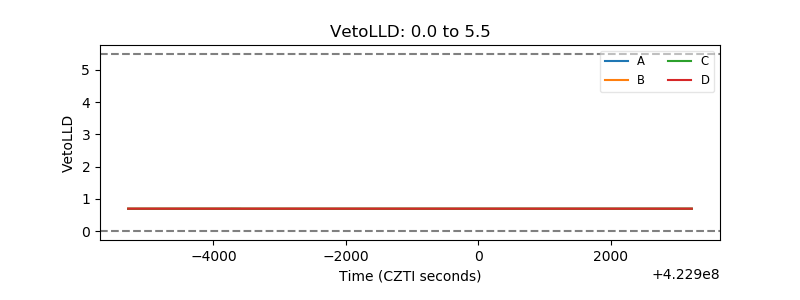 |
| Alpha Counter | 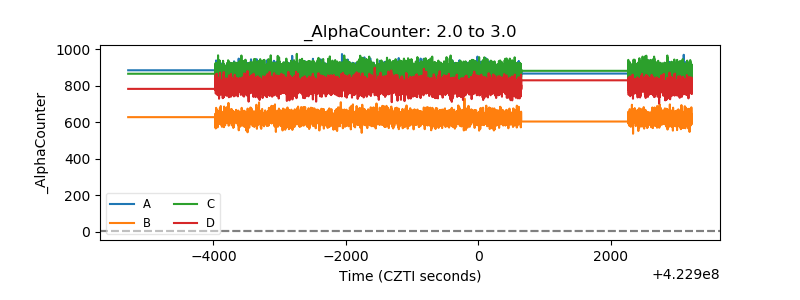 |
| _CPM_Rate | 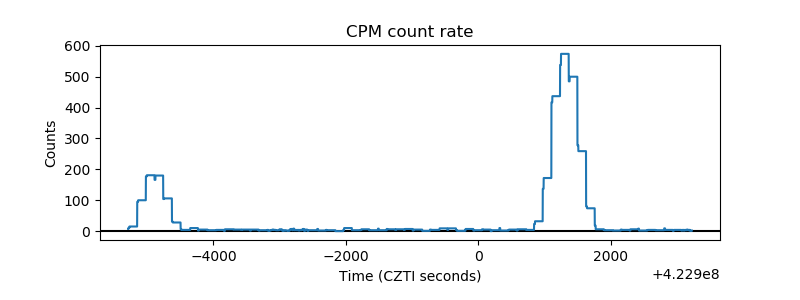 |
| CZT Counter | 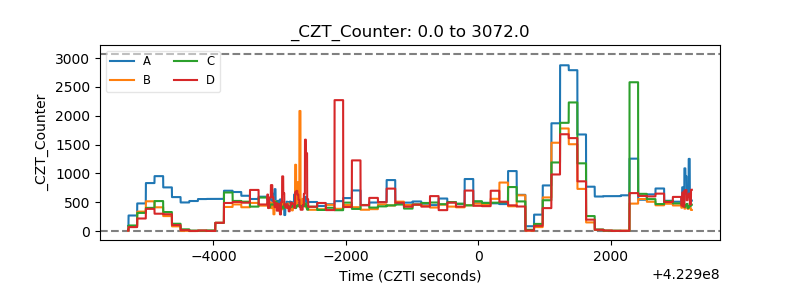 |
| +2.5 Volts monitor |  |
| +5 Volts monitor | 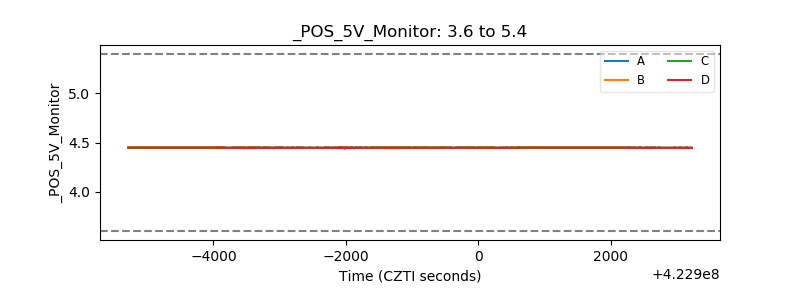 |
| _ROLL_ROT |  |
| _Roll_DEC | 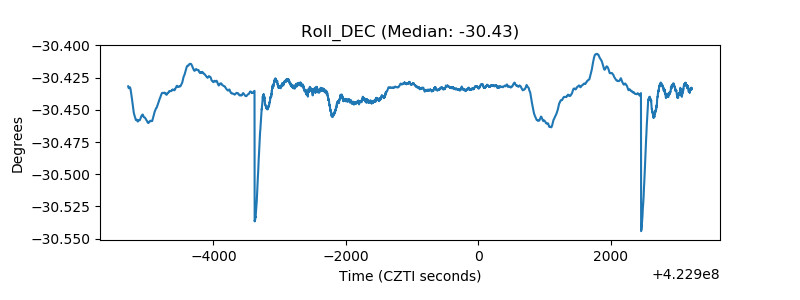 |
| _Roll_RA | 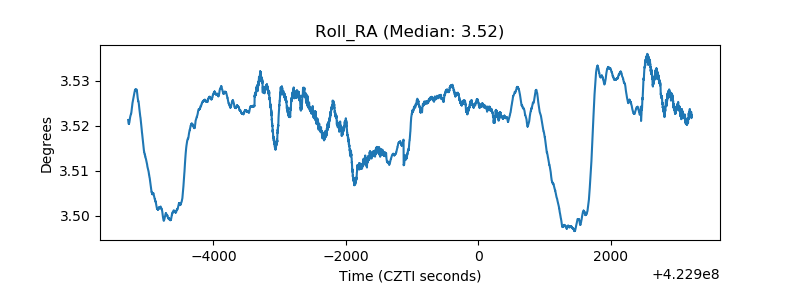 |
| Veto Counter | 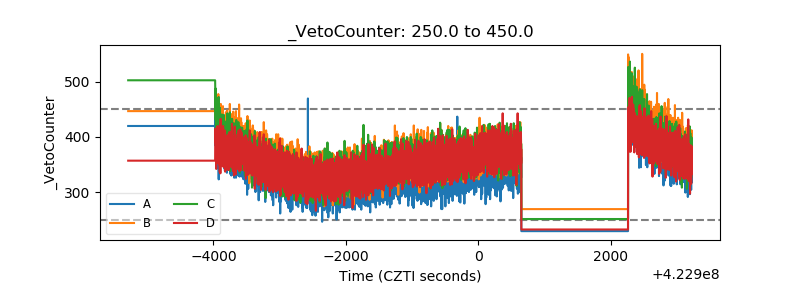 |