| Param | Original file | Final file |
|---|---|---|
| Filename | modeM0/AS1A12_035T01_9000005666_41428cztM0_level2.fits | modeM0/AS1A12_035T01_9000005666_41428cztM0_level2_quad_clean.evt |
| Size (bytes) | 351,221,760 | 88,248,960 |
| Size | 335.0 MB | 84.2 MB |
| Events in quadrant A | 3,066,405 | 603,096 |
| Events in quadrant B | 2,646,490 | 616,186 |
| Events in quadrant C | 3,066,156 | 553,218 |
| Events in quadrant D | 3,811,252 | 530,407 |
| Mode M0 | |||
|---|---|---|---|
| Quadrant | BADHDUFLAG | Total packets | Discarded packets |
| A | 0 | 12319 | 3 |
| B | 0 | 11461 | 2 |
| C | 0 | 12365 | 2 |
| D | 0 | 14869 | 2 |
| Mode SS | |||
|---|---|---|---|
| Quadrant | BADHDUFLAG | Total packets | Discarded packets |
| A | 0 | 106 | 0 |
| B | 0 | 106 | 0 |
| C | 0 | 106 | 0 |
| D | 0 | 106 | 0 |
| Mode M9 | |||
|---|---|---|---|
| Quadrant | BADHDUFLAG | Total packets | Discarded packets |
| A | 0 | 28 | 0 |
| B | 0 | 28 | 0 |
| C | 0 | 28 | 0 |
| D | 0 | 29 | 0 |
| Quadrant | Total seconds | Saturated seconds | Saturation percentage |
|---|---|---|---|
| A | 5276 | 24 | 0.454890% |
| B | 5276 | 36 | 0.682335% |
| C | 5276 | 246 | 4.662623% |
| D | 5276 | 196 | 3.714936% |
Noise dominated data is calculated using 1-second bins in cleaned event files. If a bin has >2000 counts, and if more than 50% of those come from <1% of pixels, then it is considered to be noise-dominated and hence unusable.
| Quadrant | # 1 sec bins | Bins with >0 counts | Bins with >2000 counts | High rate bins dominated by noise | Noise dominated (total time) | Noise dominated (detector-on time) | Marked lightcurve |
|---|---|---|---|---|---|---|---|
| A | 7037 | 5277 | 3 | 3 | 0.04% | 0.06% | 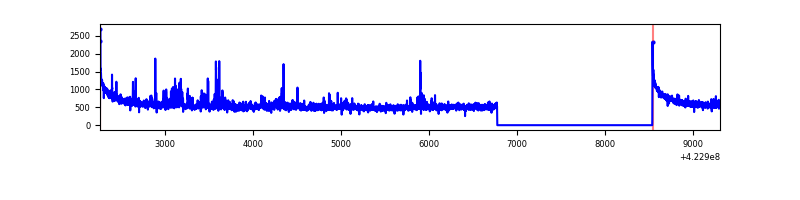 |
| B | 7037 | 5277 | 18 | 18 | 0.26% | 0.34% | 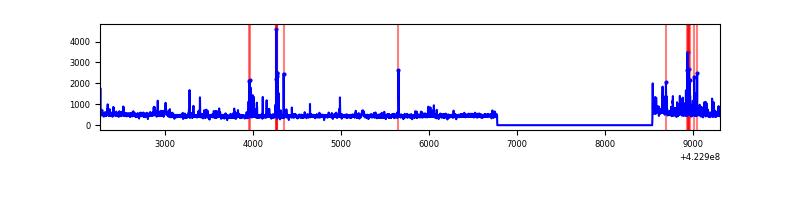 |
| C | 7037 | 5277 | 237 | 237 | 3.37% | 4.49% | 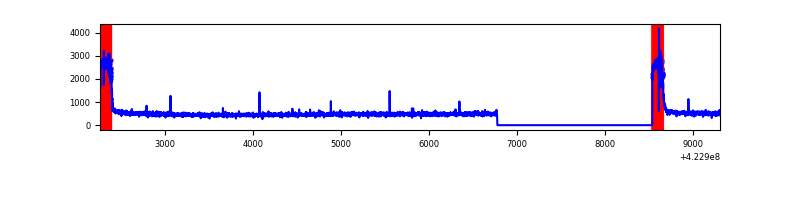 |
| D | 7037 | 5277 | 168 | 168 | 2.39% | 3.18% | 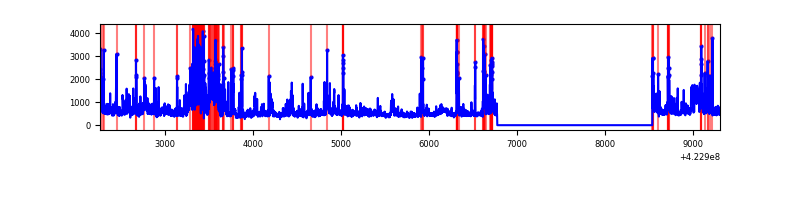 |
Top three noisy pixels from each quadrant. If the there are fewer than three noisy pixels in the level2.evt file, extra rows are filled as -1
| Pixel properties | Quadrant properties | ||||||
|---|---|---|---|---|---|---|---|
| Quadrant | DetID | PixID | Counts | Sigma | Mean | Median | Sigma |
| A | 10 | 83 | 525456 | 4256.08 | 599 | 587 | 123.3 |
| A | 2 | 79 | 193956 | 1568.0 | 599 | 587 | 123.3 |
| A | 12 | 189 | 23628 | 186.84 | 599 | 587 | 123.3 |
| B | 5 | 255 | 110312 | 956.01 | 594 | 578 | 114.8 |
| B | 0 | 190 | 84359 | 729.91 | 594 | 578 | 114.8 |
| B | 5 | 252 | 59218 | 510.88 | 594 | 578 | 114.8 |
| C | 0 | 10 | 652458 | 4961.01 | 561 | 563 | 131.4 |
| C | 15 | 214 | 213237 | 1618.48 | 561 | 563 | 131.4 |
| C | 15 | 111 | 6523 | 45.36 | 561 | 563 | 131.4 |
| D | 1 | 47 | 627185 | 4464.81 | 576 | 560 | 140.3 |
| D | 12 | 79 | 395970 | 2817.36 | 576 | 560 | 140.3 |
| D | 13 | 249 | 195485 | 1388.87 | 576 | 560 | 140.3 |
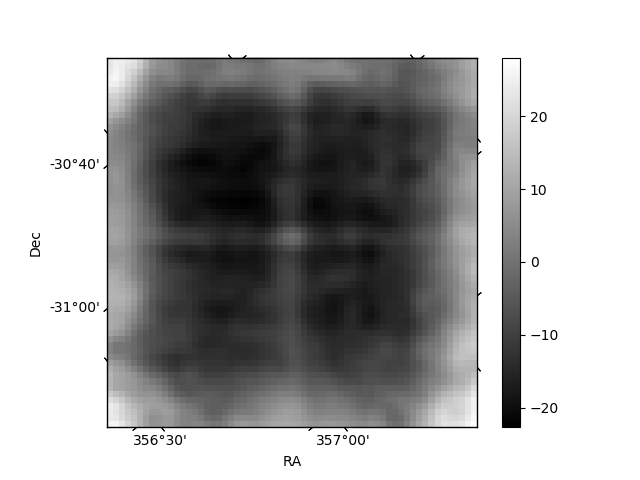
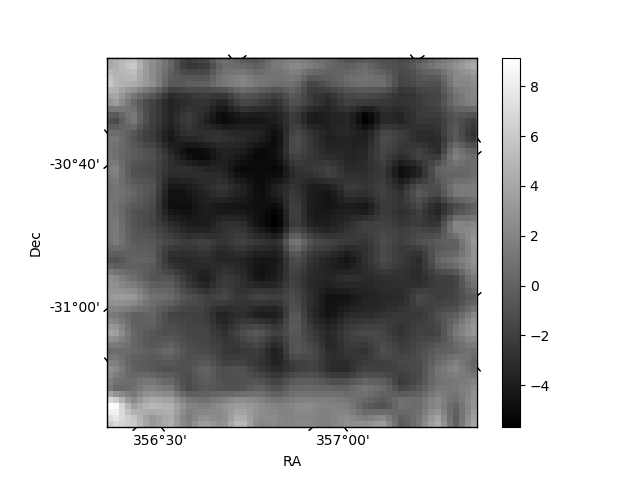
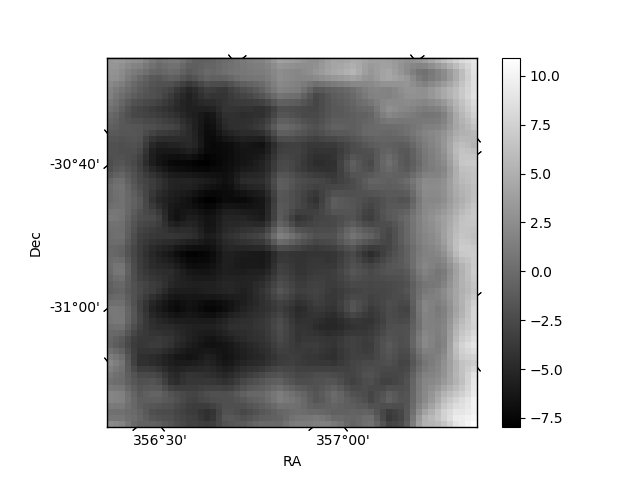
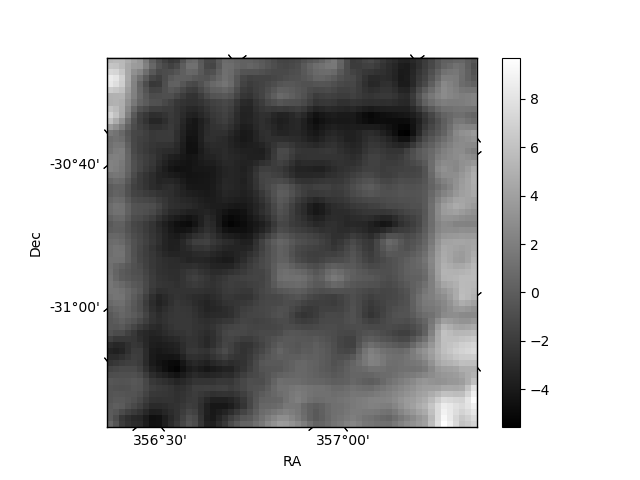
Histogram calculated using DETX and DETY for each event in the final _common_clean file
| Quadrant A | 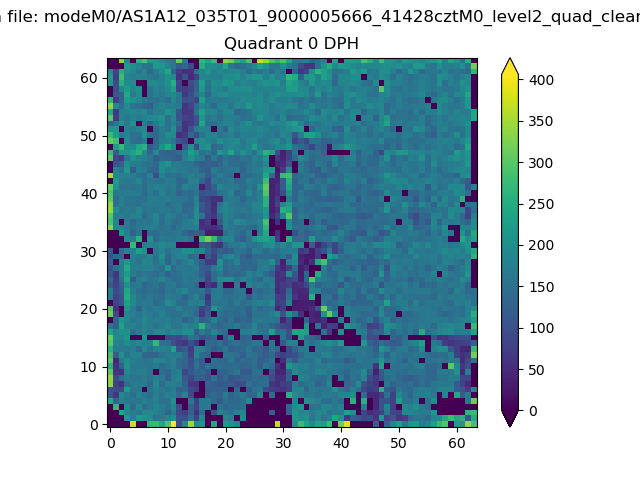 |
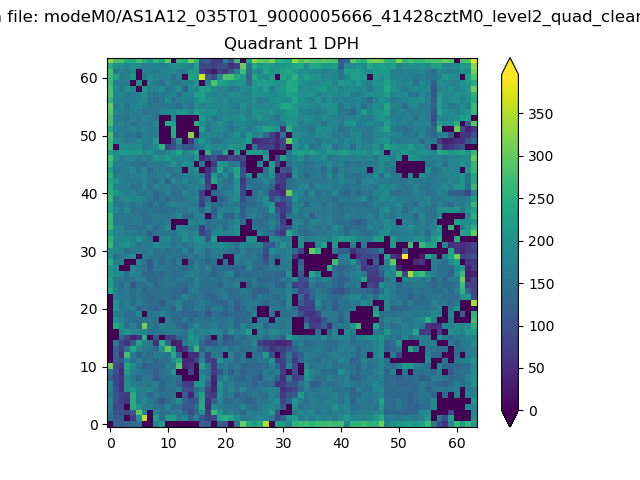 |
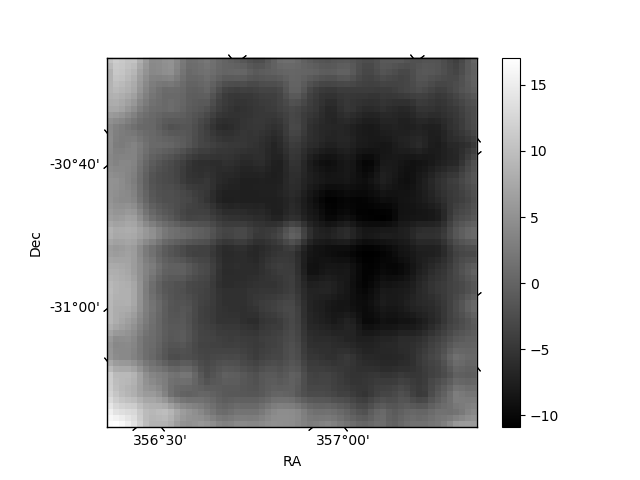
Quadrant B |
|---|---|---|---|
| Quadrant D | 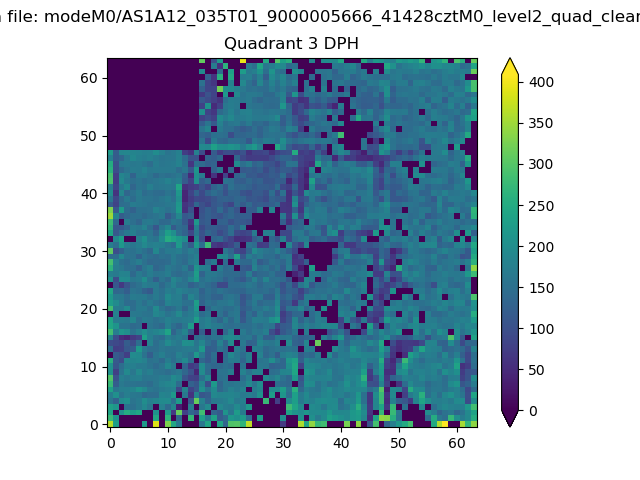 |
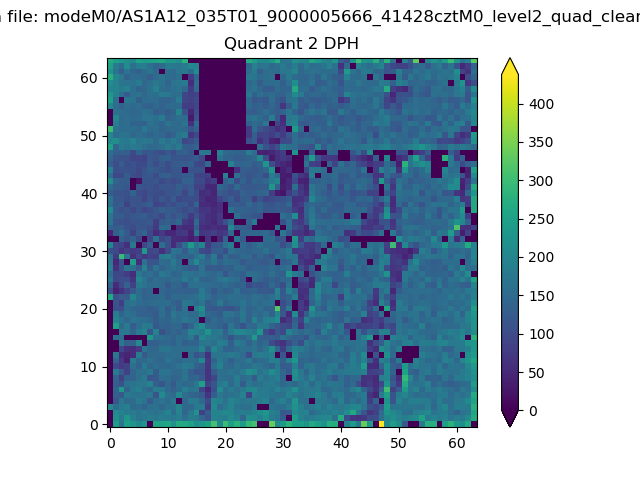 |
Quadrant C |
| Plot type | Count rate plots | Images |
|---|---|---|
| Comparison with Poisson distribution Blue bars denote a histogram of data divided into 1 sec bins. Red curve is a Poisson curve with rate = median count rate of data. |
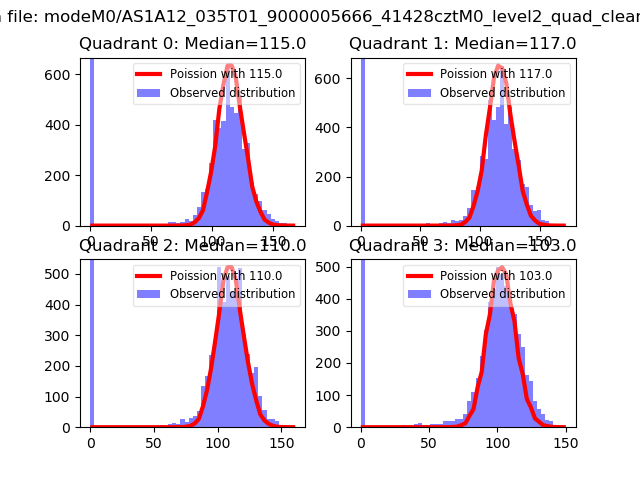 |
 |
| Quadrant-wise count rates Data is divided into 100 sec bins |
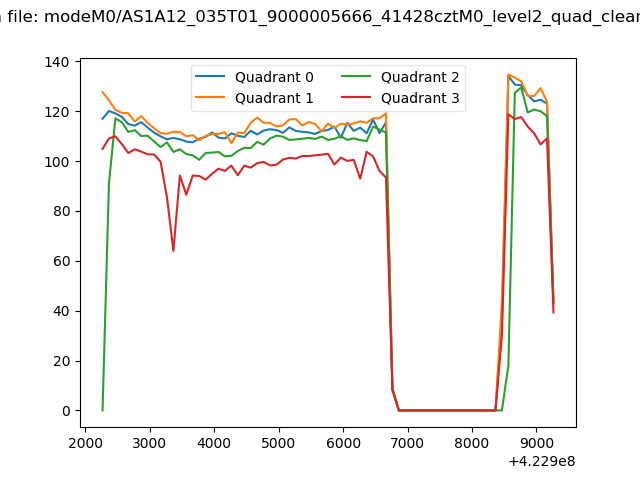 |
|
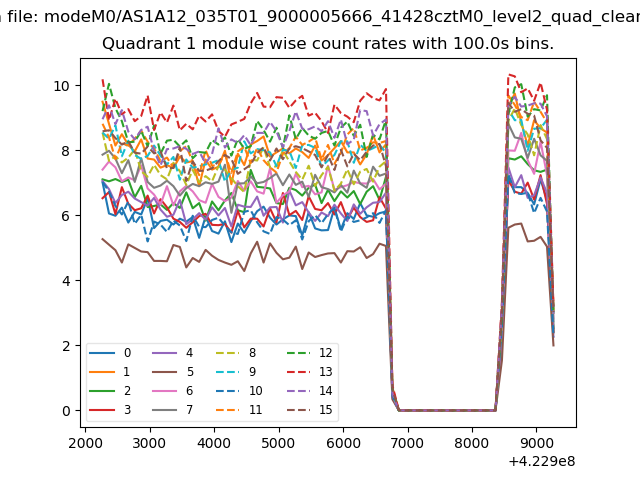
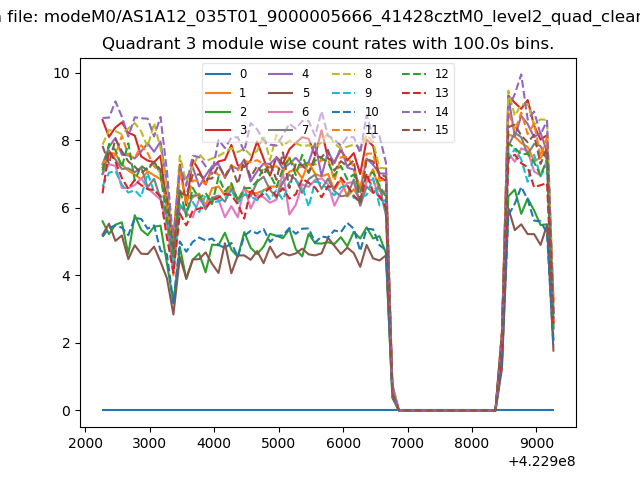
| Module-wise count rates for Quadrant A Data is divided into 100 sec bins |
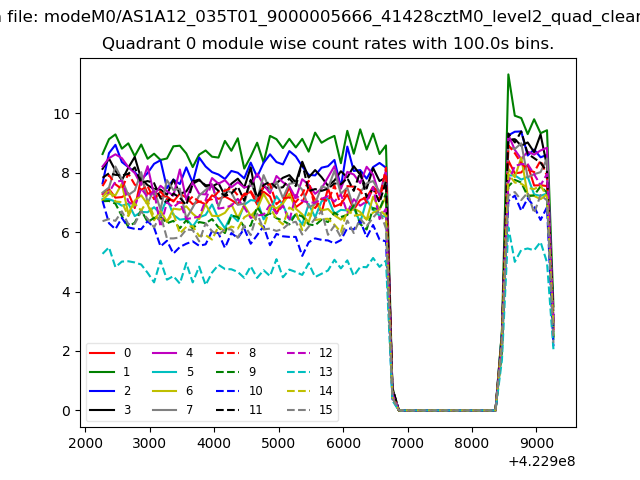 |
 |
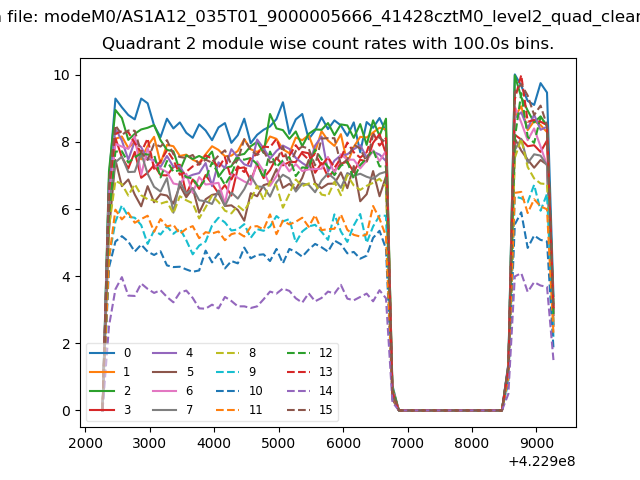
| Module-wise count rates for Quadrant B Data is divided into 100 sec bins |
 |
 |
| Module-wise count rates for Quadrant C Data is divided into 100 sec bins |
 |
 |
| Module-wise count rates for Quadrant D Data is divided into 100 sec bins |
 |
 |
| Parameter | Plot |
|---|---|
| CZT HV Monitor |  |
| D_VDD | 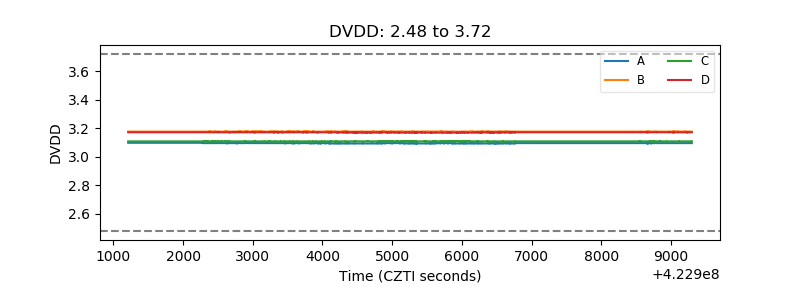 |
| Temperature 1 | 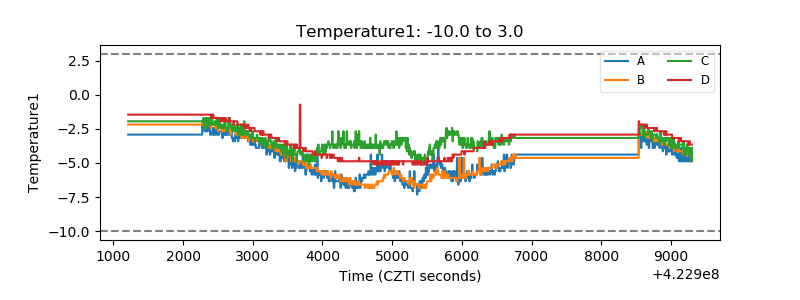 |
| Veto HV Monitor | 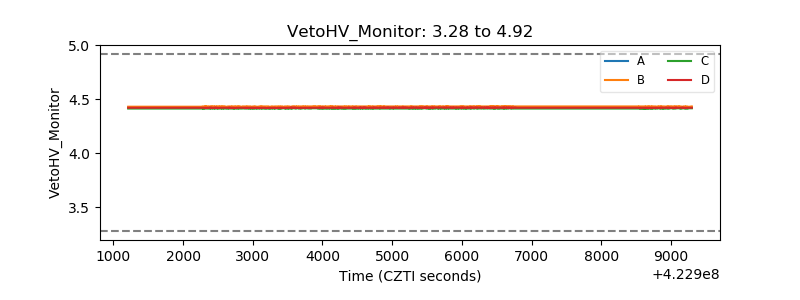 |
| Veto LLD | 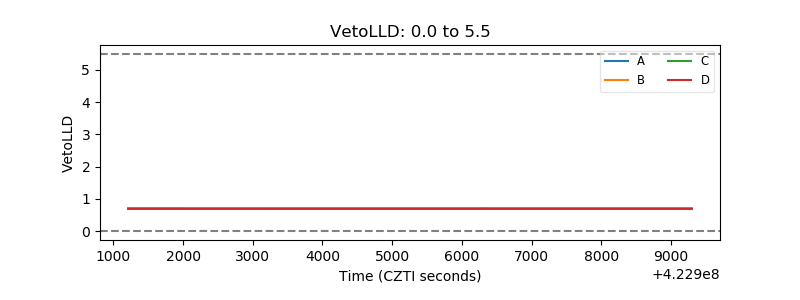 |
| Alpha Counter | 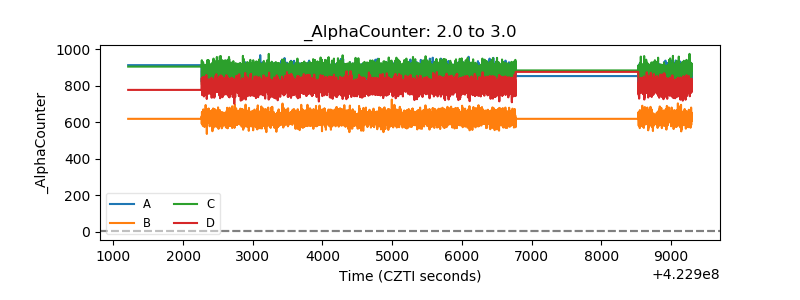 |
| _CPM_Rate |  |
| CZT Counter | 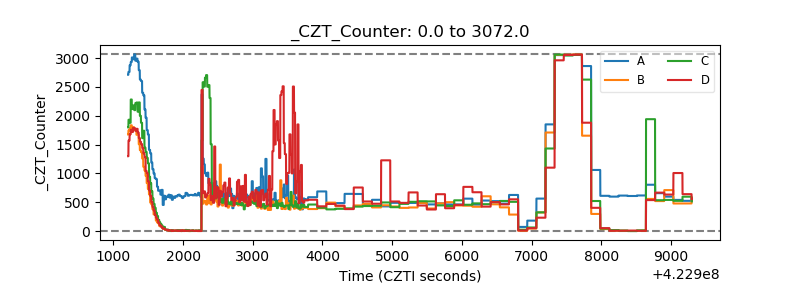 |
| +2.5 Volts monitor | 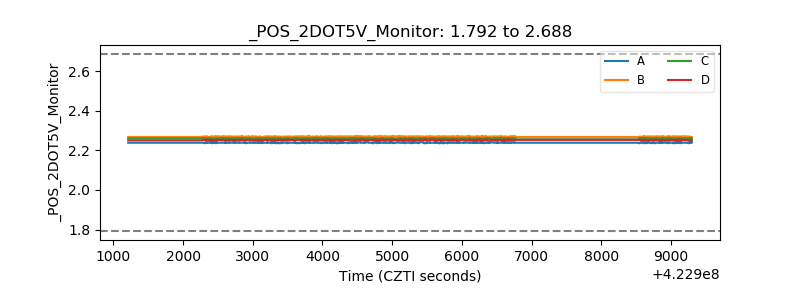 |
| +5 Volts monitor | 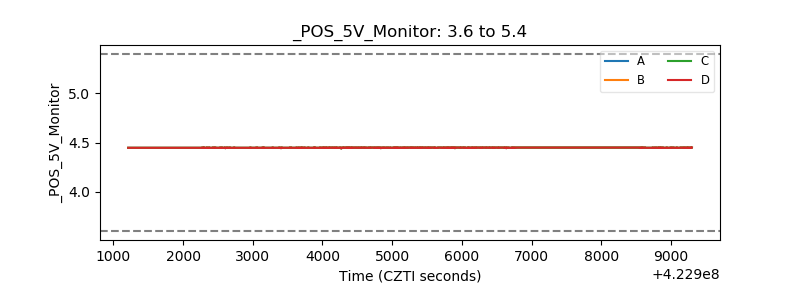 |
| _ROLL_ROT | 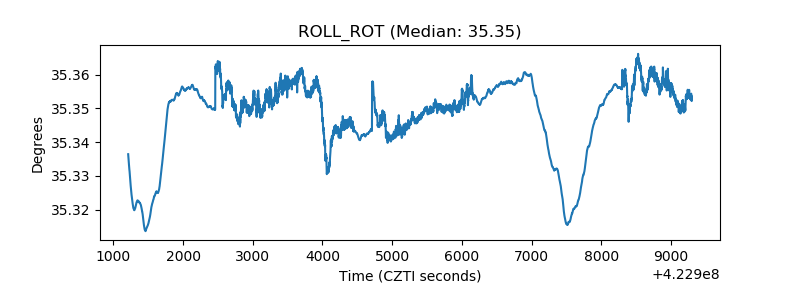 |
| _Roll_DEC | 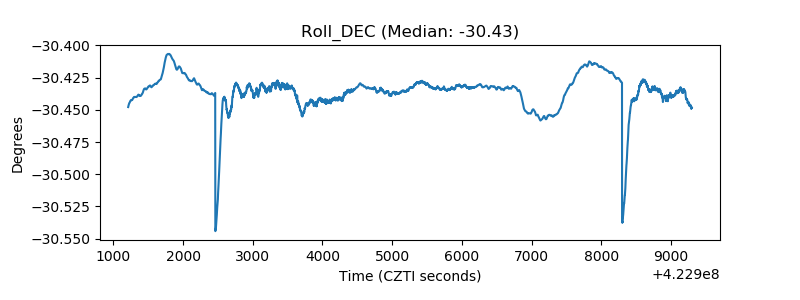 |
| _Roll_RA | 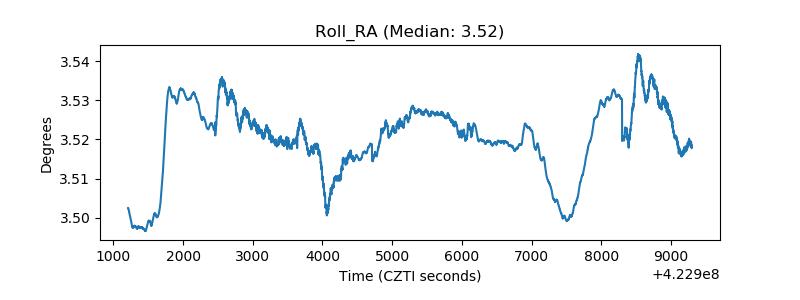 |
| Veto Counter | 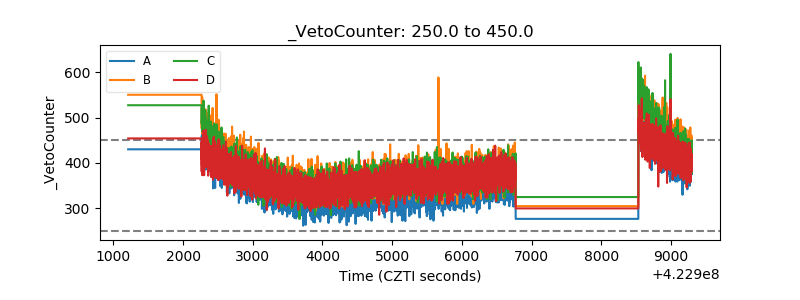 |