| Param | Original file | Final file |
|---|---|---|
| Filename | modeM0/AS1A12_035T01_9000005666_41429cztM0_level2.fits | modeM0/AS1A12_035T01_9000005666_41429cztM0_level2_quad_clean.evt |
| Size (bytes) | 358,257,600 | 90,031,680 |
| Size | 341.7 MB | 85.9 MB |
| Events in quadrant A | 2,904,058 | 626,188 |
| Events in quadrant B | 2,759,347 | 638,955 |
| Events in quadrant C | 3,159,772 | 571,453 |
| Events in quadrant D | 4,036,227 | 527,632 |
| Mode M0 | |||
|---|---|---|---|
| Quadrant | BADHDUFLAG | Total packets | Discarded packets |
| A | 0 | 11714 | 3 |
| B | 0 | 11660 | 2 |
| C | 0 | 12512 | 2 |
| D | 0 | 15488 | 2 |
| Mode SS | |||
|---|---|---|---|
| Quadrant | BADHDUFLAG | Total packets | Discarded packets |
| A | 0 | 106 | 0 |
| B | 0 | 106 | 0 |
| C | 0 | 106 | 0 |
| D | 0 | 106 | 0 |
| Mode M9 | |||
|---|---|---|---|
| Quadrant | BADHDUFLAG | Total packets | Discarded packets |
| A | 0 | 25 | 0 |
| B | 0 | 25 | 0 |
| C | 0 | 25 | 0 |
| D | 0 | 26 | 0 |
| Quadrant | Total seconds | Saturated seconds | Saturation percentage |
|---|---|---|---|
| A | 5166 | 24 | 0.464576% |
| B | 5166 | 42 | 0.813008% |
| C | 5166 | 238 | 4.607046% |
| D | 5166 | 366 | 7.084785% |
Noise dominated data is calculated using 1-second bins in cleaned event files. If a bin has >2000 counts, and if more than 50% of those come from <1% of pixels, then it is considered to be noise-dominated and hence unusable.
| Quadrant | # 1 sec bins | Bins with >0 counts | Bins with >2000 counts | High rate bins dominated by noise | Noise dominated (total time) | Noise dominated (detector-on time) | Marked lightcurve |
|---|---|---|---|---|---|---|---|
| A | 7050 | 5167 | 4 | 4 | 0.06% | 0.08% | 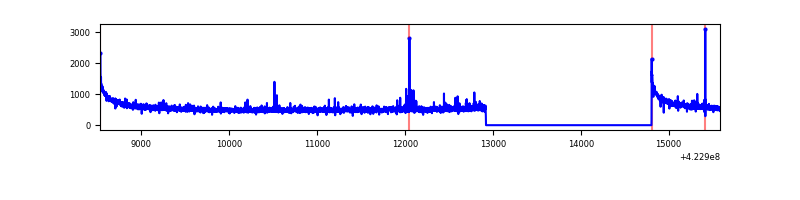 |
| B | 7050 | 5167 | 22 | 22 | 0.31% | 0.43% | 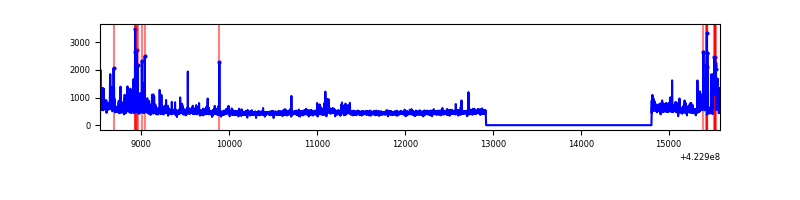 |
| C | 7050 | 5167 | 223 | 223 | 3.16% | 4.32% | 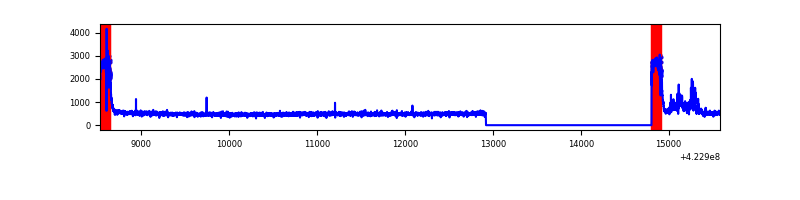 |
| D | 7050 | 5167 | 310 | 310 | 4.40% | 6.00% | 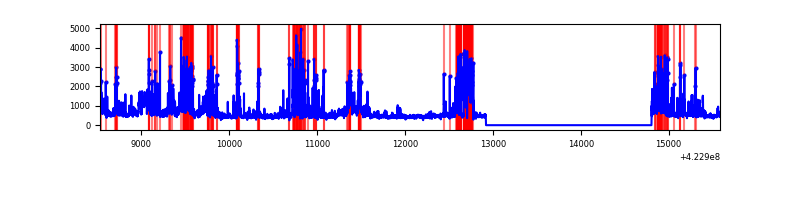 |
Top three noisy pixels from each quadrant. If the there are fewer than three noisy pixels in the level2.evt file, extra rows are filled as -1
| Pixel properties | Quadrant properties | ||||||
|---|---|---|---|---|---|---|---|
| Quadrant | DetID | PixID | Counts | Sigma | Mean | Median | Sigma |
| A | 10 | 83 | 511768 | 4131.07 | 603 | 591 | 123.7 |
| A | 13 | 248 | 39626 | 315.46 | 603 | 591 | 123.7 |
| A | 2 | 79 | 12746 | 98.23 | 603 | 591 | 123.7 |
| B | 5 | 255 | 214973 | 1866.46 | 599 | 583 | 114.9 |
| B | 0 | 190 | 125550 | 1087.95 | 599 | 583 | 114.9 |
| B | 5 | 252 | 33085 | 282.96 | 599 | 583 | 114.9 |
| C | 0 | 10 | 600716 | 4574.79 | 569 | 573 | 131.2 |
| C | 15 | 214 | 212219 | 1613.34 | 569 | 573 | 131.2 |
| C | 15 | 111 | 121606 | 922.61 | 569 | 573 | 131.2 |
| D | 13 | 249 | 804107 | 5821.72 | 568 | 554 | 138.0 |
| D | 1 | 52 | 267891 | 1936.85 | 568 | 554 | 138.0 |
| D | 12 | 79 | 254973 | 1843.26 | 568 | 554 | 138.0 |
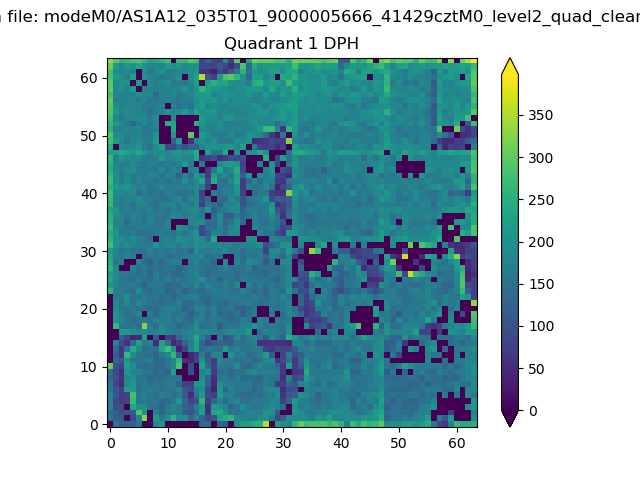
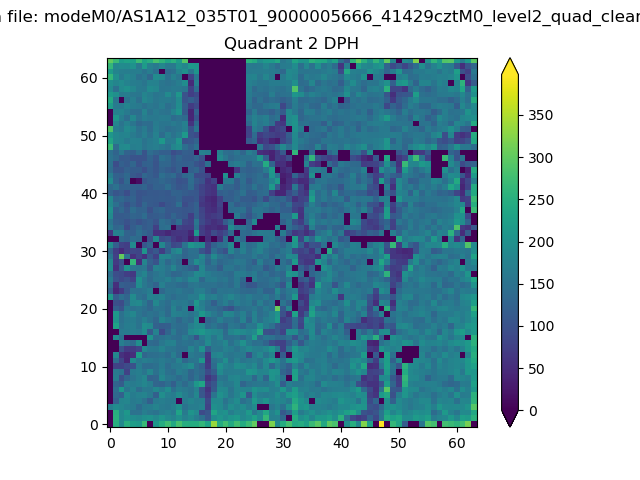
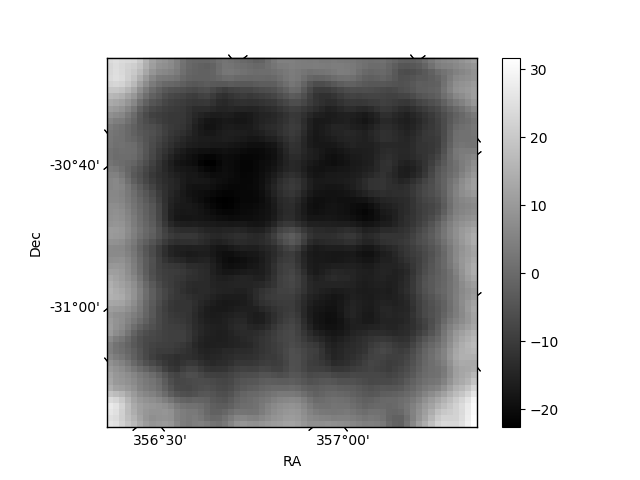
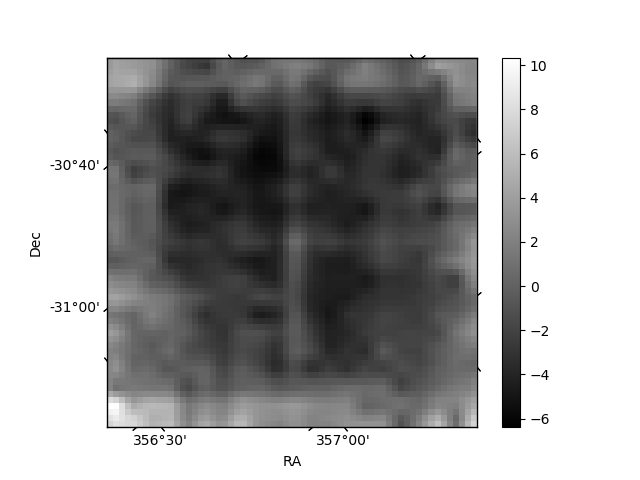
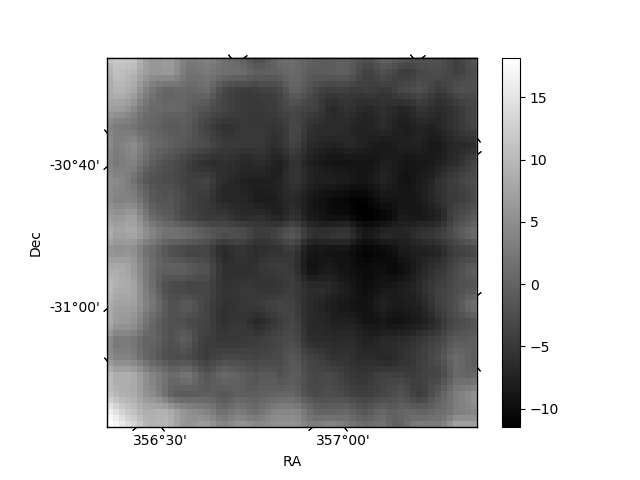
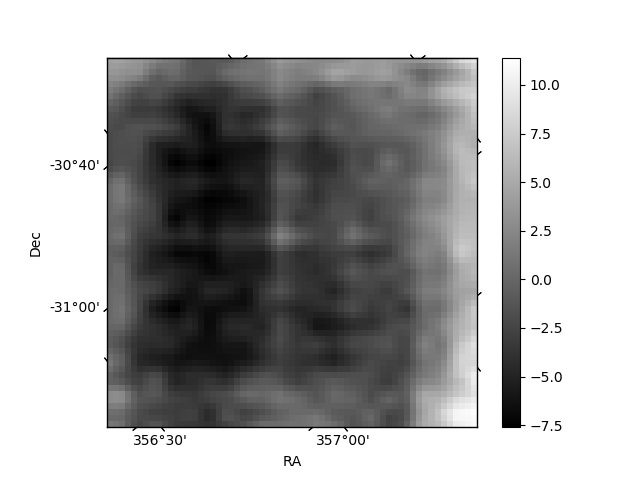
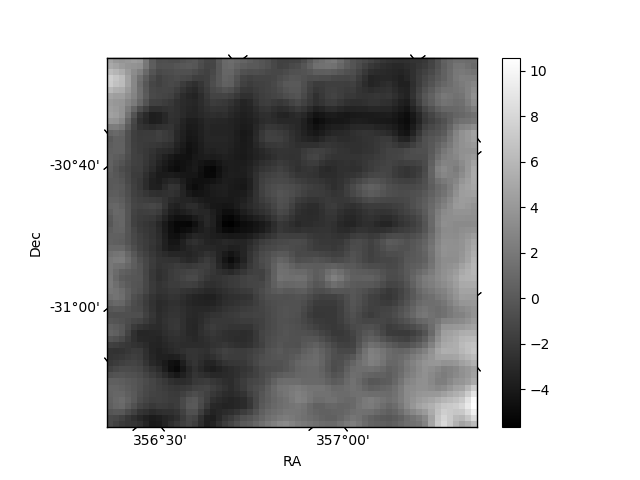
Histogram calculated using DETX and DETY for each event in the final _common_clean file
| Quadrant A |  |
 |
Quadrant B |
|---|---|---|---|
| Quadrant D | 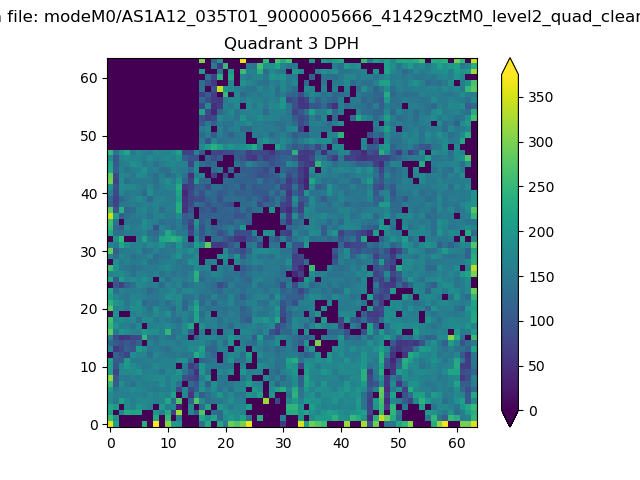 |
 |
Quadrant C |
| Plot type | Count rate plots | Images |
|---|---|---|
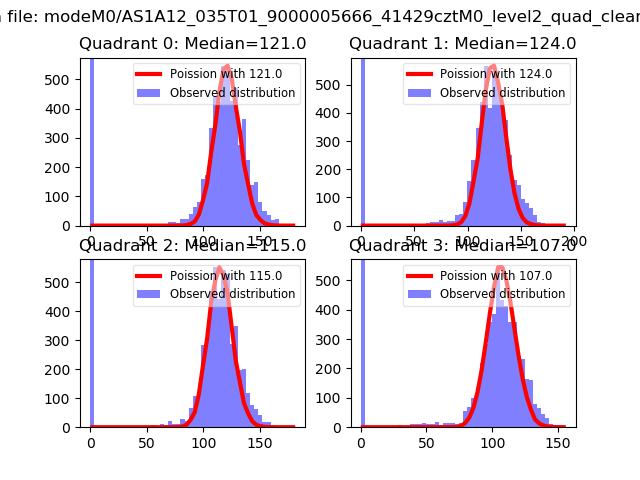
| Comparison with Poisson distribution Blue bars denote a histogram of data divided into 1 sec bins. Red curve is a Poisson curve with rate = median count rate of data. |
 |
 |
| Quadrant-wise count rates Data is divided into 100 sec bins |
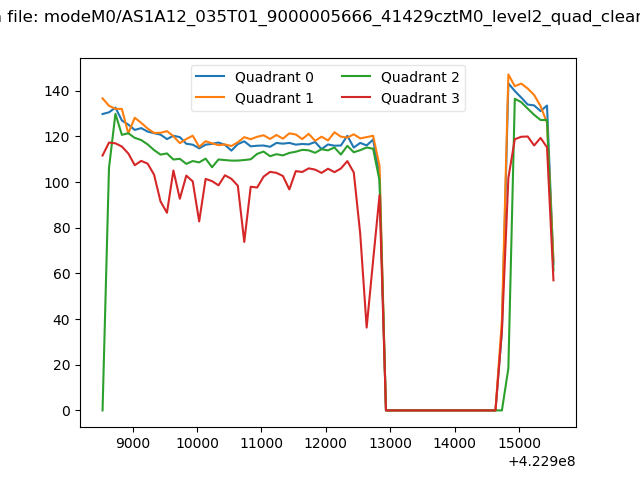 |
|
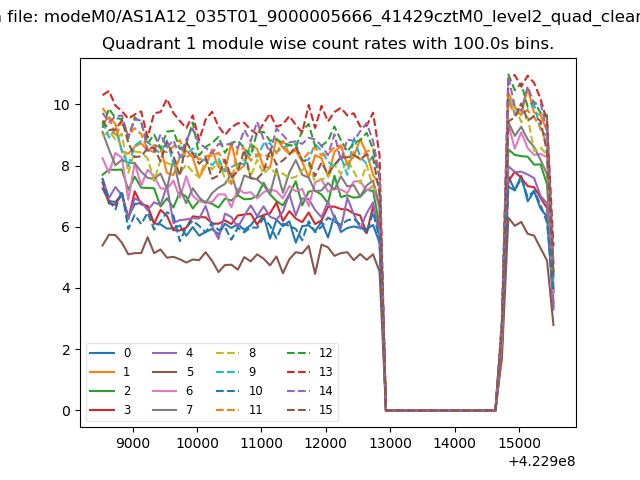
| Module-wise count rates for Quadrant A Data is divided into 100 sec bins |
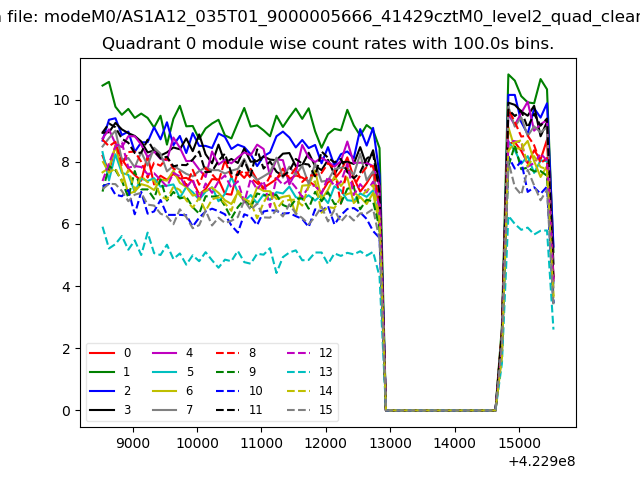 |
 |
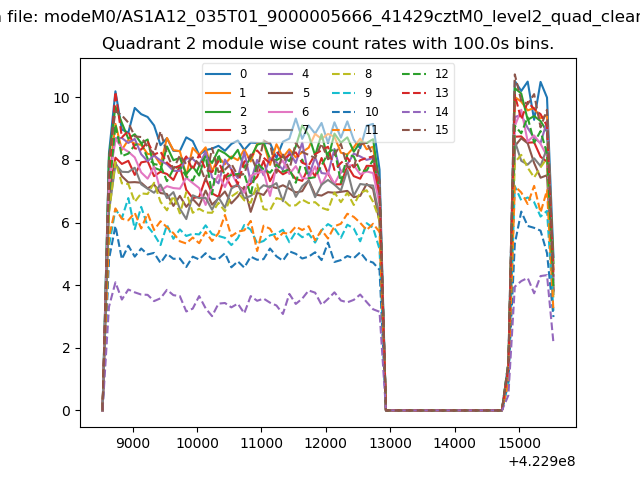
| Module-wise count rates for Quadrant B Data is divided into 100 sec bins |
 |
 |
| Module-wise count rates for Quadrant C Data is divided into 100 sec bins |
 |
 |
| Module-wise count rates for Quadrant D Data is divided into 100 sec bins |
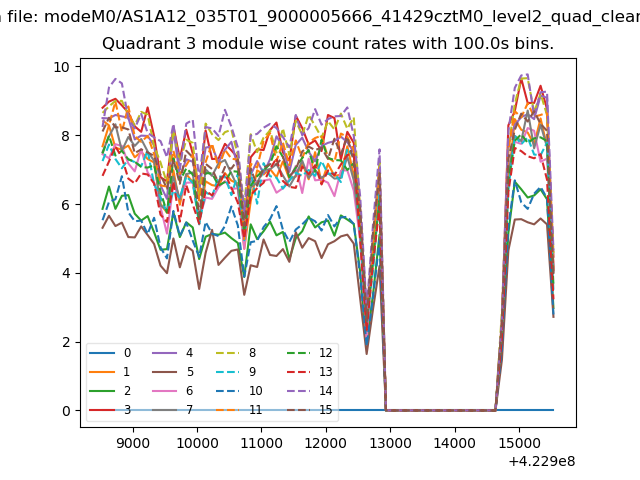 |
 |
| Parameter | Plot |
|---|---|
| CZT HV Monitor | 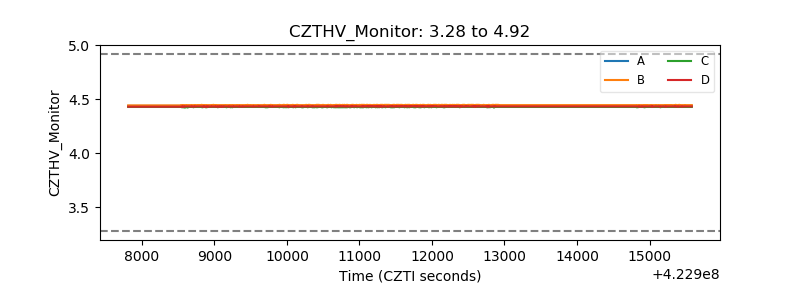 |
| D_VDD | 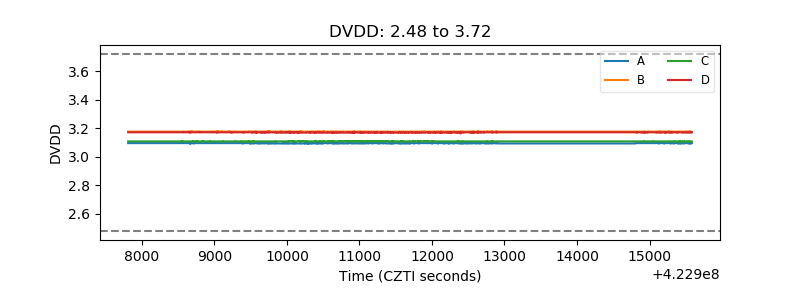 |
| Temperature 1 | 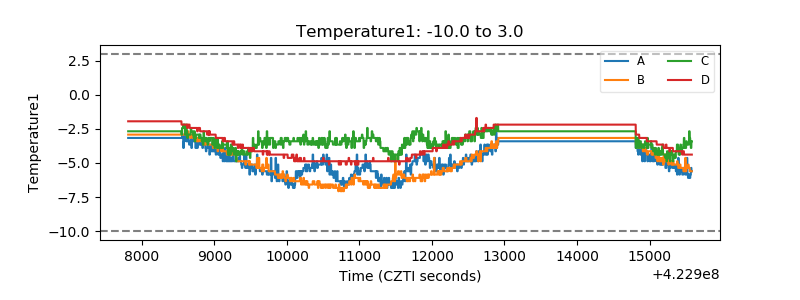 |
| Veto HV Monitor | 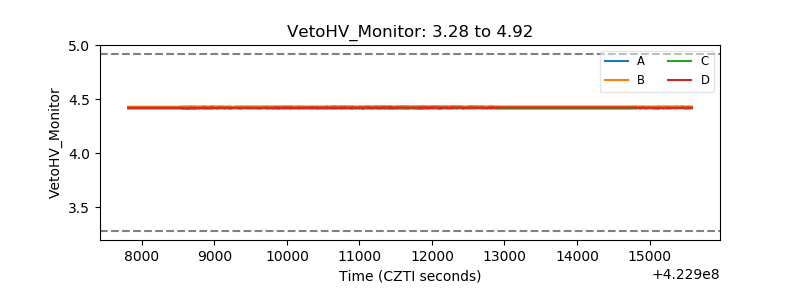 |
| Veto LLD | 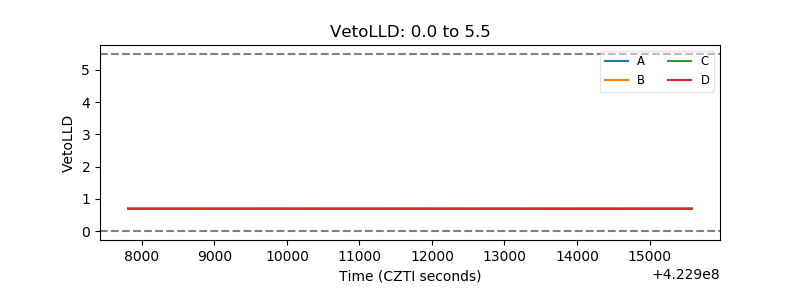 |
| Alpha Counter | 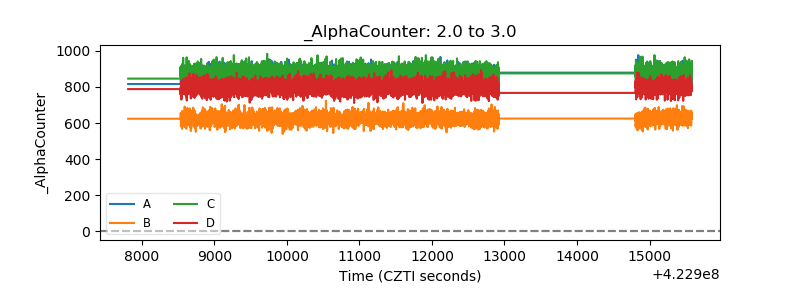 |
| _CPM_Rate |  |
| CZT Counter | 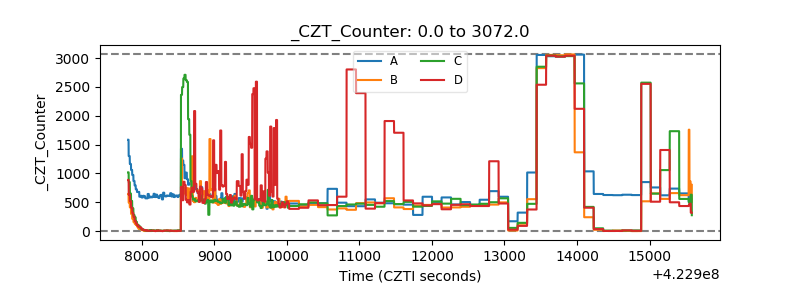 |
| +2.5 Volts monitor | 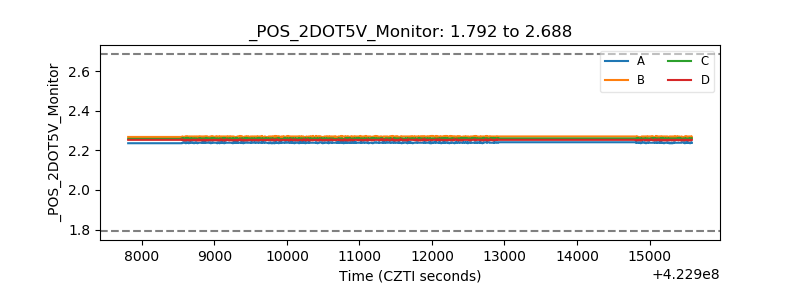 |
| +5 Volts monitor | 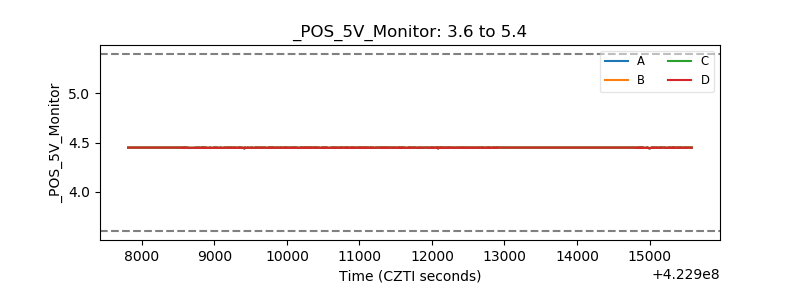 |
| _ROLL_ROT | 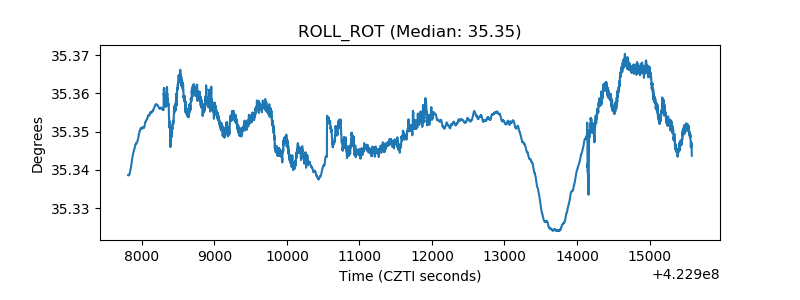 |
| _Roll_DEC | 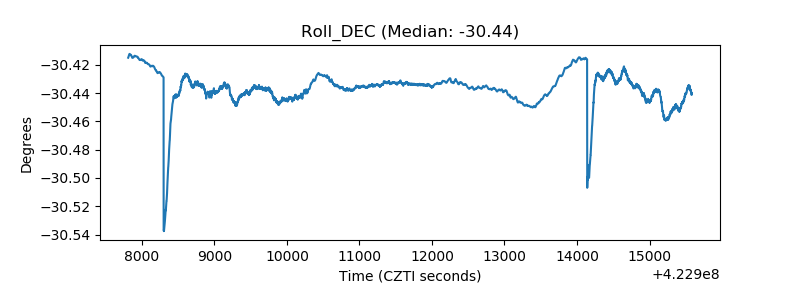 |
| _Roll_RA | 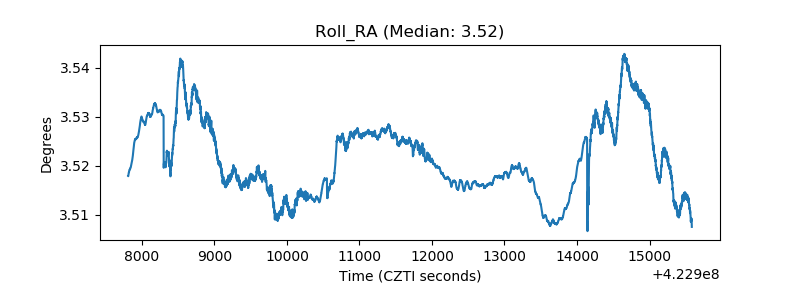 |
| Veto Counter | 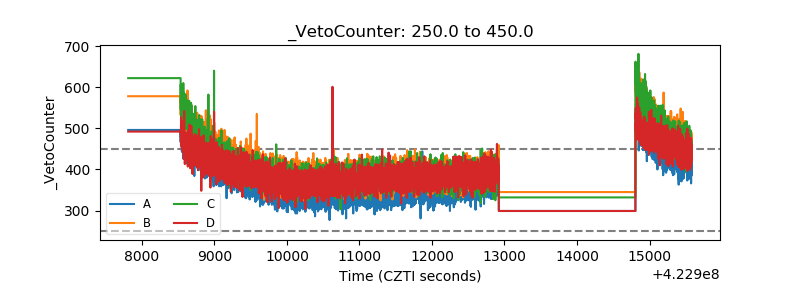 |