| Param | Original file | Final file |
|---|---|---|
| Filename | modeM0/AS1A12_035T01_9000005666_41430cztM0_level2.fits | modeM0/AS1A12_035T01_9000005666_41430cztM0_level2_quad_clean.evt |
| Size (bytes) | 365,057,280 | 93,723,840 |
| Size | 348.1 MB | 89.4 MB |
| Events in quadrant A | 2,951,285 | 652,571 |
| Events in quadrant B | 2,946,687 | 666,935 |
| Events in quadrant C | 3,520,088 | 596,128 |
| Events in quadrant D | 3,689,971 | 557,552 |
| Mode M0 | |||
|---|---|---|---|
| Quadrant | BADHDUFLAG | Total packets | Discarded packets |
| A | 0 | 11826 | 3 |
| B | 0 | 12085 | 2 |
| C | 0 | 13531 | 2 |
| D | 0 | 14406 | 2 |
| Mode SS | |||
|---|---|---|---|
| Quadrant | BADHDUFLAG | Total packets | Discarded packets |
| A | 0 | 110 | 0 |
| B | 0 | 110 | 0 |
| C | 0 | 110 | 0 |
| D | 0 | 110 | 0 |
| Mode M9 | |||
|---|---|---|---|
| Quadrant | BADHDUFLAG | Total packets | Discarded packets |
| A | 0 | 38 | 0 |
| B | 0 | 38 | 0 |
| C | 0 | 38 | 0 |
| D | 0 | 38 | 0 |
| Quadrant | Total seconds | Saturated seconds | Saturation percentage |
|---|---|---|---|
| A | 5205 | 17 | 0.326609% |
| B | 5205 | 70 | 1.344861% |
| C | 5205 | 303 | 5.821326% |
| D | 5205 | 321 | 6.167147% |
Noise dominated data is calculated using 1-second bins in cleaned event files. If a bin has >2000 counts, and if more than 50% of those come from <1% of pixels, then it is considered to be noise-dominated and hence unusable.
| Quadrant | # 1 sec bins | Bins with >0 counts | Bins with >2000 counts | High rate bins dominated by noise | Noise dominated (total time) | Noise dominated (detector-on time) | Marked lightcurve |
|---|---|---|---|---|---|---|---|
| A | 9092 | 5207 | 4 | 4 | 0.04% | 0.08% | 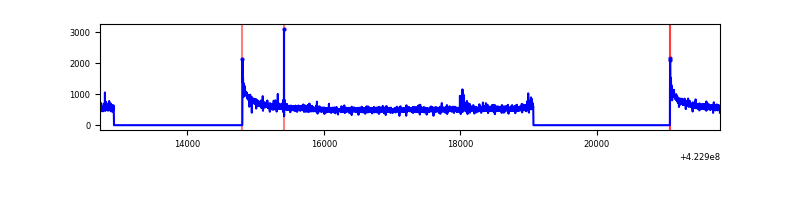 |
| B | 9092 | 5207 | 53 | 53 | 0.58% | 1.02% | 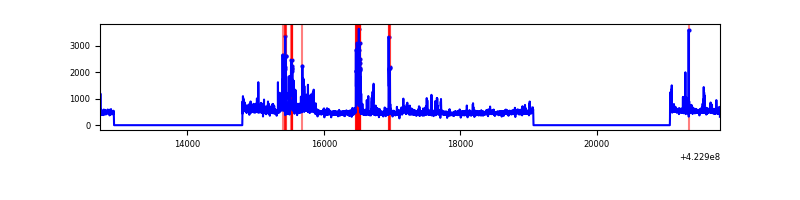 |
| C | 9092 | 5207 | 279 | 279 | 3.07% | 5.36% | 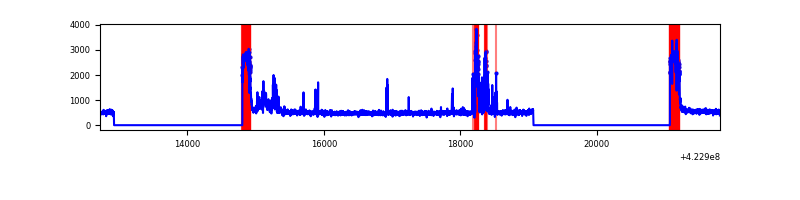 |
| D | 9092 | 5207 | 269 | 269 | 2.96% | 5.17% | 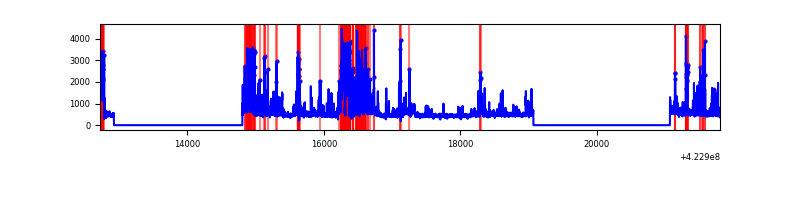 |
Top three noisy pixels from each quadrant. If the there are fewer than three noisy pixels in the level2.evt file, extra rows are filled as -1
| Pixel properties | Quadrant properties | ||||||
|---|---|---|---|---|---|---|---|
| Quadrant | DetID | PixID | Counts | Sigma | Mean | Median | Sigma |
| A | 10 | 83 | 502412 | 3960.91 | 620 | 607 | 126.7 |
| A | 12 | 189 | 18162 | 138.57 | 620 | 607 | 126.7 |
| A | 2 | 79 | 16323 | 124.05 | 620 | 607 | 126.7 |
| B | 5 | 255 | 369502 | 3163.35 | 616 | 600 | 116.6 |
| B | 0 | 190 | 103891 | 885.73 | 616 | 600 | 116.6 |
| B | 5 | 252 | 36817 | 310.56 | 616 | 600 | 116.6 |
| C | 0 | 10 | 624956 | 4584.87 | 589 | 596 | 136.2 |
| C | 15 | 111 | 373173 | 2735.95 | 589 | 596 | 136.2 |
| C | 15 | 214 | 212333 | 1554.85 | 589 | 596 | 136.2 |
| D | 13 | 249 | 759486 | 5309.89 | 591 | 575 | 142.9 |
| D | 13 | 171 | 266751 | 1862.36 | 591 | 575 | 142.9 |
| D | 1 | 52 | 132002 | 919.56 | 591 | 575 | 142.9 |
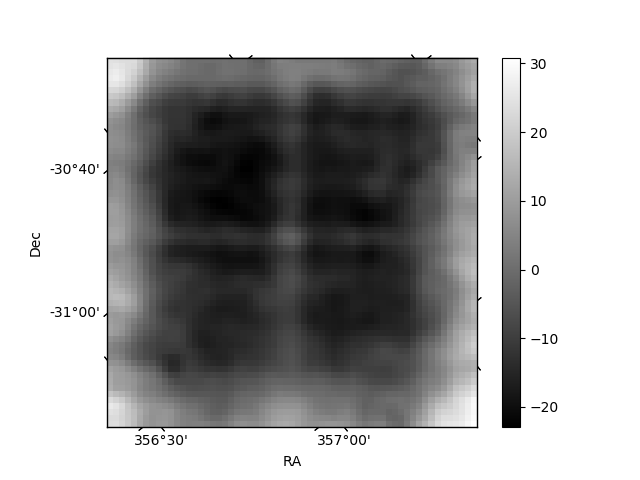
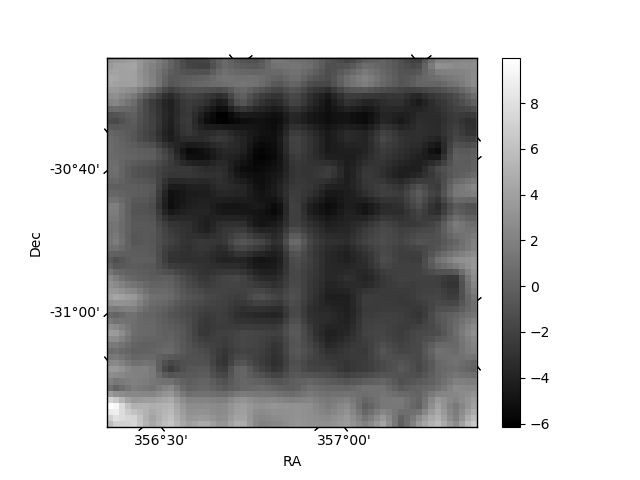
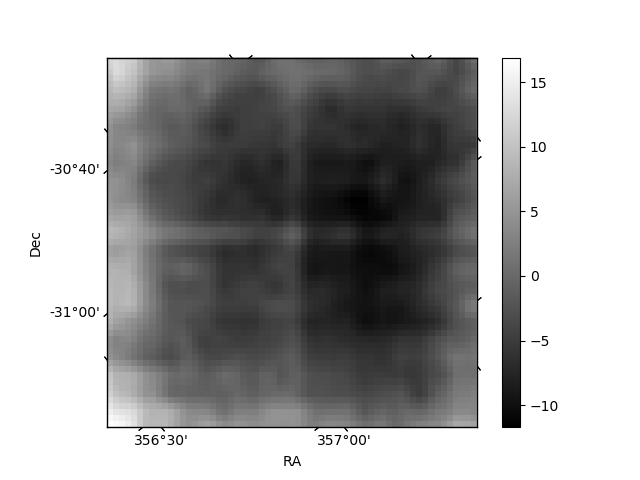
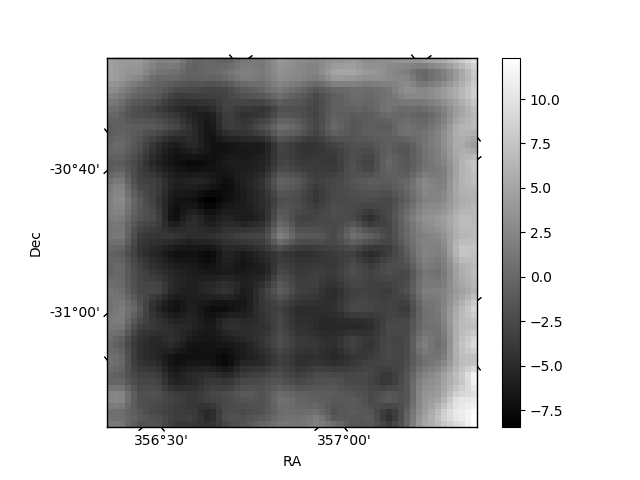
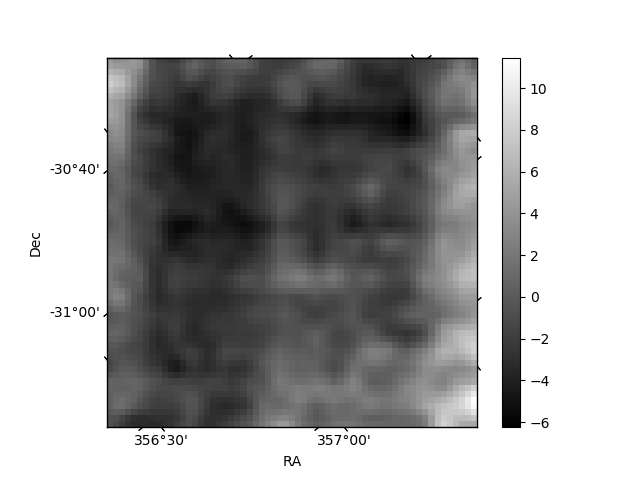
Histogram calculated using DETX and DETY for each event in the final _common_clean file
| Quadrant A | 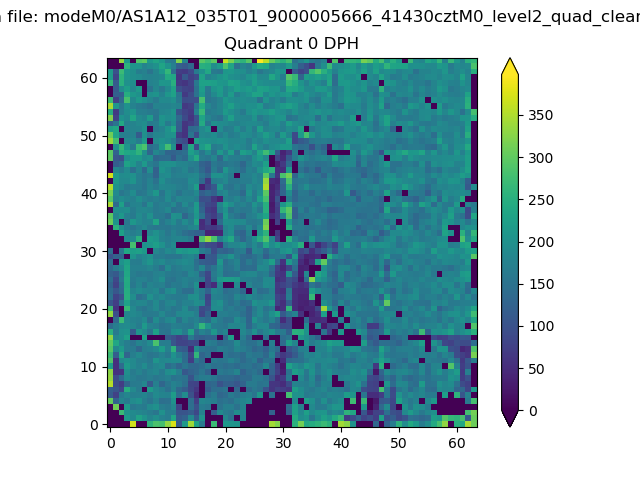 |
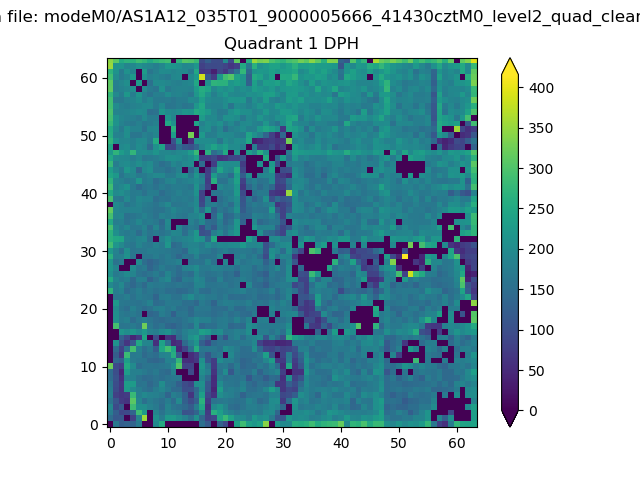 |
Quadrant B |
|---|---|---|---|
| Quadrant D | 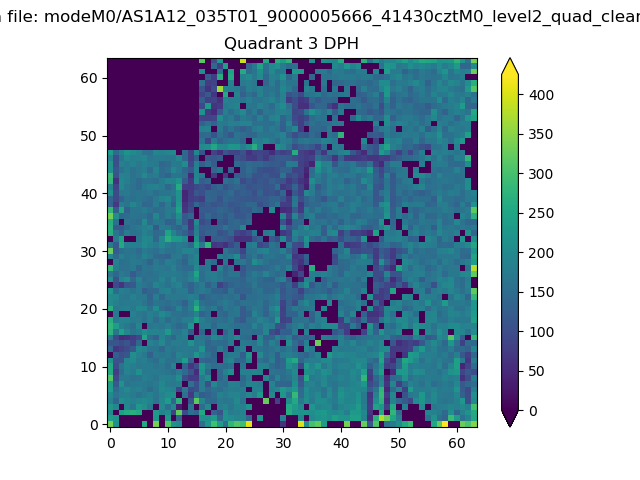 |
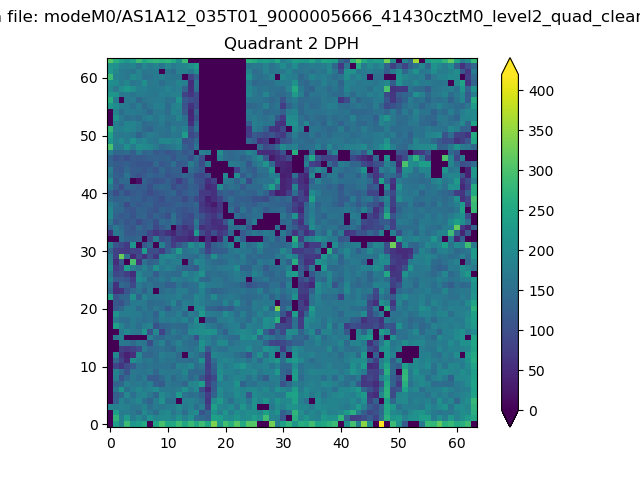 |
Quadrant C |
| Plot type | Count rate plots | Images |
|---|---|---|
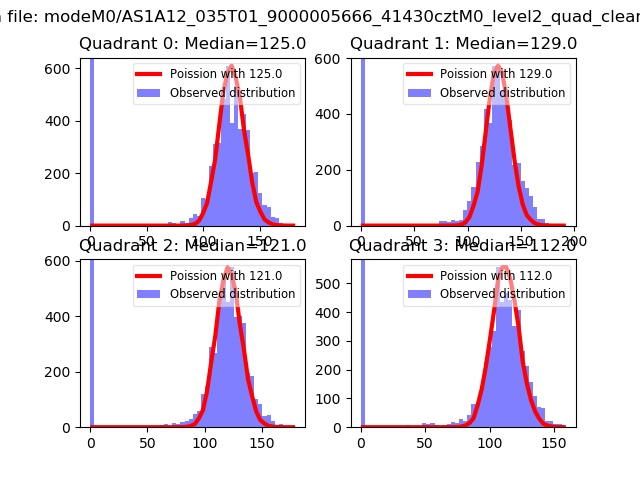
| Comparison with Poisson distribution Blue bars denote a histogram of data divided into 1 sec bins. Red curve is a Poisson curve with rate = median count rate of data. |
 |
 |
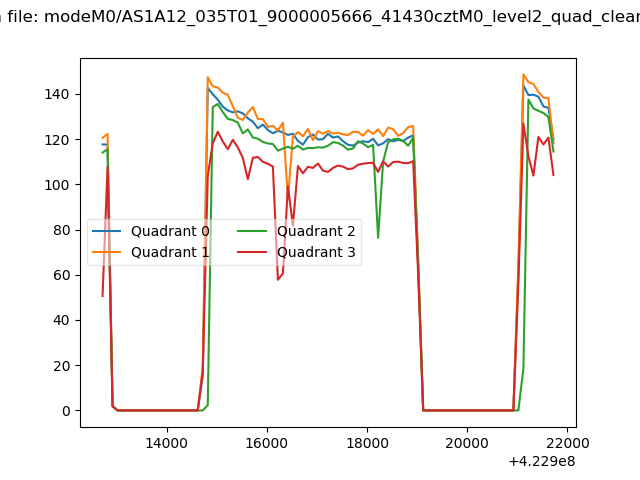
| Quadrant-wise count rates Data is divided into 100 sec bins |
 |
|
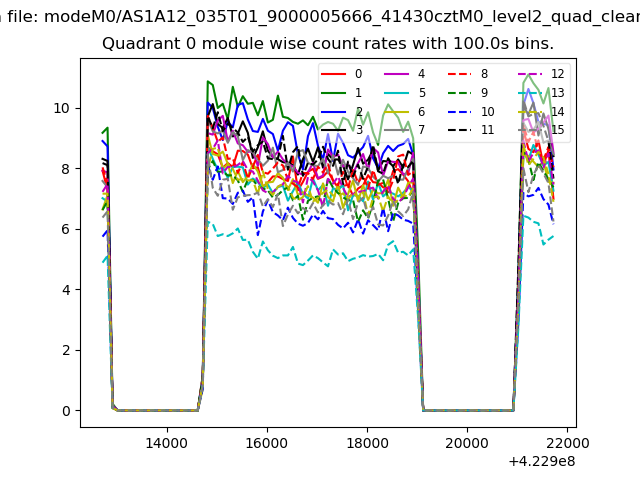
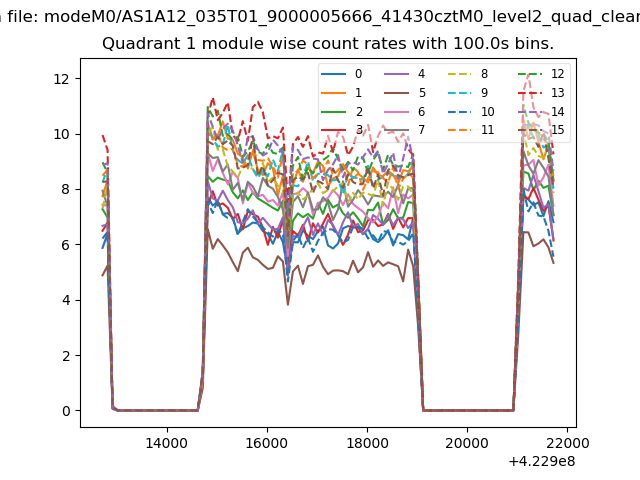
| Module-wise count rates for Quadrant A Data is divided into 100 sec bins |
 |
 |
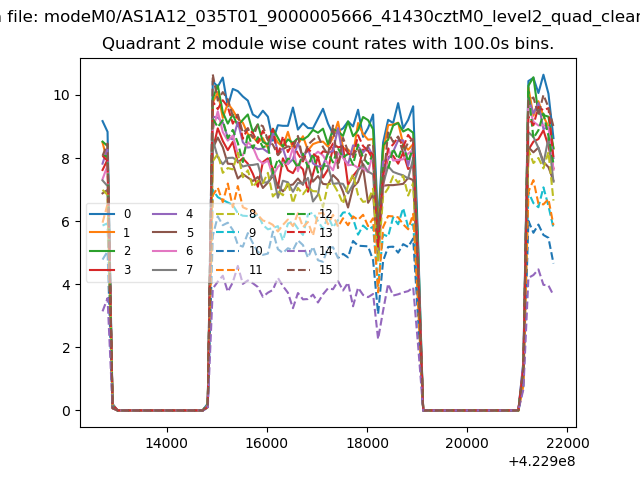
| Module-wise count rates for Quadrant B Data is divided into 100 sec bins |
 |
 |
| Module-wise count rates for Quadrant C Data is divided into 100 sec bins |
 |
 |
| Module-wise count rates for Quadrant D Data is divided into 100 sec bins |
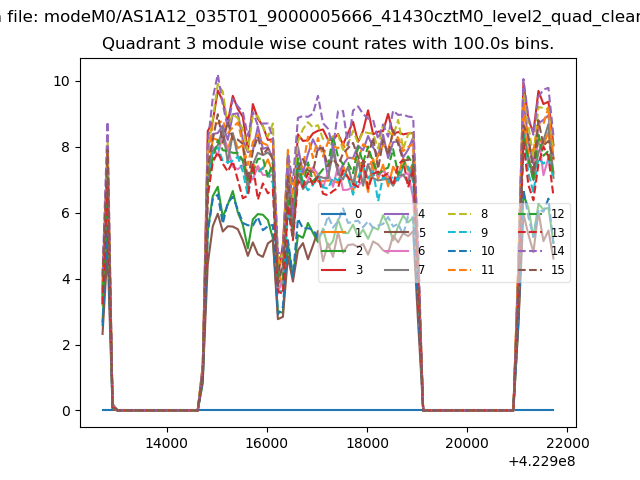 |
 |
| Parameter | Plot |
|---|---|
| CZT HV Monitor | 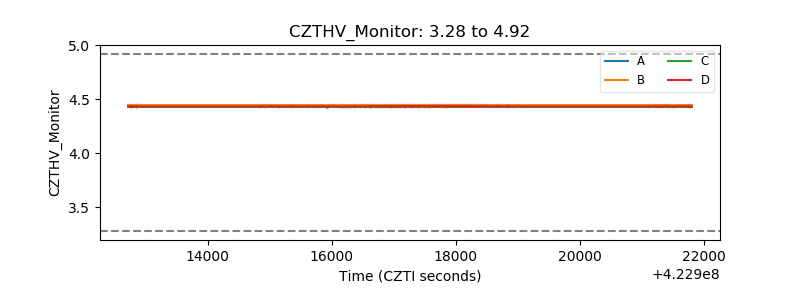 |
| D_VDD | 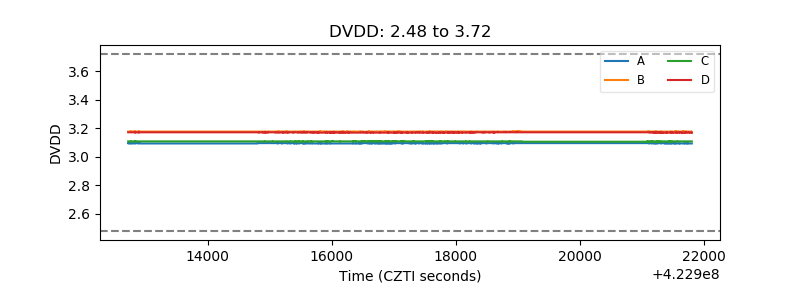 |
| Temperature 1 | 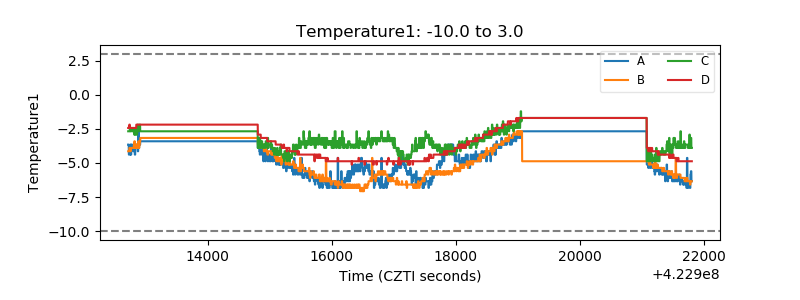 |
| Veto HV Monitor | 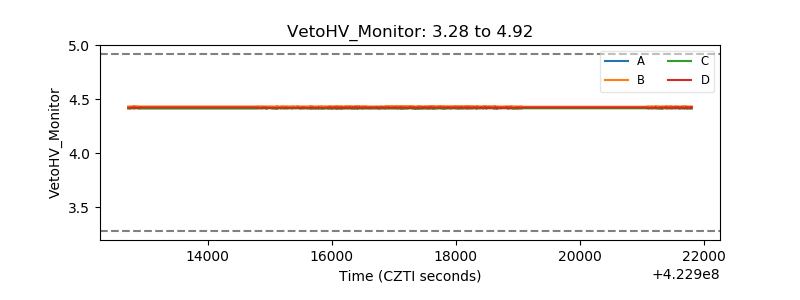 |
| Veto LLD | 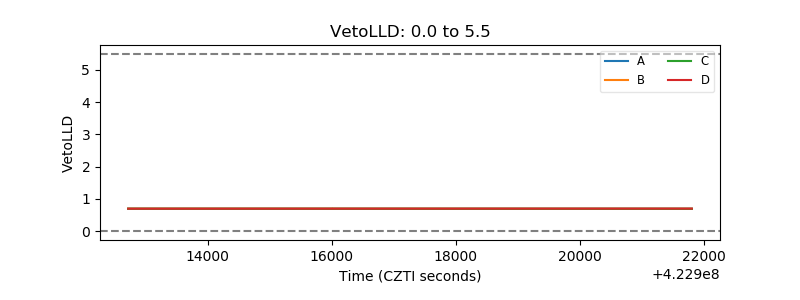 |
| Alpha Counter | 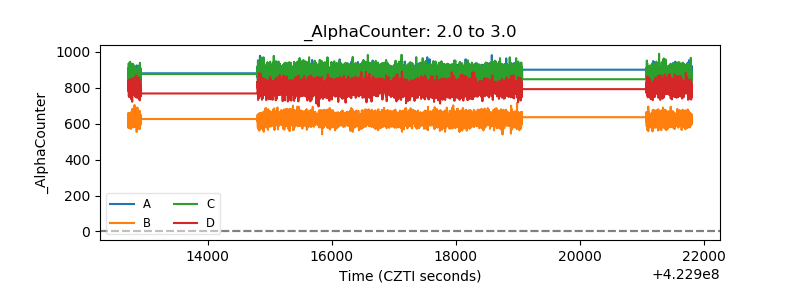 |
| _CPM_Rate |  |
| CZT Counter | 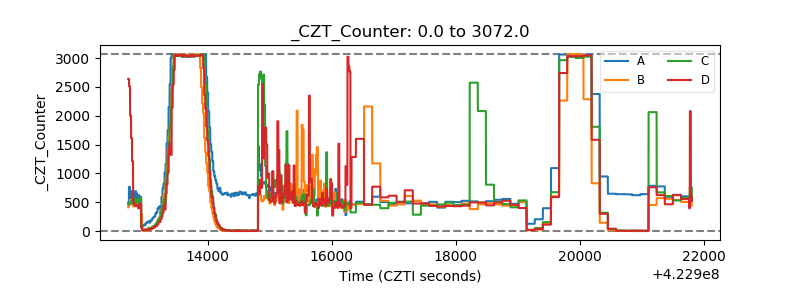 |
| +2.5 Volts monitor |  |
| +5 Volts monitor | 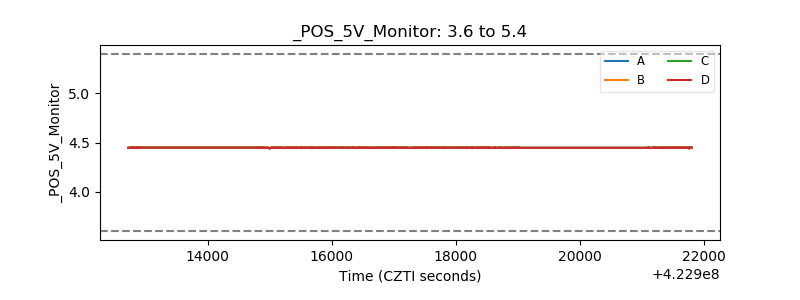 |
| _ROLL_ROT | 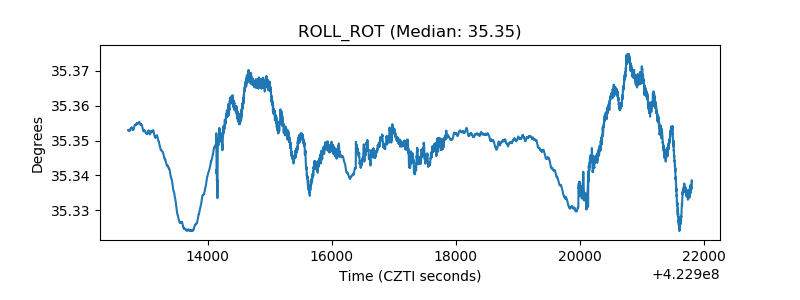 |
| _Roll_DEC |  |
| _Roll_RA | 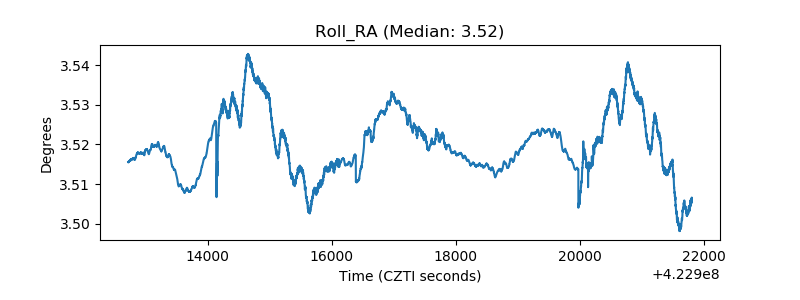 |
| Veto Counter | 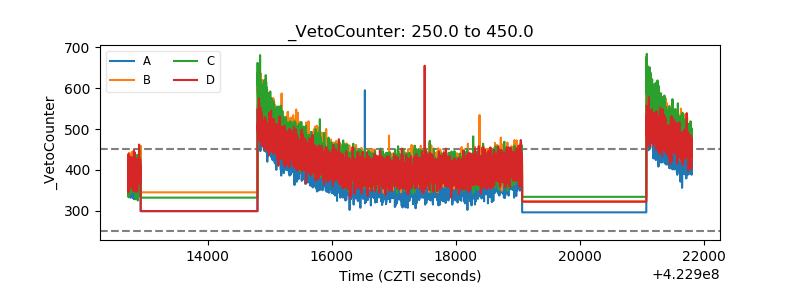 |