| Param | Original file | Final file |
|---|---|---|
| Filename | modeM0/AS1A12_035T01_9000005666_41431cztM0_level2.fits | modeM0/AS1A12_035T01_9000005666_41431cztM0_level2_quad_clean.evt |
| Size (bytes) | 286,822,080 | 83,733,120 |
| Size | 273.5 MB | 79.9 MB |
| Events in quadrant A | 2,531,998 | 571,646 |
| Events in quadrant B | 2,388,472 | 588,533 |
| Events in quadrant C | 2,727,325 | 542,435 |
| Events in quadrant D | 2,611,199 | 510,269 |
| Mode M0 | |||
|---|---|---|---|
| Quadrant | BADHDUFLAG | Total packets | Discarded packets |
| A | 0 | 10220 | 16 |
| B | 0 | 10052 | 13 |
| C | 0 | 10713 | 13 |
| D | 0 | 10811 | 23 |
| Mode SS | |||
|---|---|---|---|
| Quadrant | BADHDUFLAG | Total packets | Discarded packets |
| A | 0 | 94 | 0 |
| B | 0 | 94 | 0 |
| C | 0 | 94 | 0 |
| D | 0 | 94 | 0 |
| Mode M9 | |||
|---|---|---|---|
| Quadrant | BADHDUFLAG | Total packets | Discarded packets |
| A | 0 | 21 | 0 |
| B | 0 | 21 | 0 |
| C | 0 | 21 | 0 |
| D | 0 | 21 | 0 |
| Quadrant | Total seconds | Saturated seconds | Saturation percentage |
|---|---|---|---|
| A | 4593 | 11 | 0.239495% |
| B | 4592 | 25 | 0.544425% |
| C | 4593 | 159 | 3.461790% |
| D | 4595 | 95 | 2.067465% |
Noise dominated data is calculated using 1-second bins in cleaned event files. If a bin has >2000 counts, and if more than 50% of those come from <1% of pixels, then it is considered to be noise-dominated and hence unusable.
| Quadrant | # 1 sec bins | Bins with >0 counts | Bins with >2000 counts | High rate bins dominated by noise | Noise dominated (total time) | Noise dominated (detector-on time) | Marked lightcurve |
|---|---|---|---|---|---|---|---|
| A | 6691 | 4598 | 5 | 5 | 0.07% | 0.11% | 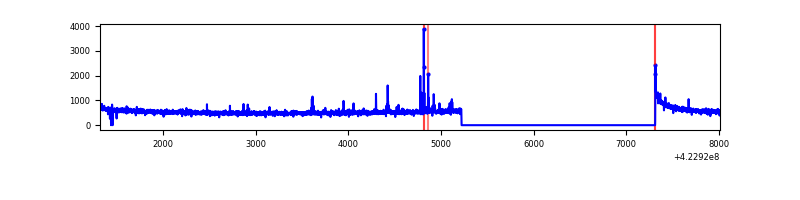 |
| B | 6691 | 4598 | 17 | 17 | 0.25% | 0.37% | 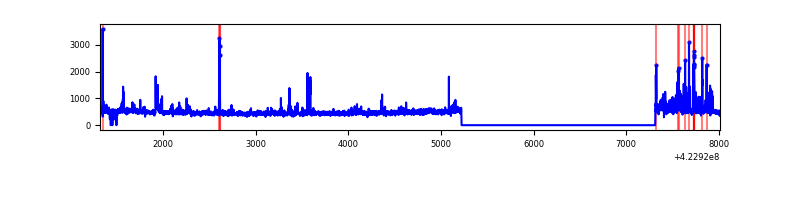 |
| C | 6691 | 4598 | 147 | 147 | 2.20% | 3.20% | 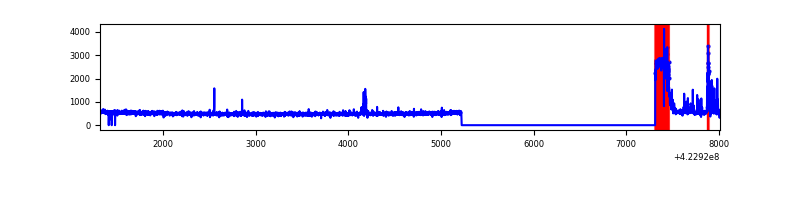 |
| D | 6691 | 4599 | 68 | 68 | 1.02% | 1.48% | 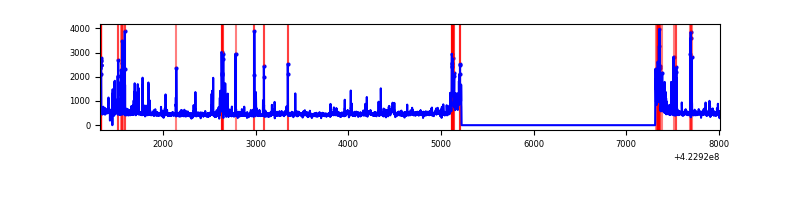 |
Top three noisy pixels from each quadrant. If the there are fewer than three noisy pixels in the level2.evt file, extra rows are filled as -1
| Pixel properties | Quadrant properties | ||||||
|---|---|---|---|---|---|---|---|
| Quadrant | DetID | PixID | Counts | Sigma | Mean | Median | Sigma |
| A | 10 | 83 | 383525 | 3460.66 | 540 | 531 | 110.7 |
| A | 13 | 248 | 39588 | 352.91 | 540 | 531 | 110.7 |
| A | 2 | 79 | 18829 | 165.34 | 540 | 531 | 110.7 |
| B | 5 | 255 | 204061 | 1973.72 | 537 | 523 | 103.1 |
| B | 0 | 190 | 41874 | 400.98 | 537 | 523 | 103.1 |
| B | 4 | 81 | 20061 | 189.46 | 537 | 523 | 103.1 |
| C | 0 | 10 | 358636 | 2935.62 | 525 | 531 | 122.0 |
| C | 15 | 214 | 187107 | 1529.49 | 525 | 531 | 122.0 |
| C | 15 | 111 | 132744 | 1083.84 | 525 | 531 | 122.0 |
| D | 13 | 171 | 302524 | 2344.5 | 531 | 518 | 128.8 |
| D | 13 | 249 | 100730 | 777.96 | 531 | 518 | 128.8 |
| D | 1 | 47 | 55922 | 430.11 | 531 | 518 | 128.8 |
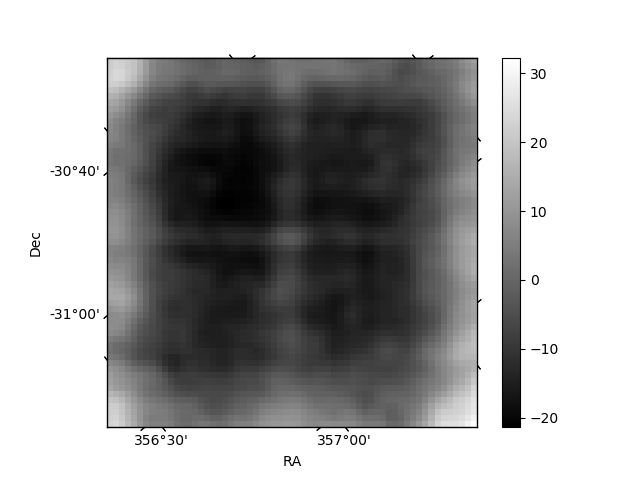
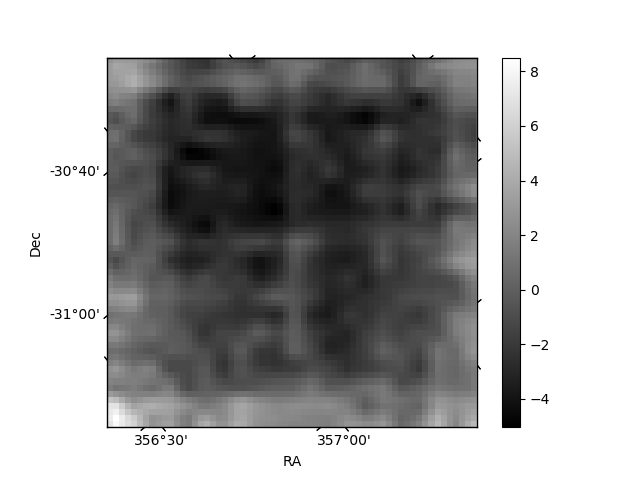
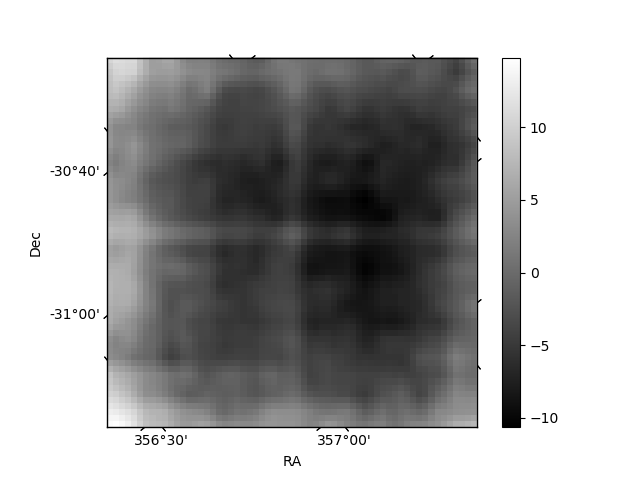
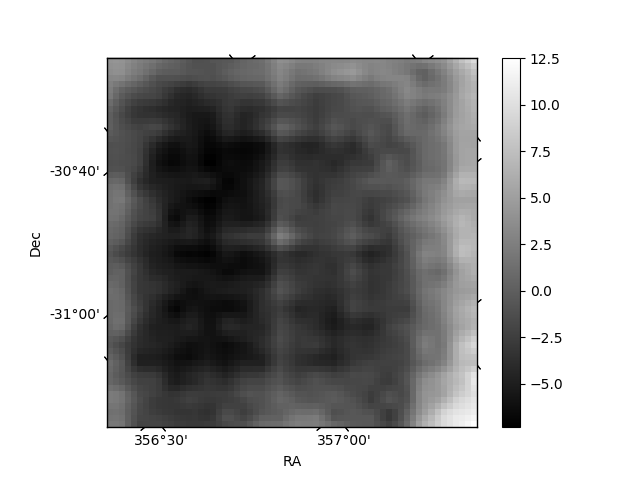
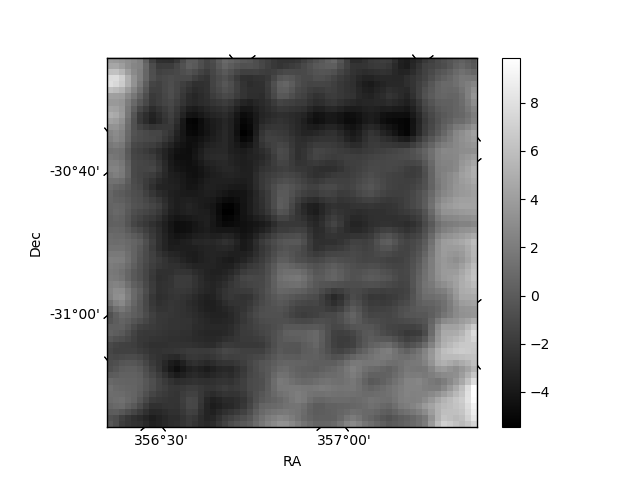
Histogram calculated using DETX and DETY for each event in the final _common_clean file
| Quadrant A | 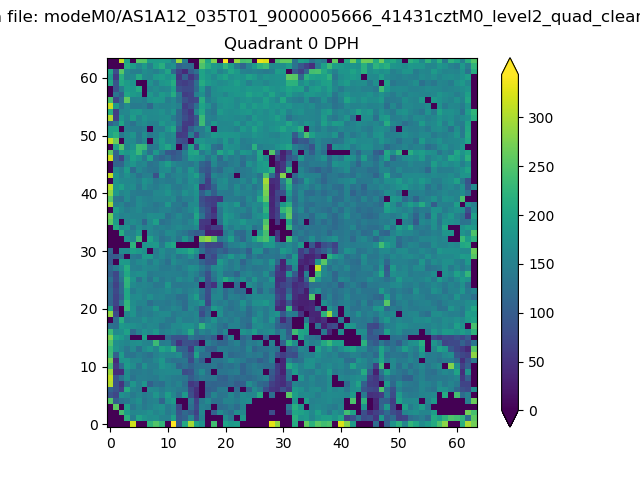 |
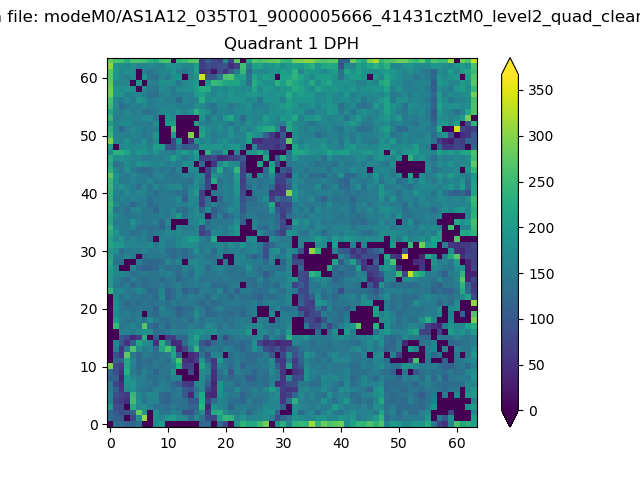 |
Quadrant B |
|---|---|---|---|
| Quadrant D | 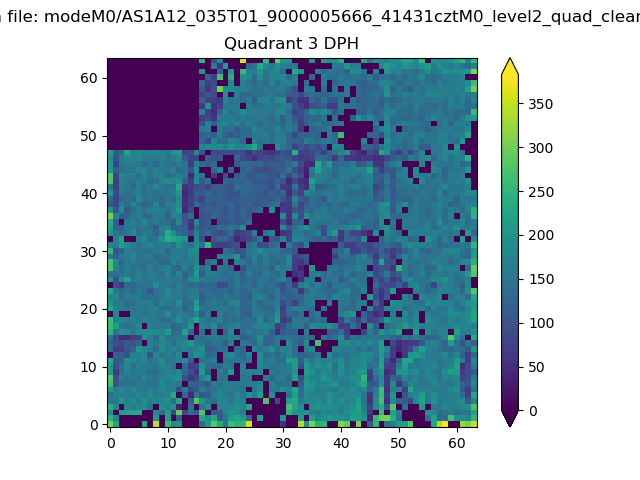 |
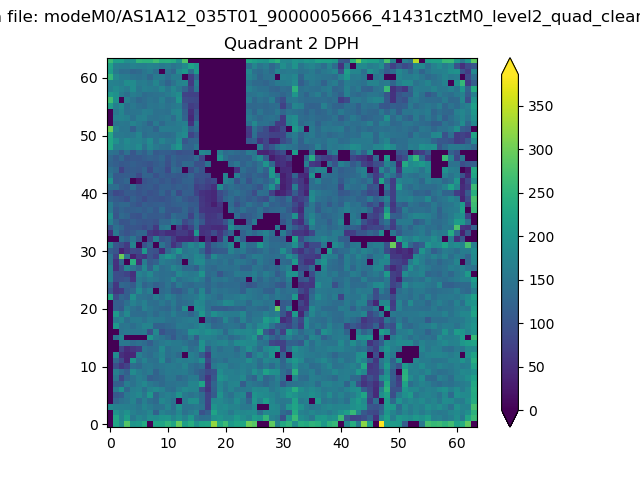 |
Quadrant C |
| Plot type | Count rate plots | Images |
|---|---|---|
| Comparison with Poisson distribution Blue bars denote a histogram of data divided into 1 sec bins. Red curve is a Poisson curve with rate = median count rate of data. |
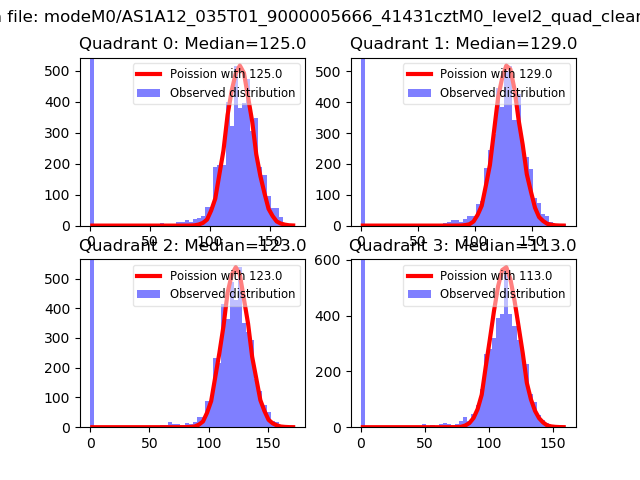 |
 |
| Quadrant-wise count rates Data is divided into 100 sec bins |
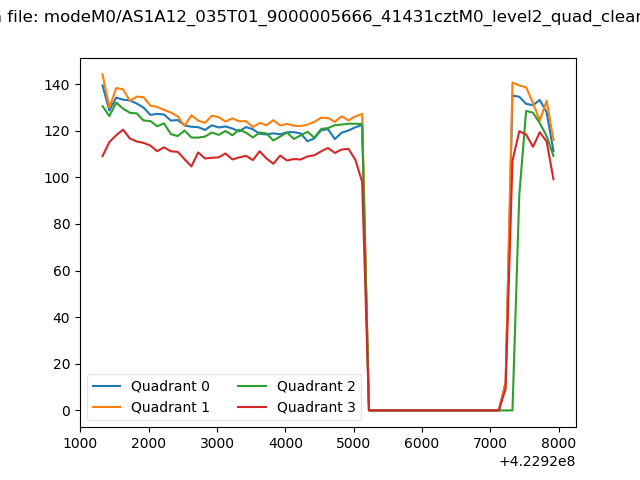 |
|
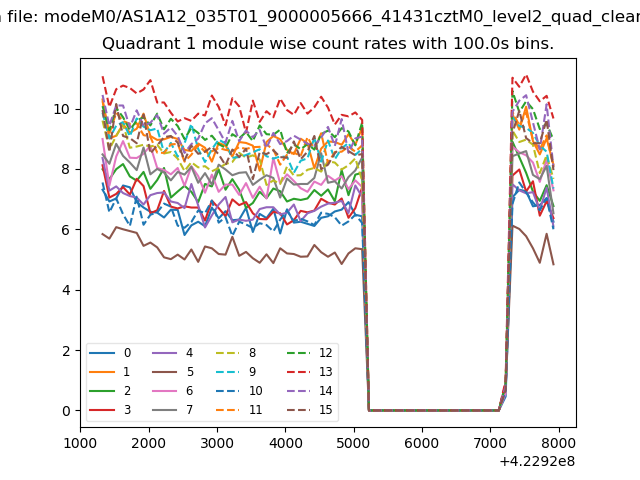
| Module-wise count rates for Quadrant A Data is divided into 100 sec bins |
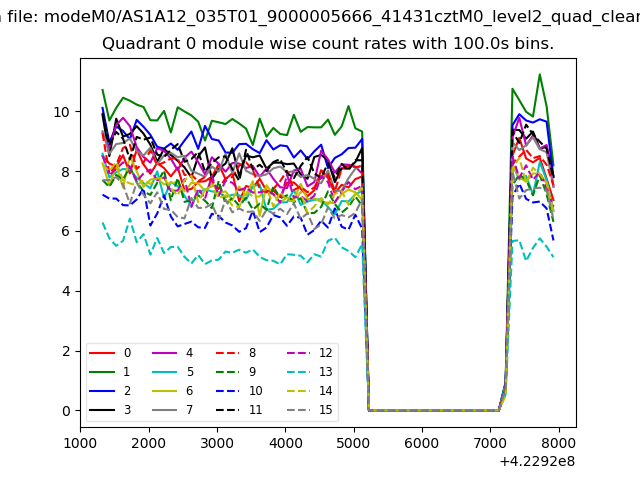 |
 |
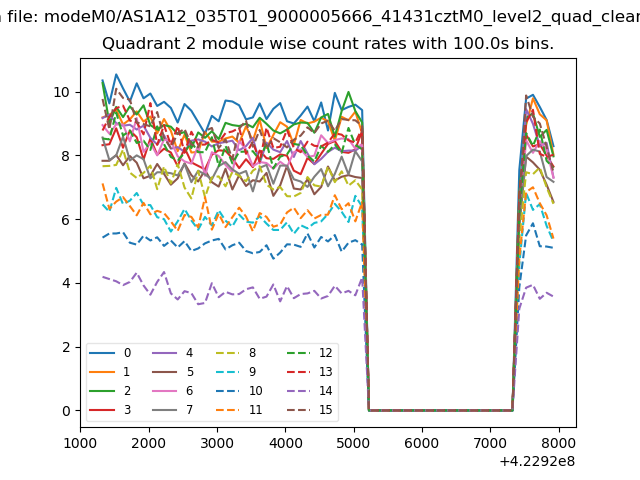
| Module-wise count rates for Quadrant B Data is divided into 100 sec bins |
 |
 |
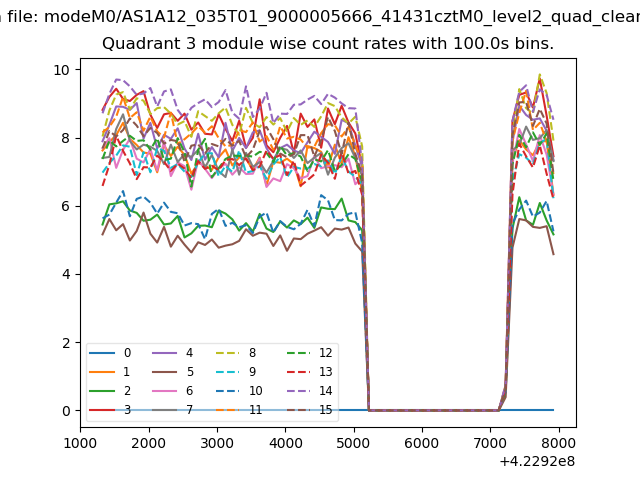
| Module-wise count rates for Quadrant C Data is divided into 100 sec bins |
 |
 |
| Module-wise count rates for Quadrant D Data is divided into 100 sec bins |
 |
 |
| Parameter | Plot |
|---|---|
| CZT HV Monitor | 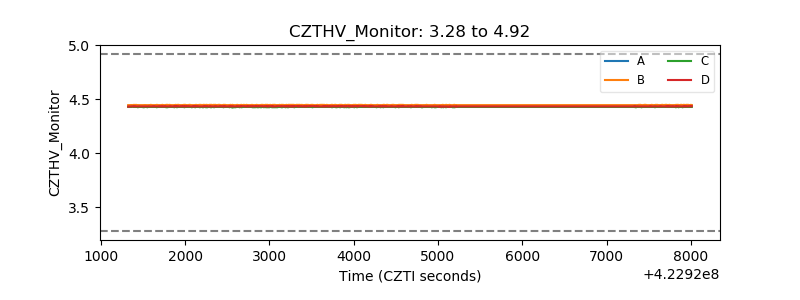 |
| D_VDD | 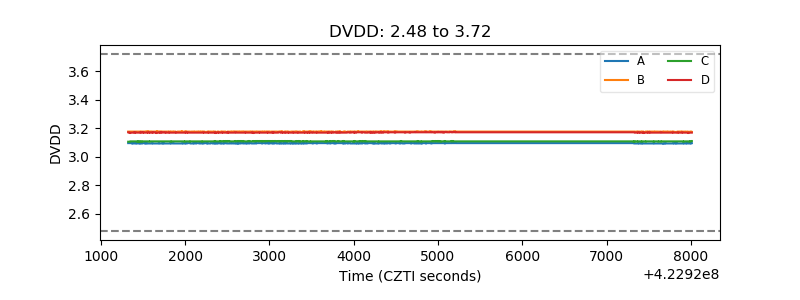 |
| Temperature 1 | 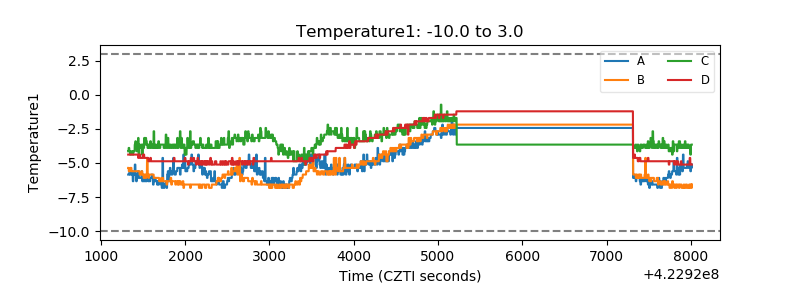 |
| Veto HV Monitor |  |
| Veto LLD | 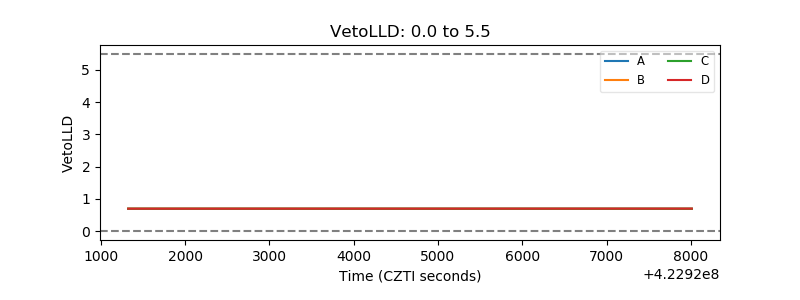 |
| Alpha Counter | 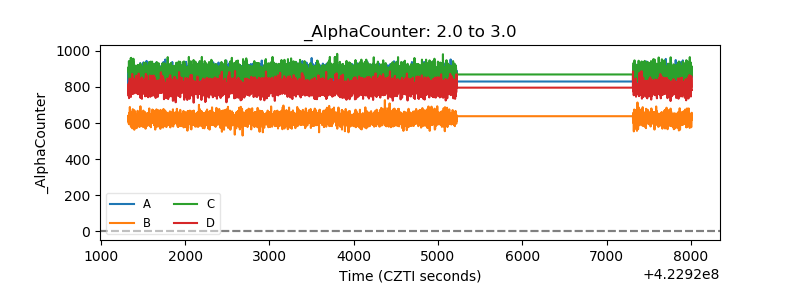 |
| _CPM_Rate | 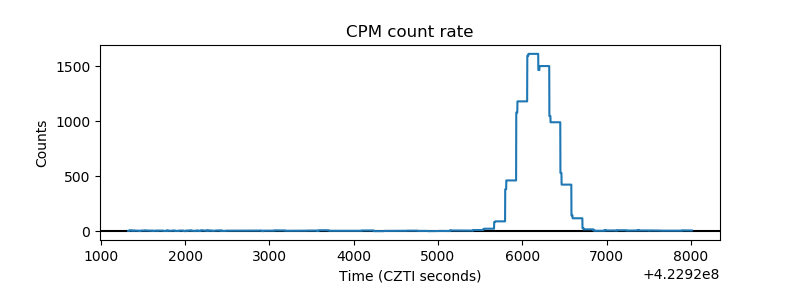 |
| CZT Counter | 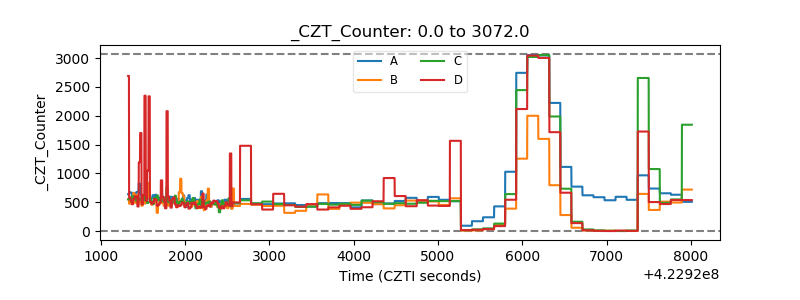 |
| +2.5 Volts monitor | 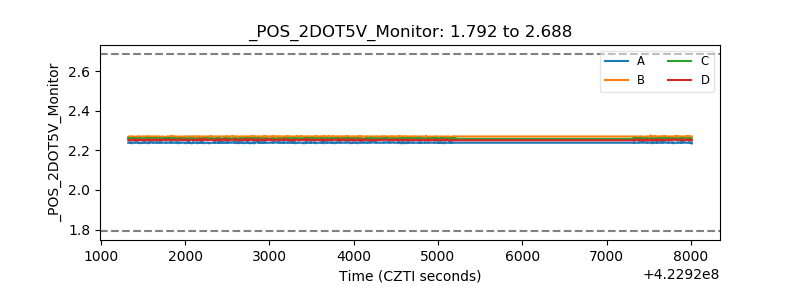 |
| +5 Volts monitor | 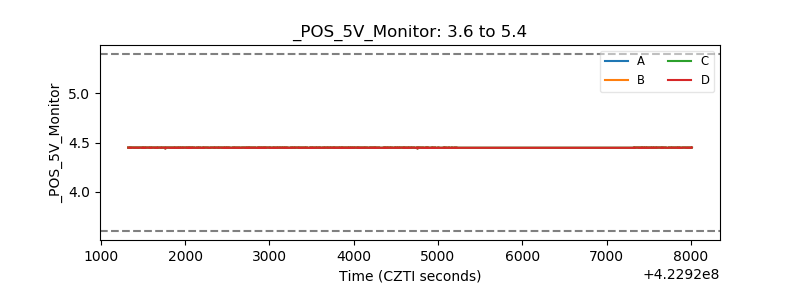 |
| _ROLL_ROT | 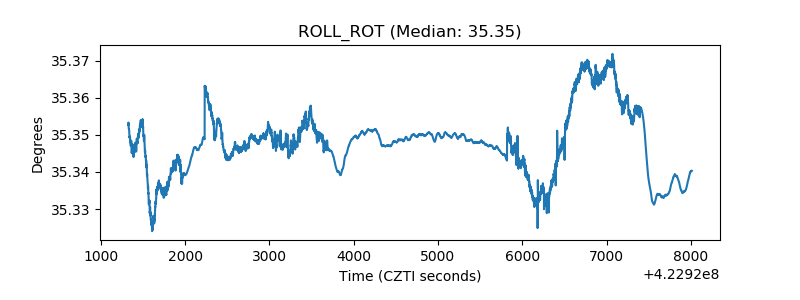 |
| _Roll_DEC | 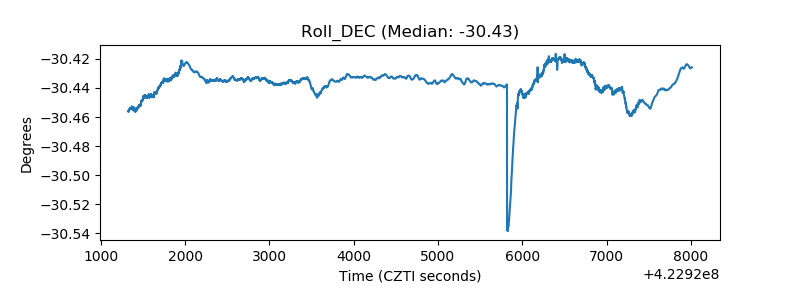 |
| _Roll_RA | 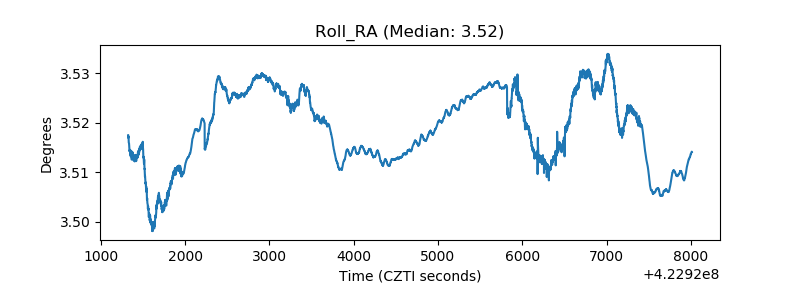 |
| Veto Counter | 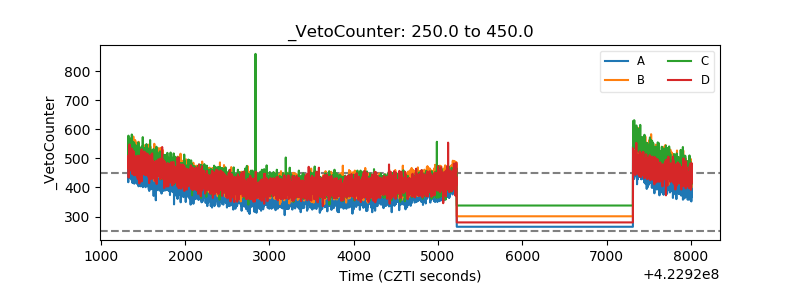 |