| Param | Original file | Final file |
|---|---|---|
| Filename | modeM0/AS1A12_035T01_9000005666_41432cztM0_level2.fits | modeM0/AS1A12_035T01_9000005666_41432cztM0_level2_quad_clean.evt |
| Size (bytes) | 340,269,120 | 95,198,400 |
| Size | 324.5 MB | 90.8 MB |
| Events in quadrant A | 2,999,953 | 648,544 |
| Events in quadrant B | 2,711,401 | 667,832 |
| Events in quadrant C | 3,382,493 | 608,997 |
| Events in quadrant D | 3,083,366 | 581,643 |
| Mode M0 | |||
|---|---|---|---|
| Quadrant | BADHDUFLAG | Total packets | Discarded packets |
| A | 0 | 12135 | 3 |
| B | 0 | 11574 | 2 |
| C | 0 | 13132 | 2 |
| D | 0 | 12748 | 2 |
| Mode SS | |||
|---|---|---|---|
| Quadrant | BADHDUFLAG | Total packets | Discarded packets |
| A | 0 | 110 | 0 |
| B | 0 | 110 | 0 |
| C | 0 | 110 | 0 |
| D | 0 | 110 | 0 |
| Mode M9 | |||
|---|---|---|---|
| Quadrant | BADHDUFLAG | Total packets | Discarded packets |
| A | 0 | 42 | 0 |
| B | 0 | 42 | 0 |
| C | 0 | 42 | 0 |
| D | 0 | 42 | 0 |
| Quadrant | Total seconds | Saturated seconds | Saturation percentage |
|---|---|---|---|
| A | 5373 | 13 | 0.241950% |
| B | 5373 | 32 | 0.595570% |
| C | 5373 | 290 | 5.397357% |
| D | 5373 | 124 | 2.307835% |
Noise dominated data is calculated using 1-second bins in cleaned event files. If a bin has >2000 counts, and if more than 50% of those come from <1% of pixels, then it is considered to be noise-dominated and hence unusable.
| Quadrant | # 1 sec bins | Bins with >0 counts | Bins with >2000 counts | High rate bins dominated by noise | Noise dominated (total time) | Noise dominated (detector-on time) | Marked lightcurve |
|---|---|---|---|---|---|---|---|
| A | 9587 | 5375 | 6 | 6 | 0.06% | 0.11% | 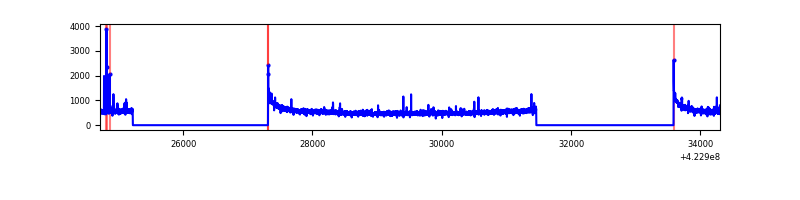 |
| B | 9587 | 5375 | 17 | 17 | 0.18% | 0.32% | 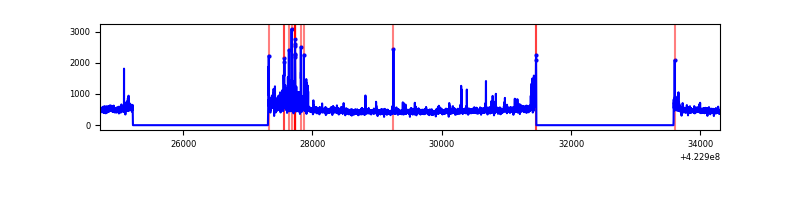 |
| C | 9587 | 5375 | 279 | 279 | 2.91% | 5.19% | 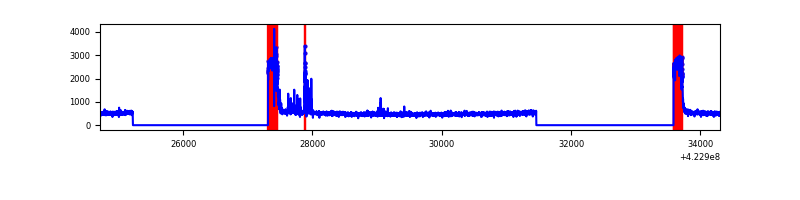 |
| D | 9587 | 5375 | 92 | 92 | 0.96% | 1.71% | 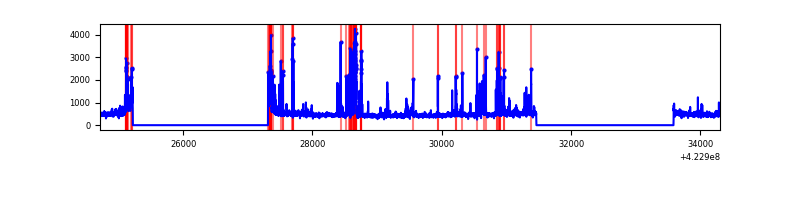 |
Top three noisy pixels from each quadrant. If the there are fewer than three noisy pixels in the level2.evt file, extra rows are filled as -1
| Pixel properties | Quadrant properties | ||||||
|---|---|---|---|---|---|---|---|
| Quadrant | DetID | PixID | Counts | Sigma | Mean | Median | Sigma |
| A | 10 | 83 | 510527 | 3985.44 | 624 | 611 | 127.9 |
| A | 13 | 248 | 38126 | 293.21 | 624 | 611 | 127.9 |
| A | 2 | 79 | 26487 | 202.24 | 624 | 611 | 127.9 |
| B | 5 | 255 | 155014 | 1279.98 | 622 | 606 | 120.6 |
| B | 0 | 190 | 44649 | 365.1 | 622 | 606 | 120.6 |
| B | 0 | 186 | 37667 | 307.22 | 622 | 606 | 120.6 |
| C | 0 | 10 | 721701 | 5196.05 | 598 | 602 | 138.8 |
| C | 15 | 214 | 215495 | 1548.46 | 598 | 602 | 138.8 |
| C | 15 | 111 | 115546 | 828.26 | 598 | 602 | 138.8 |
| D | 1 | 47 | 248365 | 1639.14 | 617 | 601 | 151.2 |
| D | 13 | 171 | 240043 | 1584.08 | 617 | 601 | 151.2 |
| D | 10 | 199 | 105635 | 694.88 | 617 | 601 | 151.2 |
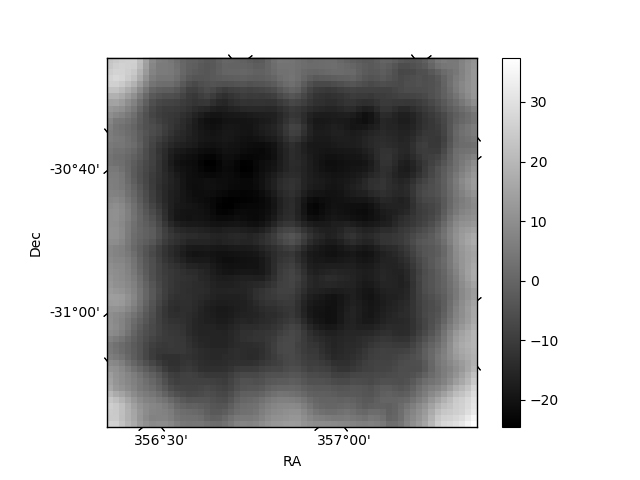
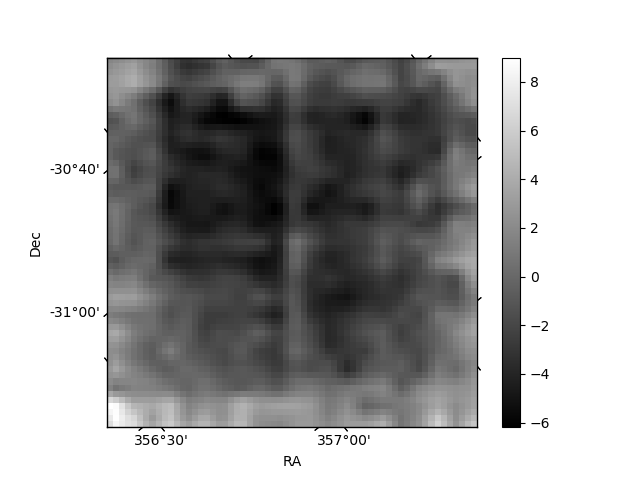
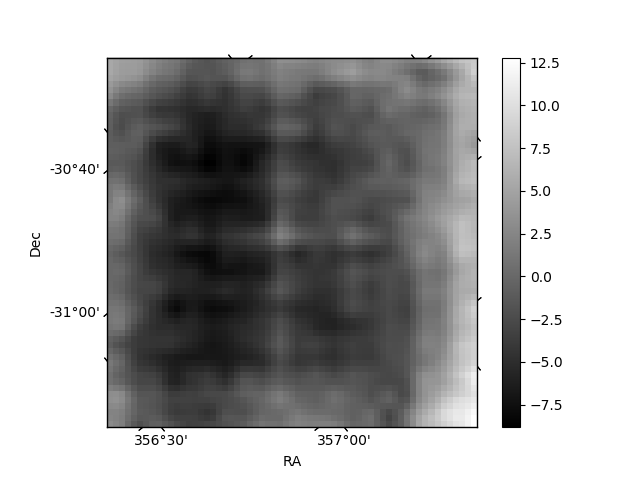
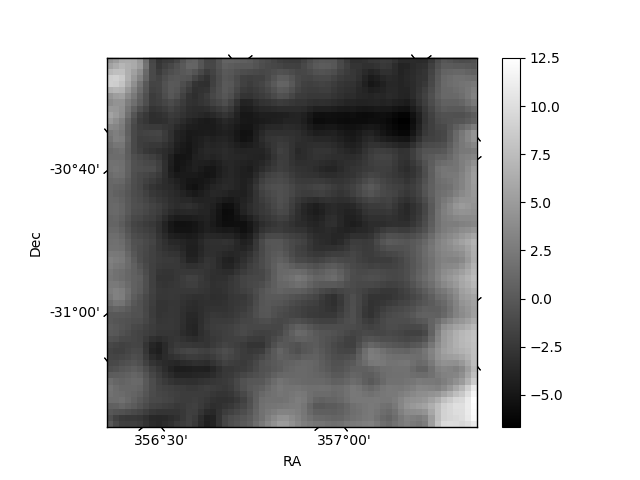
Histogram calculated using DETX and DETY for each event in the final _common_clean file
| Quadrant A | 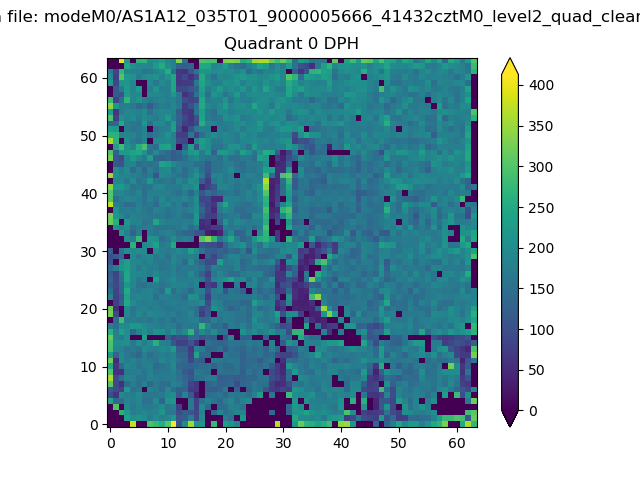 |
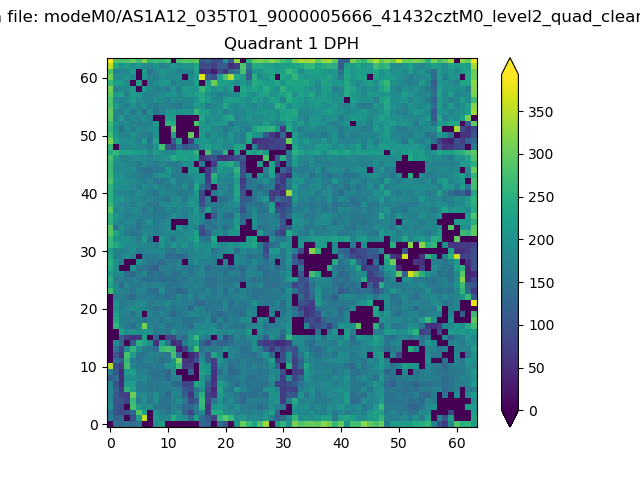 |
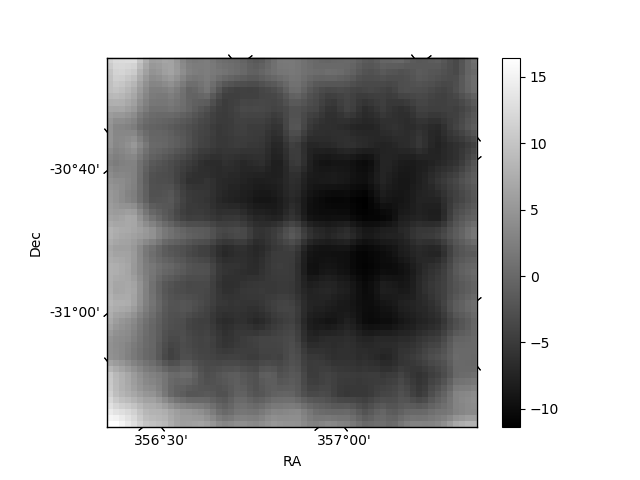
Quadrant B |
|---|---|---|---|
| Quadrant D | 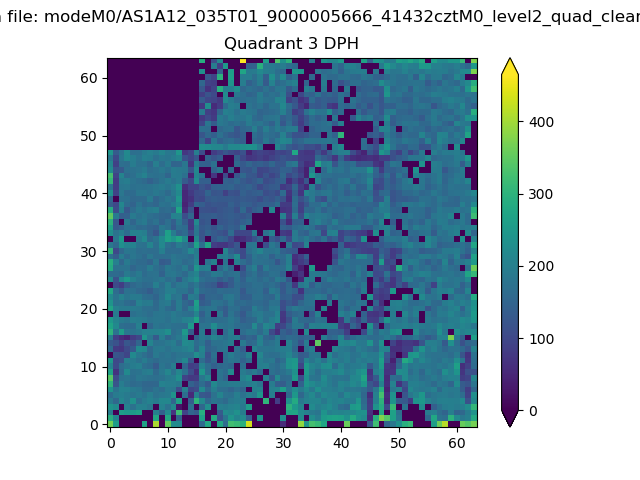 |
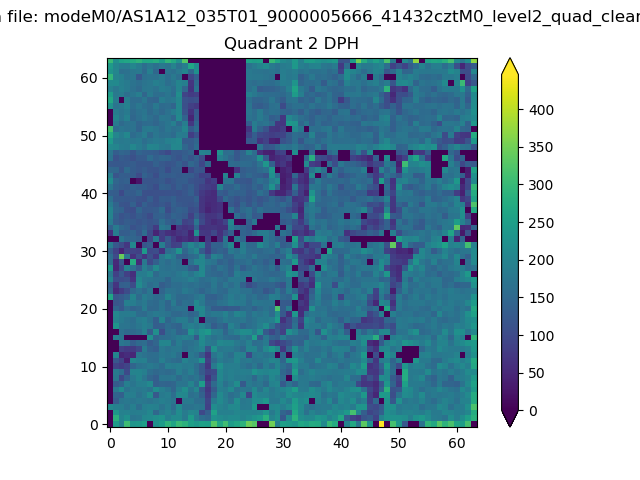 |
Quadrant C |
| Plot type | Count rate plots | Images |
|---|---|---|
| Comparison with Poisson distribution Blue bars denote a histogram of data divided into 1 sec bins. Red curve is a Poisson curve with rate = median count rate of data. |
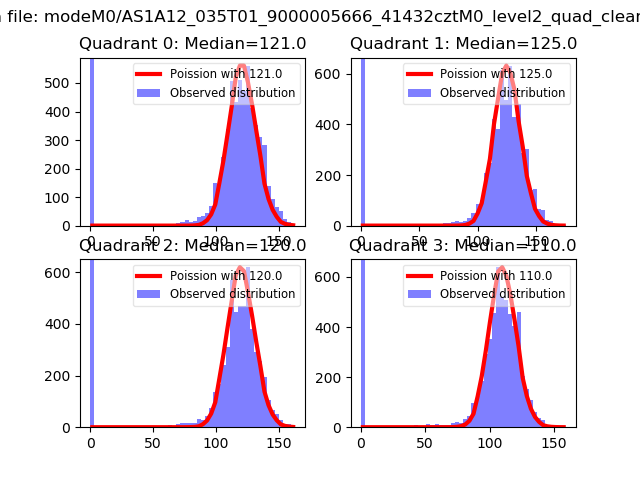 |
 |
| Quadrant-wise count rates Data is divided into 100 sec bins |
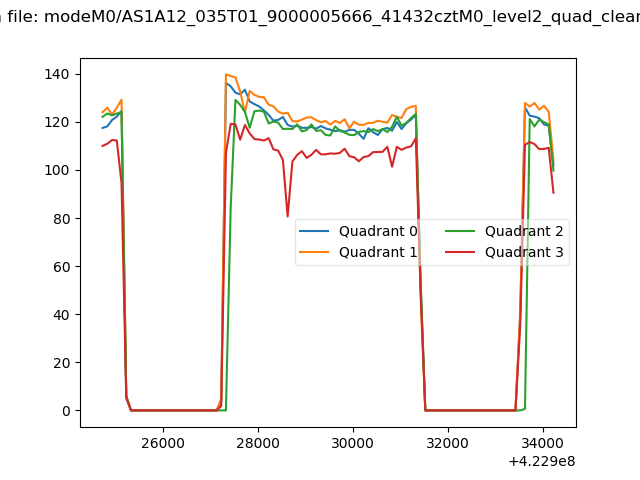 |
|
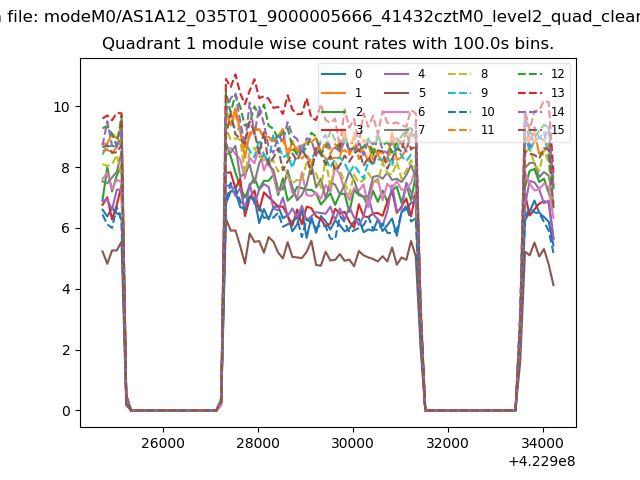
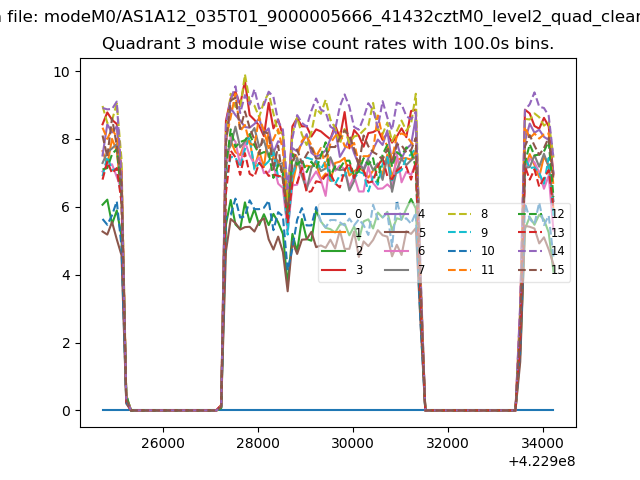
| Module-wise count rates for Quadrant A Data is divided into 100 sec bins |
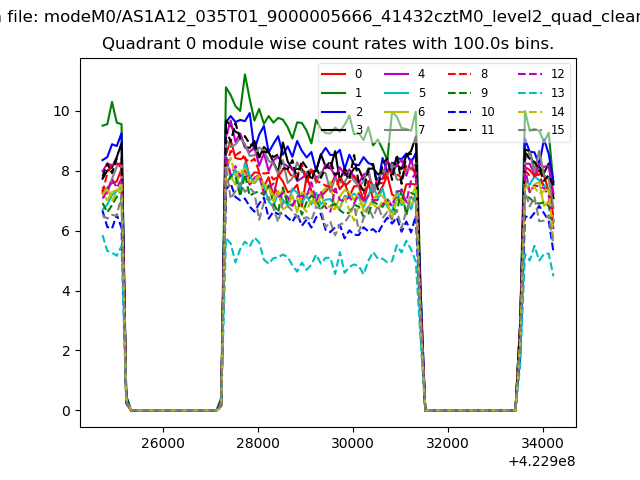 |
 |
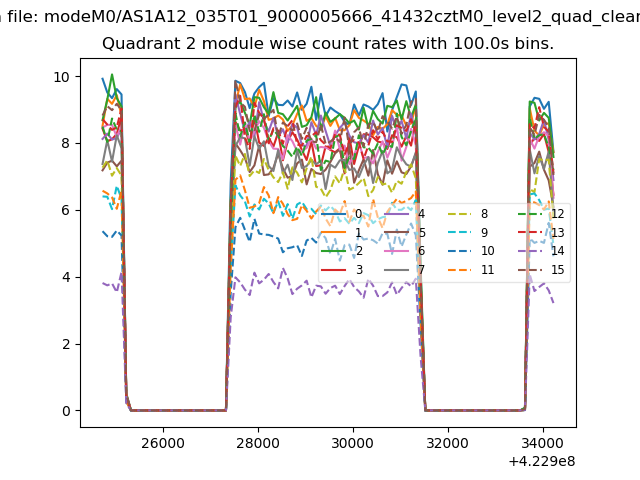
| Module-wise count rates for Quadrant B Data is divided into 100 sec bins |
 |
 |
| Module-wise count rates for Quadrant C Data is divided into 100 sec bins |
 |
 |
| Module-wise count rates for Quadrant D Data is divided into 100 sec bins |
 |
 |
| Parameter | Plot |
|---|---|
| CZT HV Monitor | 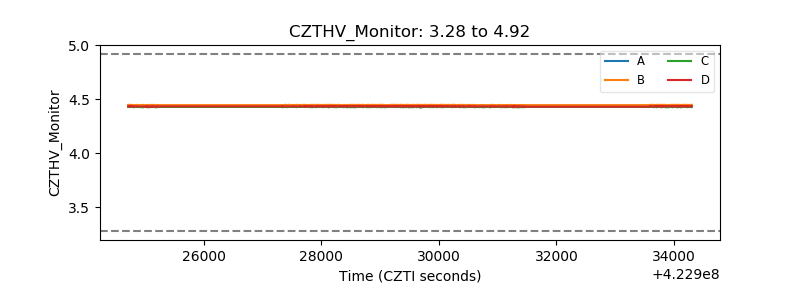 |
| D_VDD | 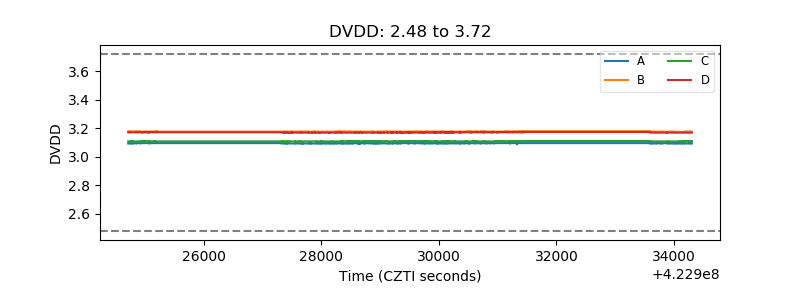 |
| Temperature 1 | 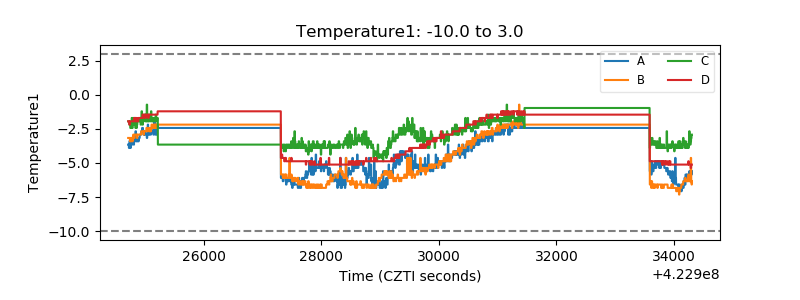 |
| Veto HV Monitor | 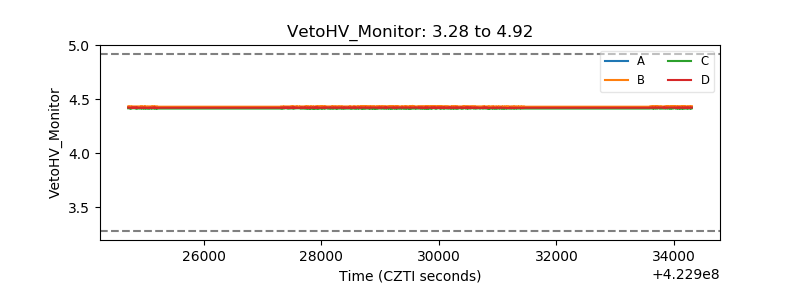 |
| Veto LLD | 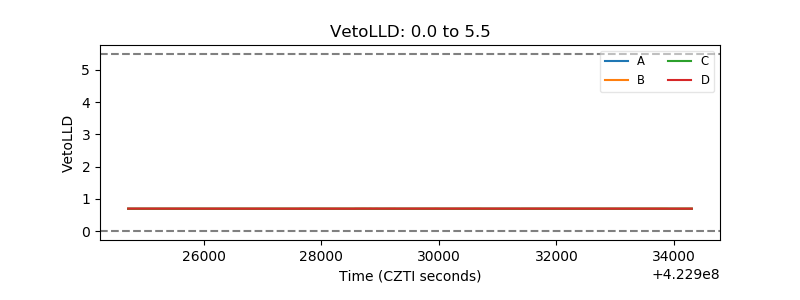 |
| Alpha Counter | 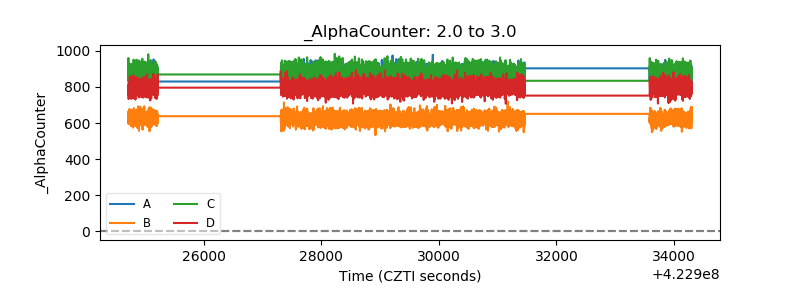 |
| _CPM_Rate | 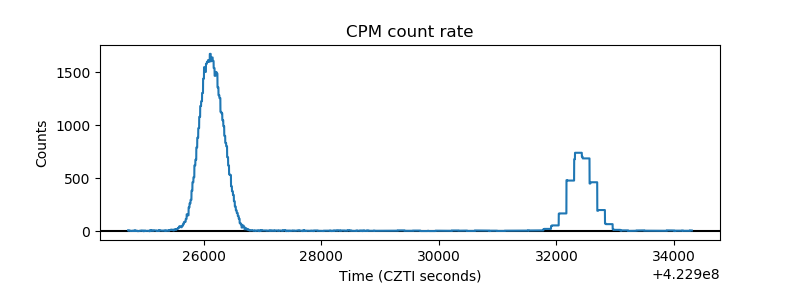 |
| CZT Counter | 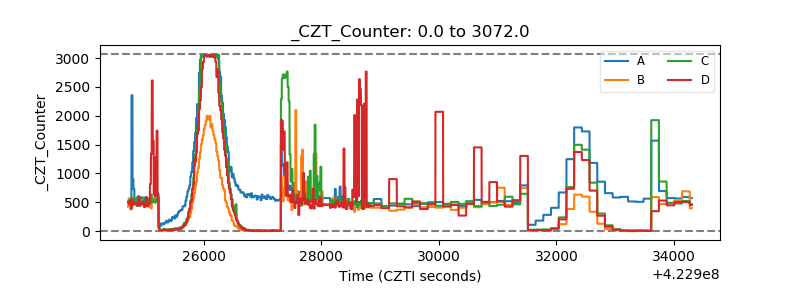 |
| +2.5 Volts monitor | 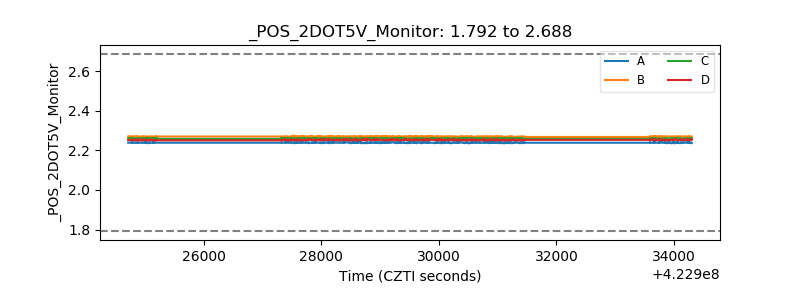 |
| +5 Volts monitor | 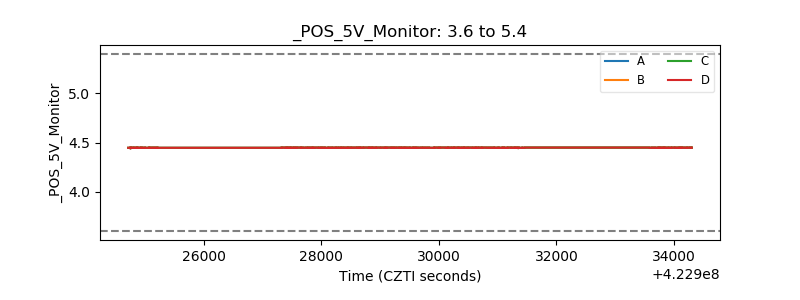 |
| _ROLL_ROT | 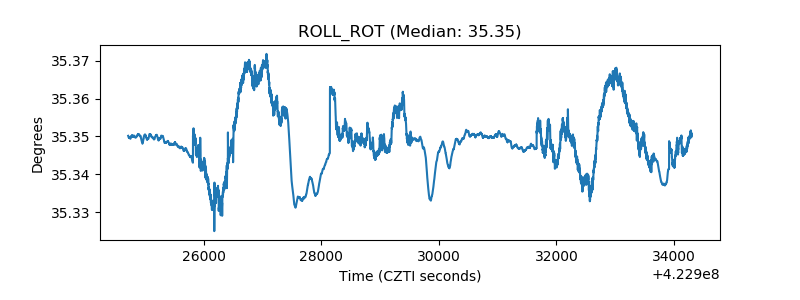 |
| _Roll_DEC | 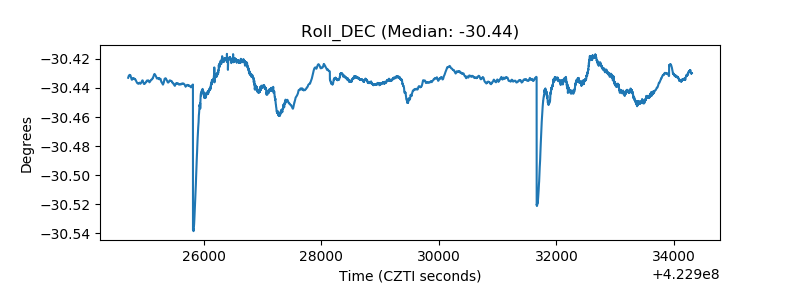 |
| _Roll_RA | 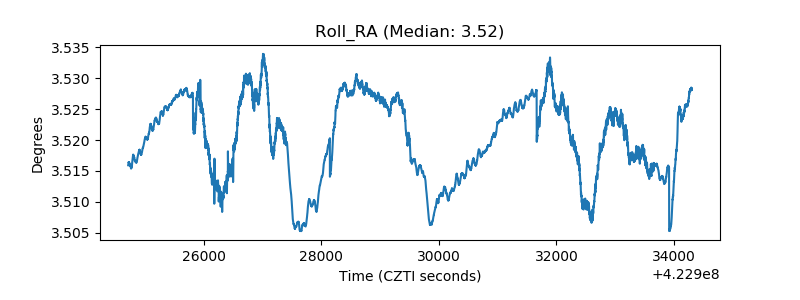 |
| Veto Counter | 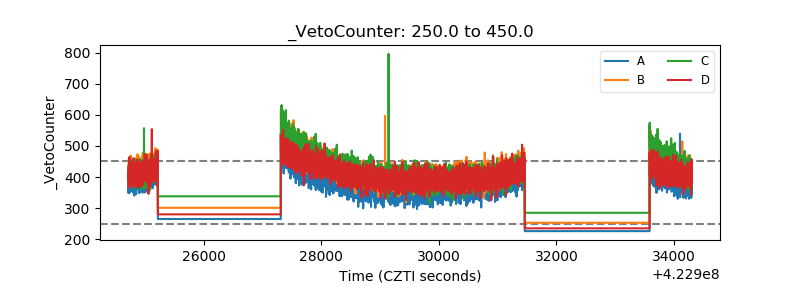 |