| Param | Original file | Final file |
|---|---|---|
| Filename | modeM0/AS1A12_035T01_9000005666_41433cztM0_level2.fits | modeM0/AS1A12_035T01_9000005666_41433cztM0_level2_quad_clean.evt |
| Size (bytes) | 301,253,760 | 85,026,240 |
| Size | 287.3 MB | 81.1 MB |
| Events in quadrant A | 2,770,977 | 571,995 |
| Events in quadrant B | 2,383,967 | 590,027 |
| Events in quadrant C | 2,978,972 | 540,723 |
| Events in quadrant D | 2,627,501 | 521,249 |
| Mode M0 | |||
|---|---|---|---|
| Quadrant | BADHDUFLAG | Total packets | Discarded packets |
| A | 0 | 11262 | 3 |
| B | 0 | 10549 | 2 |
| C | 0 | 11873 | 2 |
| D | 0 | 11283 | 2 |
| Mode SS | |||
|---|---|---|---|
| Quadrant | BADHDUFLAG | Total packets | Discarded packets |
| A | 0 | 102 | 0 |
| B | 0 | 102 | 0 |
| C | 0 | 102 | 0 |
| D | 0 | 102 | 0 |
| Mode M9 | |||
|---|---|---|---|
| Quadrant | BADHDUFLAG | Total packets | Discarded packets |
| A | 0 | 41 | 0 |
| B | 0 | 41 | 0 |
| C | 0 | 41 | 0 |
| D | 0 | 41 | 0 |
| Quadrant | Total seconds | Saturated seconds | Saturation percentage |
|---|---|---|---|
| A | 5002 | 13 | 0.259896% |
| B | 5002 | 15 | 0.299880% |
| C | 5002 | 256 | 5.117953% |
| D | 5002 | 42 | 0.839664% |
Noise dominated data is calculated using 1-second bins in cleaned event files. If a bin has >2000 counts, and if more than 50% of those come from <1% of pixels, then it is considered to be noise-dominated and hence unusable.
| Quadrant | # 1 sec bins | Bins with >0 counts | Bins with >2000 counts | High rate bins dominated by noise | Noise dominated (total time) | Noise dominated (detector-on time) | Marked lightcurve |
|---|---|---|---|---|---|---|---|
| A | 7094 | 5003 | 7 | 7 | 0.10% | 0.14% | 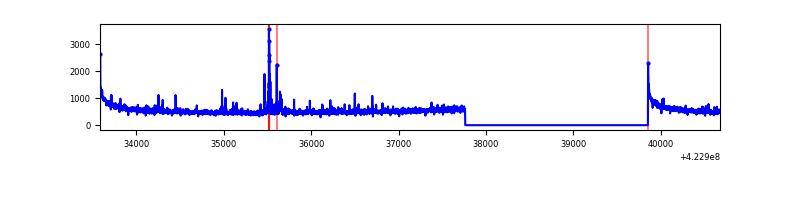 |
| B | 7094 | 5003 | 3 | 3 | 0.04% | 0.06% | 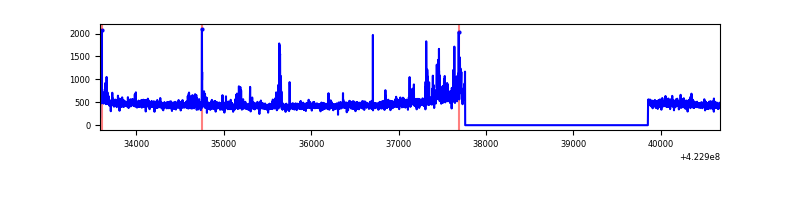 |
| C | 7094 | 5003 | 242 | 242 | 3.41% | 4.84% | 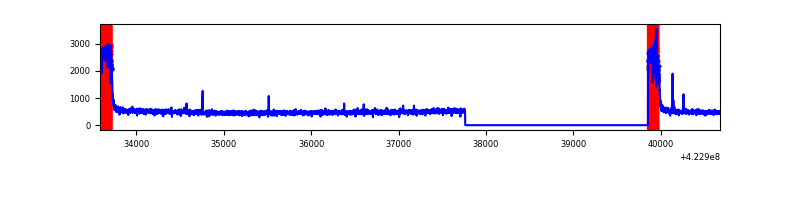 |
| D | 7094 | 5003 | 31 | 31 | 0.44% | 0.62% | 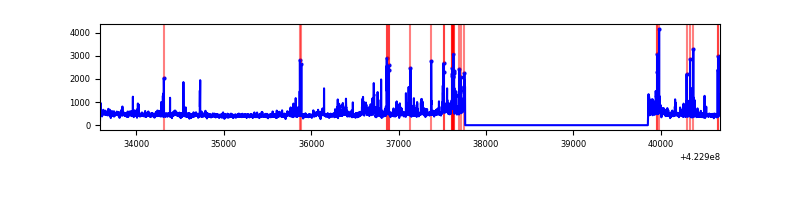 |
Top three noisy pixels from each quadrant. If the there are fewer than three noisy pixels in the level2.evt file, extra rows are filled as -1
| Pixel properties | Quadrant properties | ||||||
|---|---|---|---|---|---|---|---|
| Quadrant | DetID | PixID | Counts | Sigma | Mean | Median | Sigma |
| A | 10 | 83 | 493162 | 4289.25 | 558 | 546 | 114.8 |
| A | 13 | 248 | 73491 | 635.14 | 558 | 546 | 114.8 |
| A | 2 | 79 | 40310 | 346.23 | 558 | 546 | 114.8 |
| B | 0 | 186 | 87825 | 817.28 | 556 | 541 | 106.8 |
| B | 0 | 190 | 68916 | 640.23 | 556 | 541 | 106.8 |
| B | 5 | 255 | 29516 | 271.31 | 556 | 541 | 106.8 |
| C | 0 | 10 | 674937 | 5412.36 | 536 | 540 | 124.6 |
| C | 15 | 214 | 203653 | 1630.08 | 536 | 540 | 124.6 |
| C | 15 | 111 | 7742 | 57.8 | 536 | 540 | 124.6 |
| D | 13 | 171 | 213574 | 1567.39 | 554 | 541 | 135.9 |
| D | 12 | 79 | 96335 | 704.8 | 554 | 541 | 135.9 |
| D | 13 | 249 | 83262 | 608.62 | 554 | 541 | 135.9 |
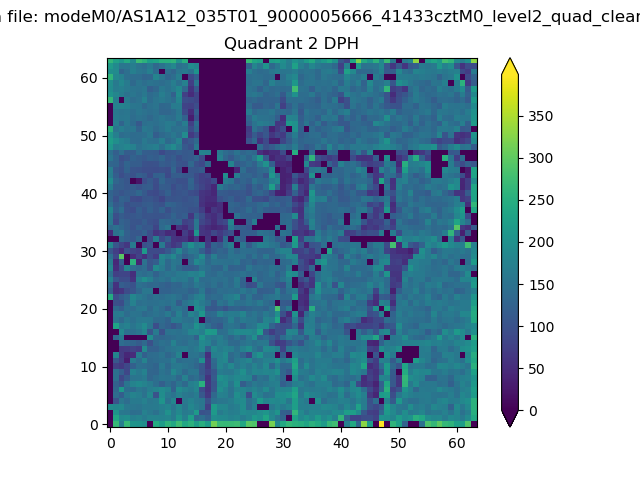
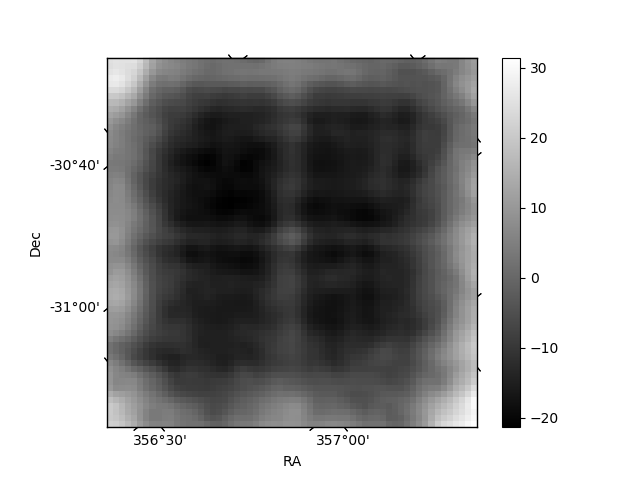
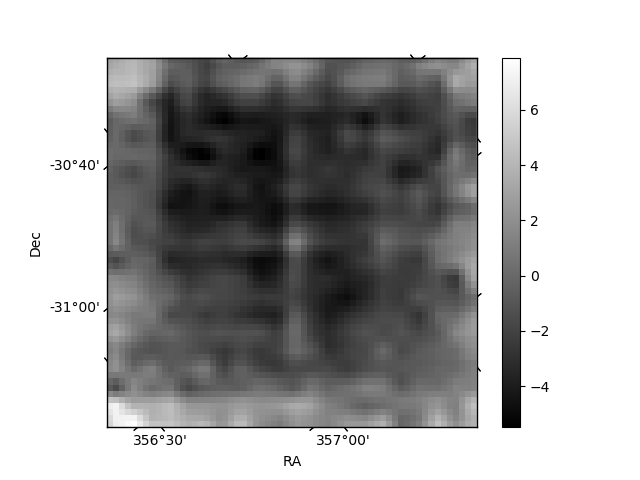
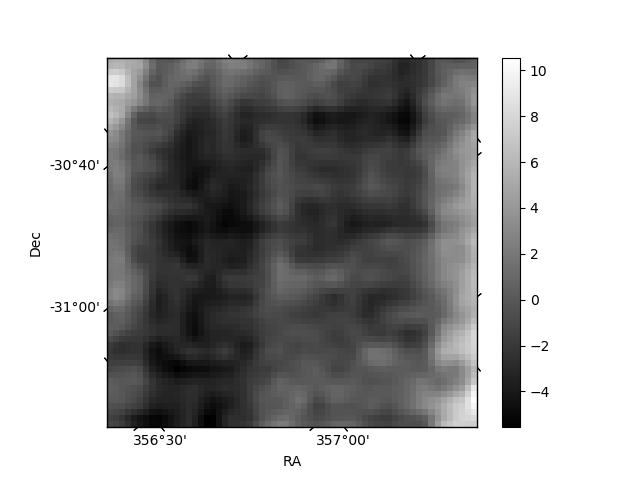
Histogram calculated using DETX and DETY for each event in the final _common_clean file
| Quadrant A | 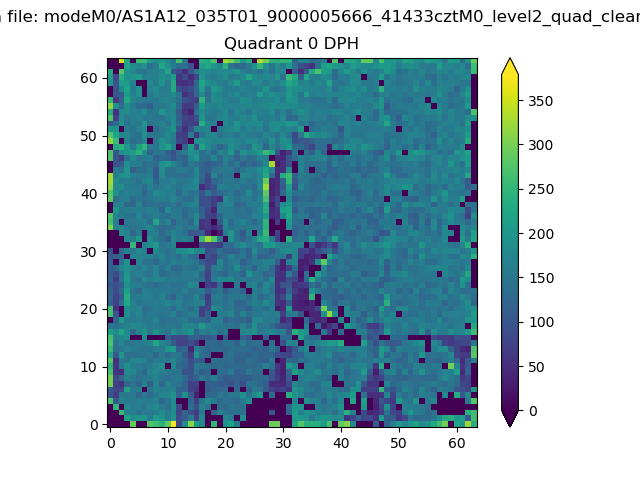 |
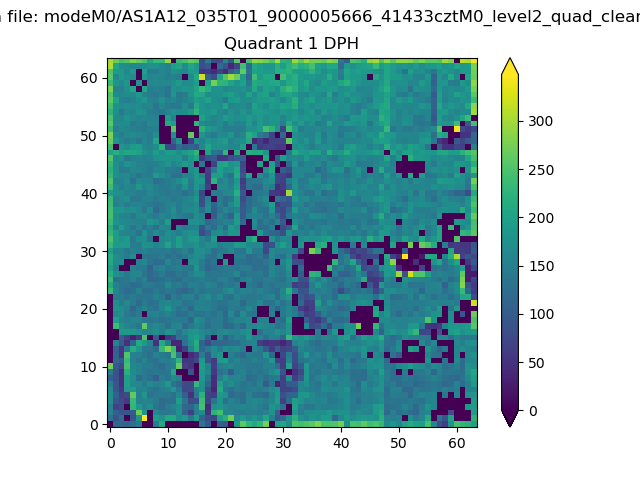 |
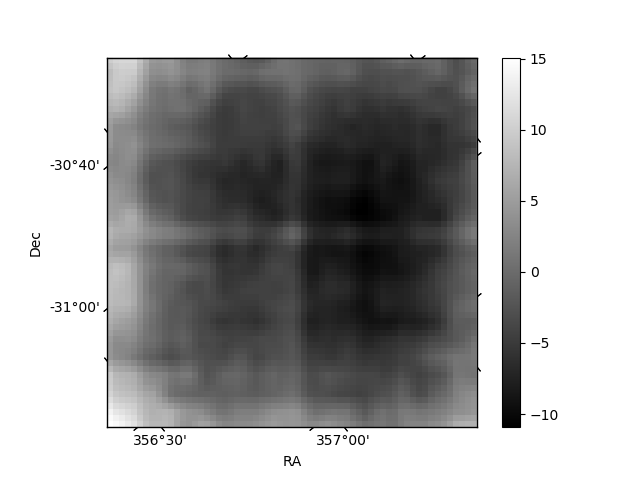
Quadrant B |
|---|---|---|---|
| Quadrant D | 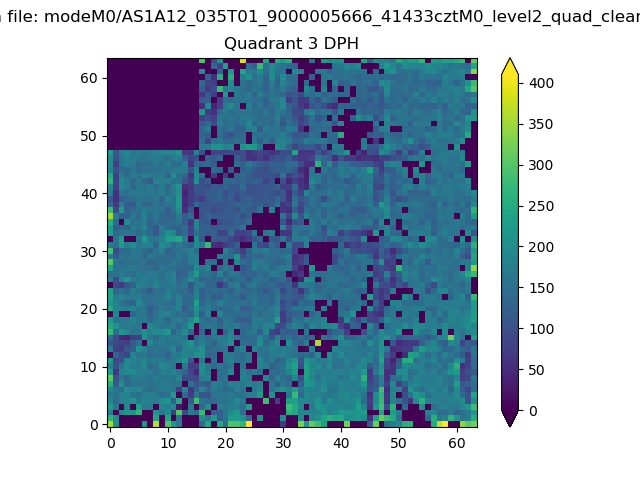 |
 |
Quadrant C |
| Plot type | Count rate plots | Images |
|---|---|---|
| Comparison with Poisson distribution Blue bars denote a histogram of data divided into 1 sec bins. Red curve is a Poisson curve with rate = median count rate of data. |
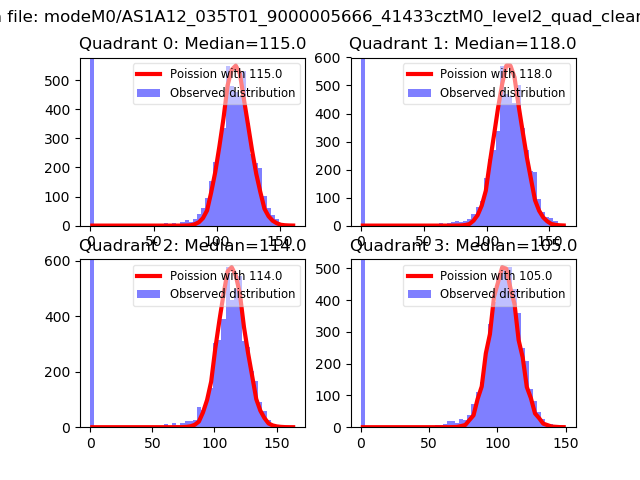 |
 |
| Quadrant-wise count rates Data is divided into 100 sec bins |
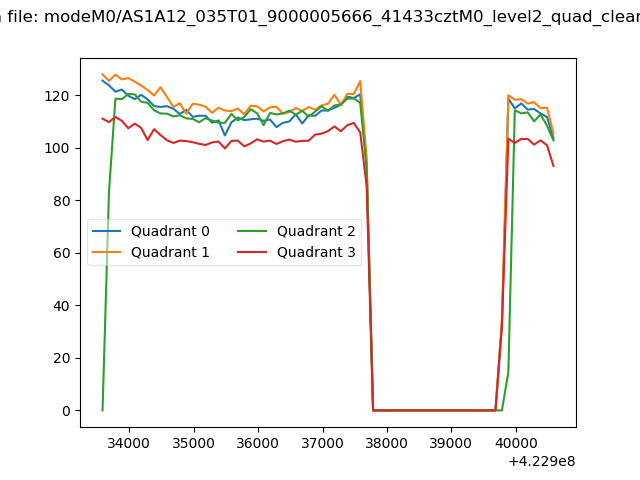 |
|
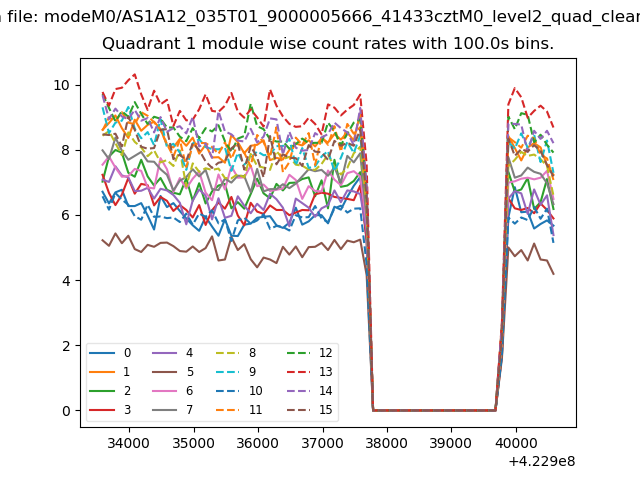
| Module-wise count rates for Quadrant A Data is divided into 100 sec bins |
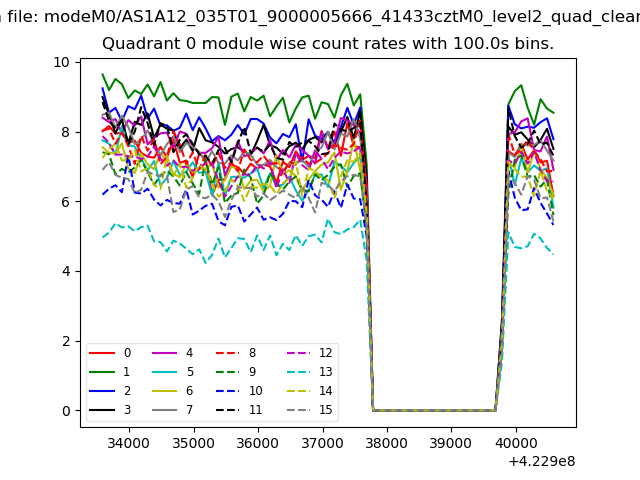 |
 |
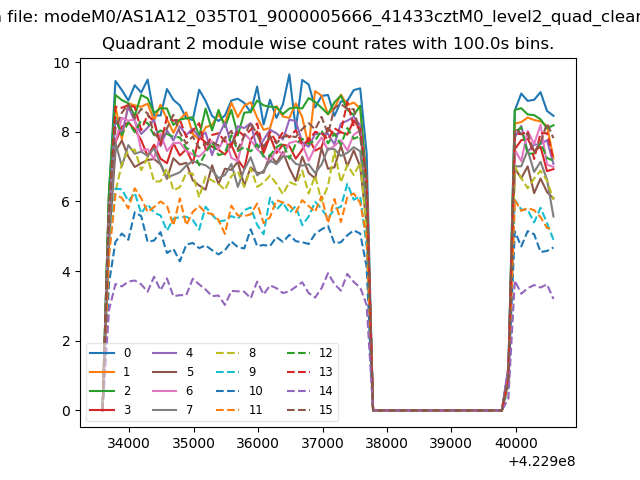
| Module-wise count rates for Quadrant B Data is divided into 100 sec bins |
 |
 |
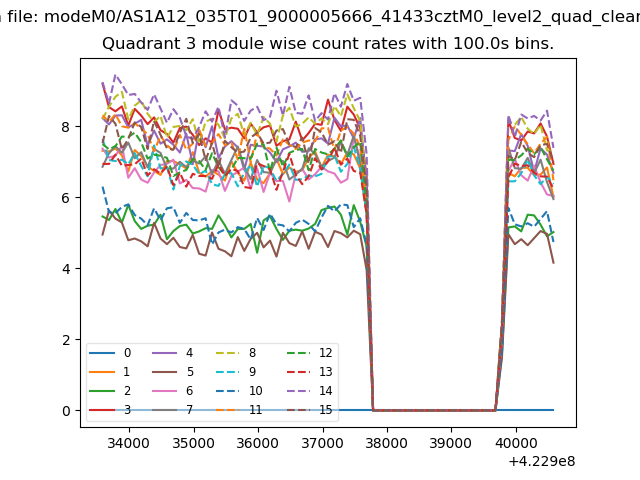
| Module-wise count rates for Quadrant C Data is divided into 100 sec bins |
 |
 |
| Module-wise count rates for Quadrant D Data is divided into 100 sec bins |
 |
 |
| Parameter | Plot |
|---|---|
| CZT HV Monitor | 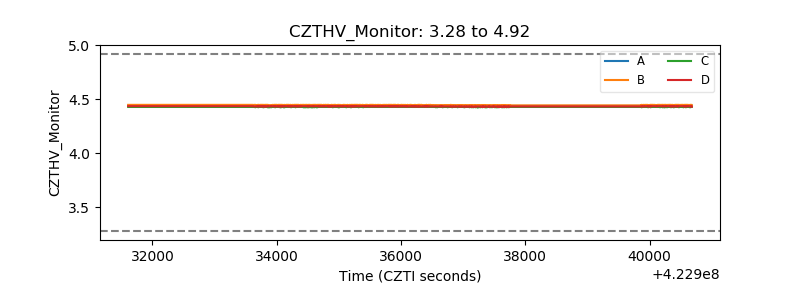 |
| D_VDD | 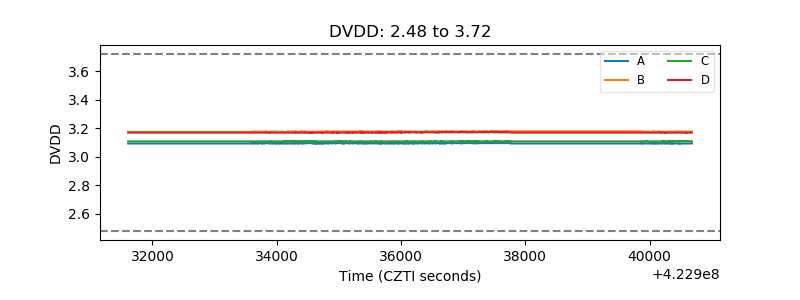 |
| Temperature 1 | 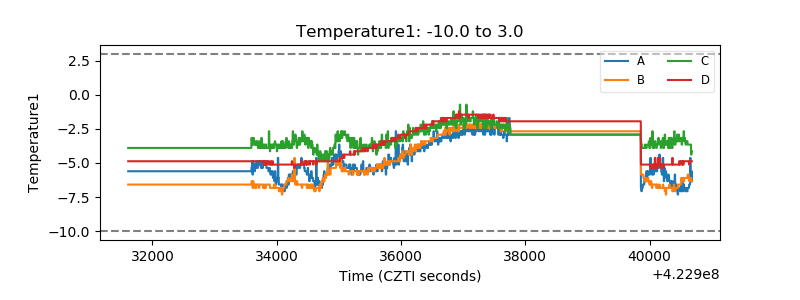 |
| Veto HV Monitor |  |
| Veto LLD | 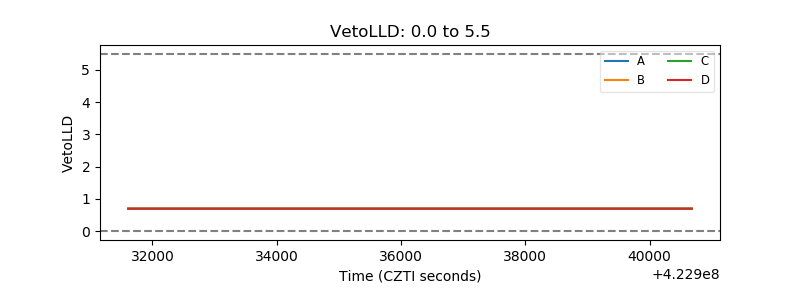 |
| Alpha Counter | 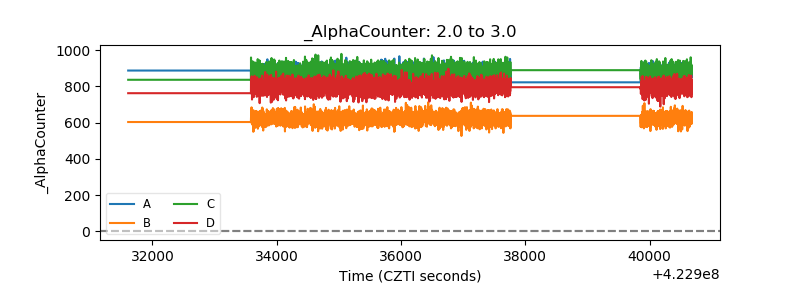 |
| _CPM_Rate | 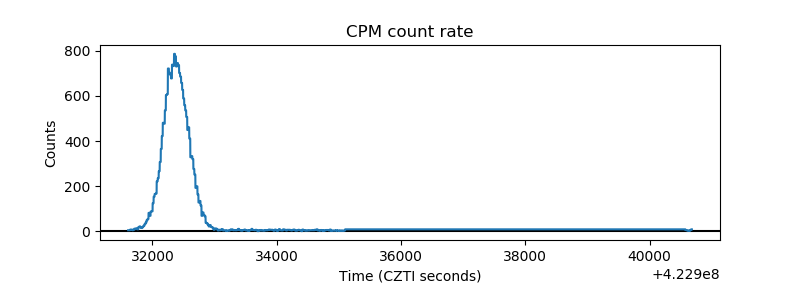 |
| CZT Counter | 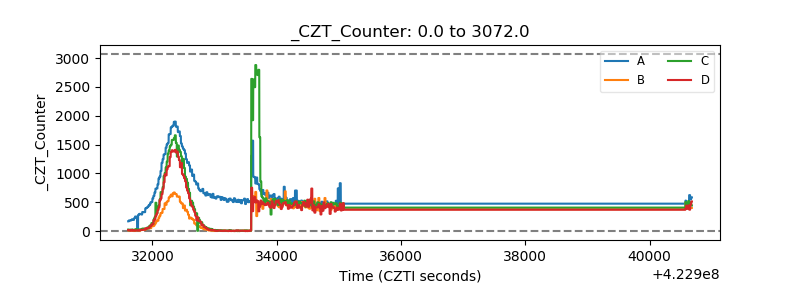 |
| +2.5 Volts monitor | 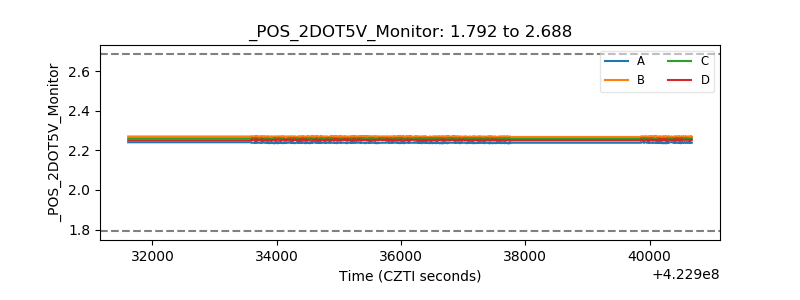 |
| +5 Volts monitor | 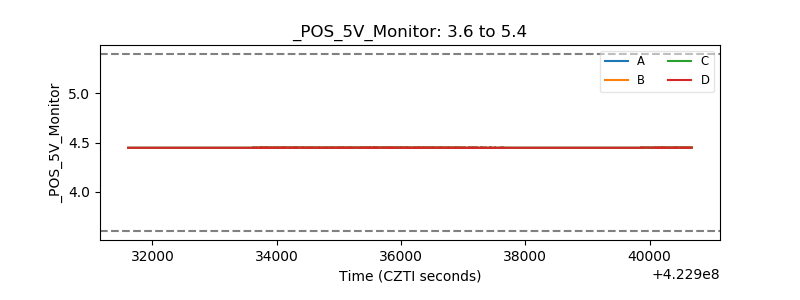 |
| _ROLL_ROT |  |
| _Roll_DEC | 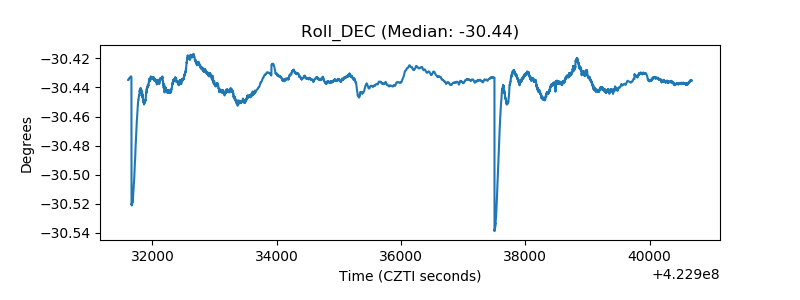 |
| _Roll_RA | 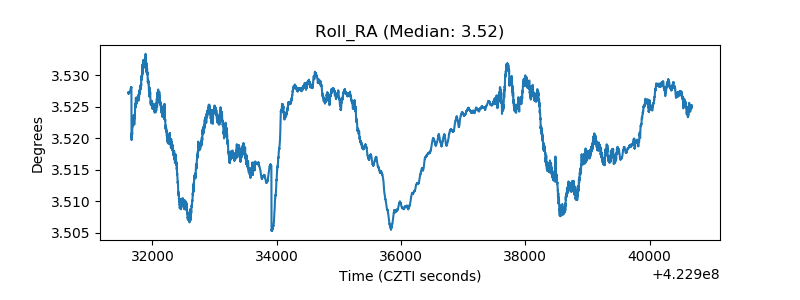 |
| Veto Counter | 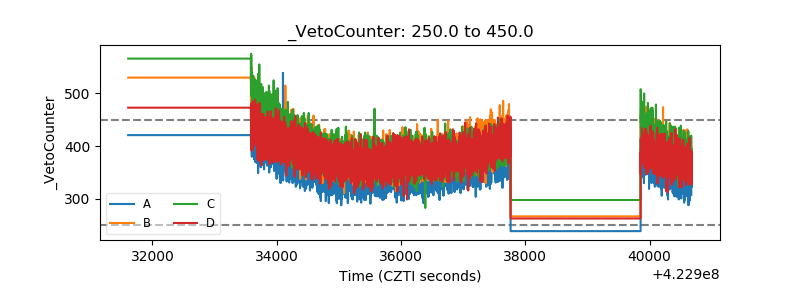 |