| Param | Original file | Final file |
|---|---|---|
| Filename | modeM0/AS1A12_035T01_9000005666_41434cztM0_level2.fits | modeM0/AS1A12_035T01_9000005666_41434cztM0_level2_quad_clean.evt |
| Size (bytes) | 318,153,600 | 86,258,880 |
| Size | 303.4 MB | 82.3 MB |
| Events in quadrant A | 2,843,339 | 576,796 |
| Events in quadrant B | 2,385,702 | 594,172 |
| Events in quadrant C | 3,005,509 | 548,998 |
| Events in quadrant D | 3,134,529 | 525,625 |
| Mode M0 | |||
|---|---|---|---|
| Quadrant | BADHDUFLAG | Total packets | Discarded packets |
| A | 0 | 11622 | 3 |
| B | 0 | 10711 | 2 |
| C | 0 | 12173 | 2 |
| D | 0 | 13005 | 2 |
| Mode SS | |||
|---|---|---|---|
| Quadrant | BADHDUFLAG | Total packets | Discarded packets |
| A | 0 | 106 | 0 |
| B | 0 | 106 | 0 |
| C | 0 | 106 | 0 |
| D | 0 | 106 | 0 |
| Mode M9 | |||
|---|---|---|---|
| Quadrant | BADHDUFLAG | Total packets | Discarded packets |
| A | 0 | 29 | 0 |
| B | 0 | 29 | 0 |
| C | 0 | 29 | 0 |
| D | 0 | 30 | 0 |
| Quadrant | Total seconds | Saturated seconds | Saturation percentage |
|---|---|---|---|
| A | 5233 | 18 | 0.343971% |
| B | 5233 | 12 | 0.229314% |
| C | 5233 | 233 | 4.452513% |
| D | 5233 | 80 | 1.528760% |
Noise dominated data is calculated using 1-second bins in cleaned event files. If a bin has >2000 counts, and if more than 50% of those come from <1% of pixels, then it is considered to be noise-dominated and hence unusable.
| Quadrant | # 1 sec bins | Bins with >0 counts | Bins with >2000 counts | High rate bins dominated by noise | Noise dominated (total time) | Noise dominated (detector-on time) | Marked lightcurve |
|---|---|---|---|---|---|---|---|
| A | 7115 | 5234 | 7 | 7 | 0.10% | 0.13% | 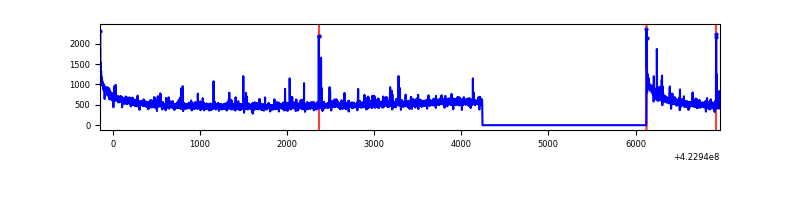 |
| B | 7115 | 5234 | 3 | 3 | 0.04% | 0.06% | 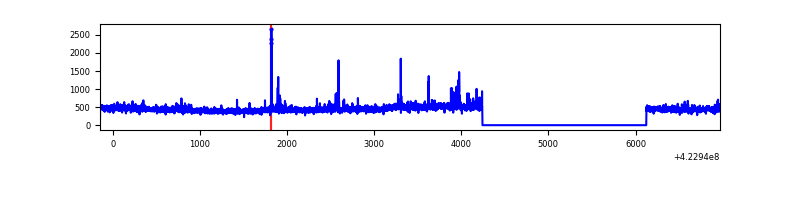 |
| C | 7115 | 5234 | 217 | 217 | 3.05% | 4.15% | 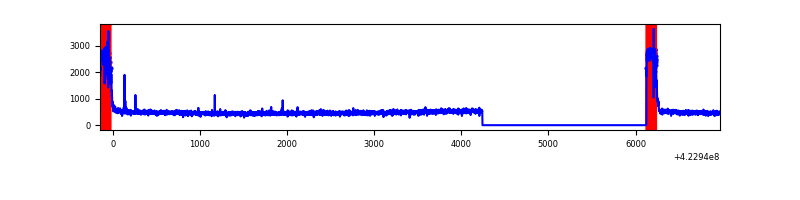 |
| D | 7115 | 5234 | 66 | 66 | 0.93% | 1.26% | 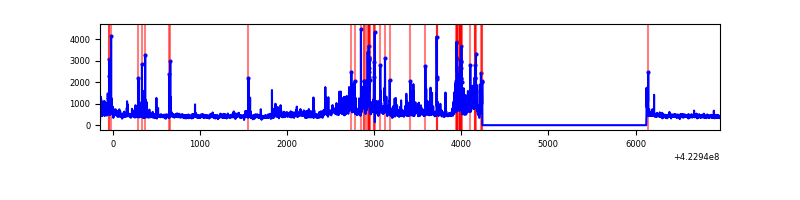 |
Top three noisy pixels from each quadrant. If the there are fewer than three noisy pixels in the level2.evt file, extra rows are filled as -1
| Pixel properties | Quadrant properties | ||||||
|---|---|---|---|---|---|---|---|
| Quadrant | DetID | PixID | Counts | Sigma | Mean | Median | Sigma |
| A | 10 | 83 | 509173 | 4300.08 | 577 | 564 | 118.3 |
| A | 2 | 79 | 57977 | 485.4 | 577 | 564 | 118.3 |
| A | 13 | 248 | 31714 | 263.36 | 577 | 564 | 118.3 |
| B | 0 | 190 | 100765 | 896.88 | 573 | 558 | 111.7 |
| B | 12 | 111 | 14417 | 124.04 | 573 | 558 | 111.7 |
| B | 0 | 186 | 14181 | 121.93 | 573 | 558 | 111.7 |
| C | 0 | 10 | 629147 | 4841.76 | 551 | 553 | 129.8 |
| C | 15 | 214 | 216113 | 1660.35 | 551 | 553 | 129.8 |
| C | 15 | 111 | 12659 | 93.25 | 551 | 553 | 129.8 |
| D | 12 | 233 | 229512 | 1645.12 | 566 | 551 | 139.2 |
| D | 13 | 171 | 209395 | 1500.57 | 566 | 551 | 139.2 |
| D | 12 | 79 | 194097 | 1390.66 | 566 | 551 | 139.2 |
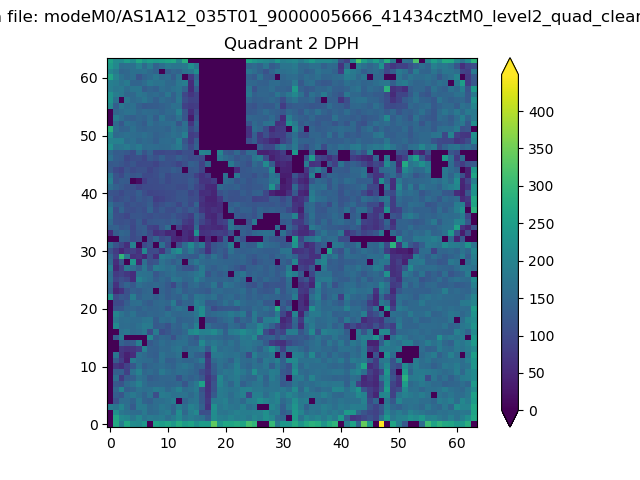
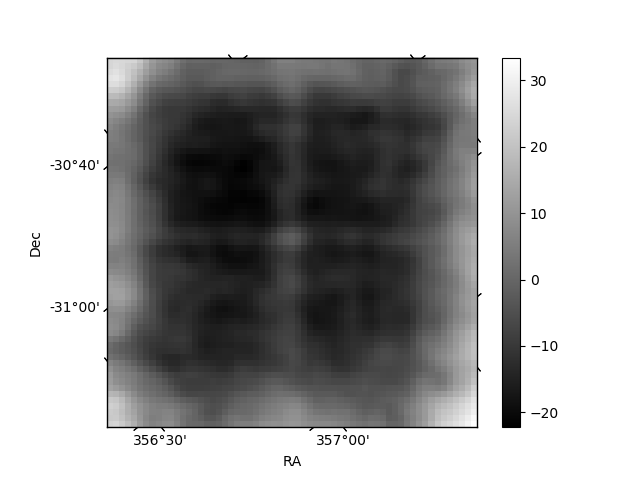
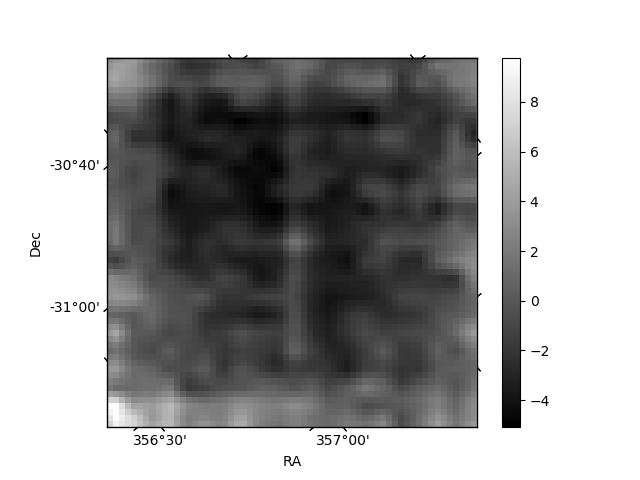
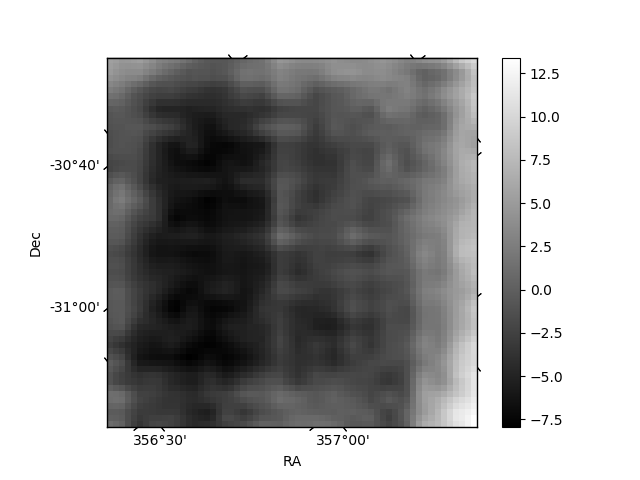
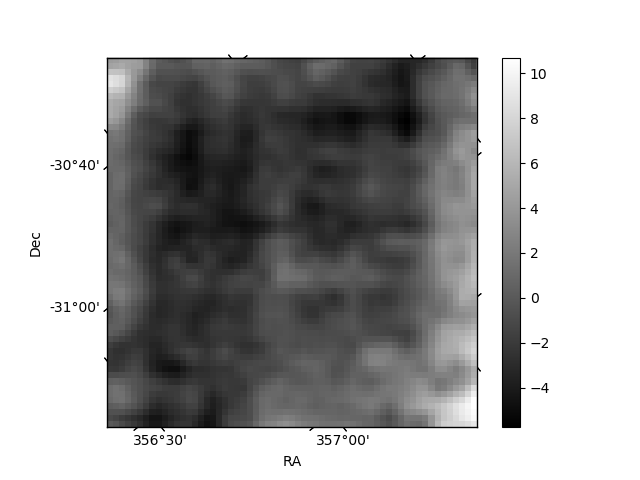
Histogram calculated using DETX and DETY for each event in the final _common_clean file
| Quadrant A | 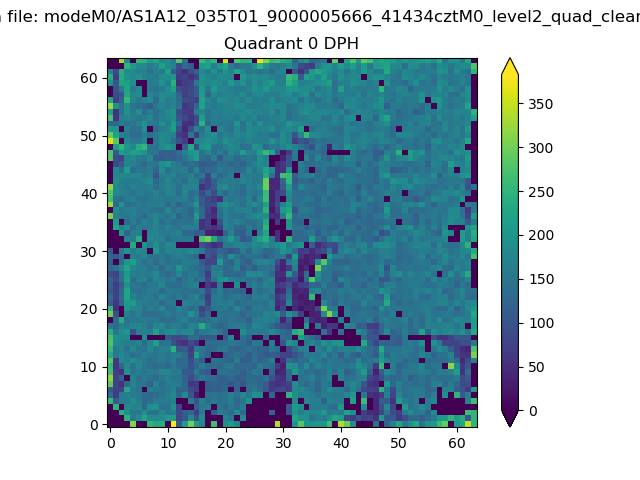 |
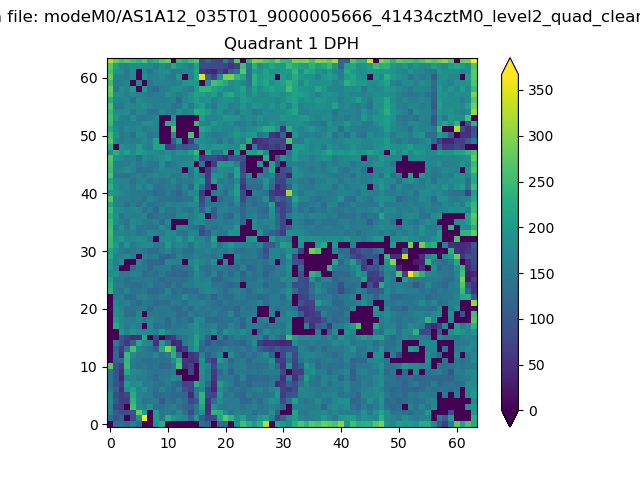 |
Quadrant B |
|---|---|---|---|
| Quadrant D | 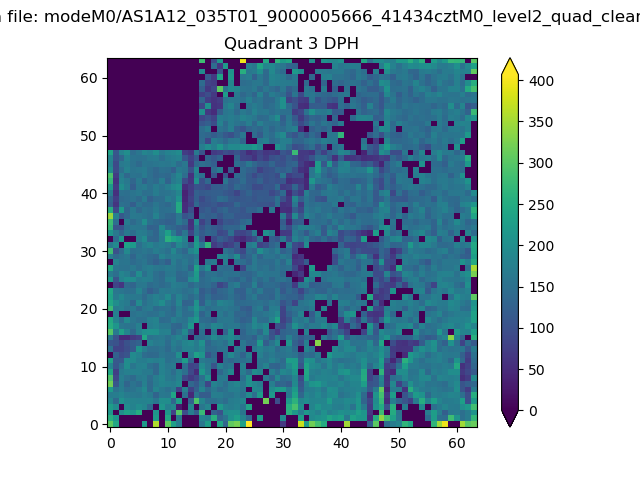 |
 |
Quadrant C |
| Plot type | Count rate plots | Images |
|---|---|---|
| Comparison with Poisson distribution Blue bars denote a histogram of data divided into 1 sec bins. Red curve is a Poisson curve with rate = median count rate of data. |
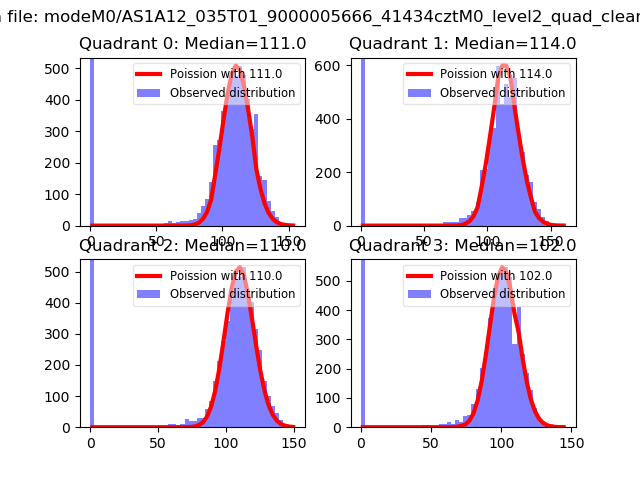 |
 |
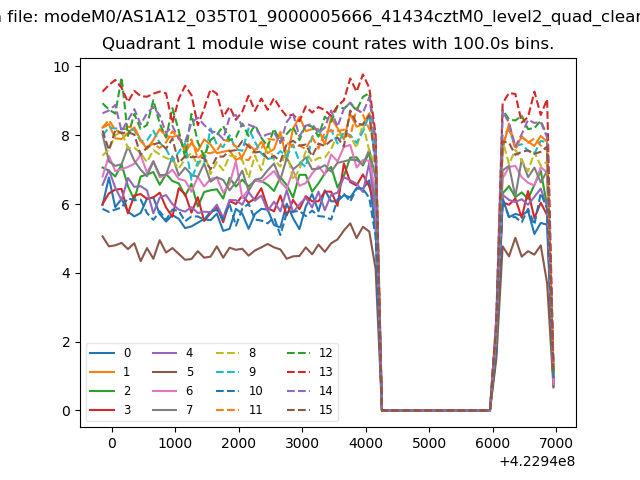
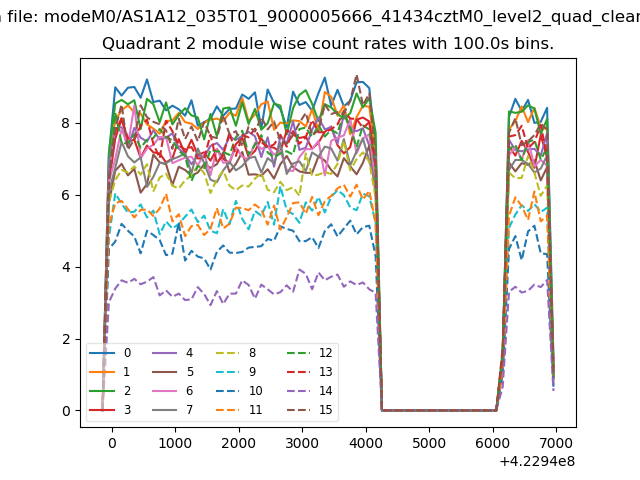
| Quadrant-wise count rates Data is divided into 100 sec bins |
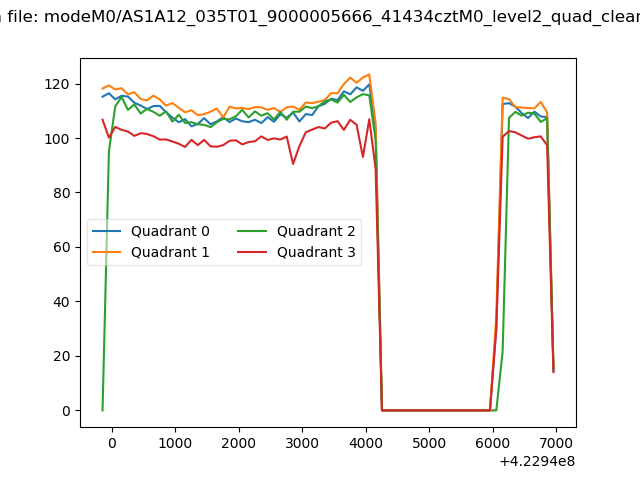 |
|
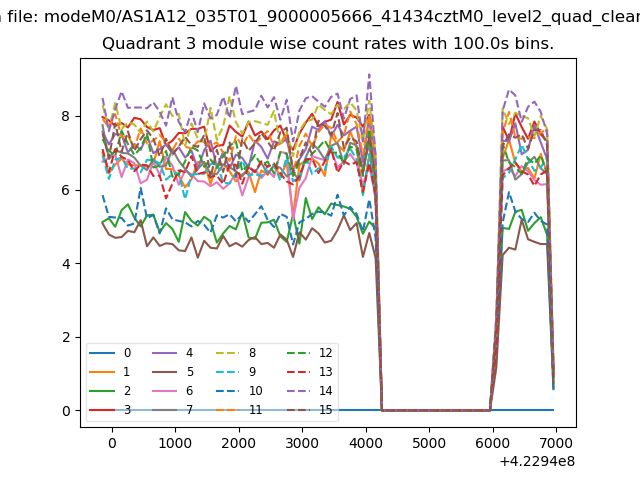
| Module-wise count rates for Quadrant A Data is divided into 100 sec bins |
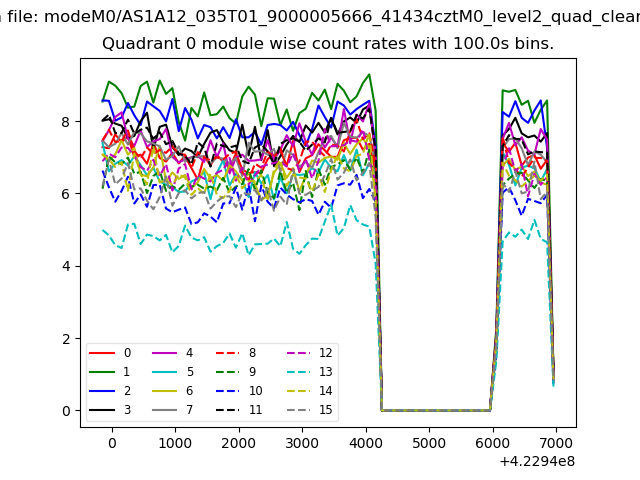 |
 |
| Module-wise count rates for Quadrant B Data is divided into 100 sec bins |
 |
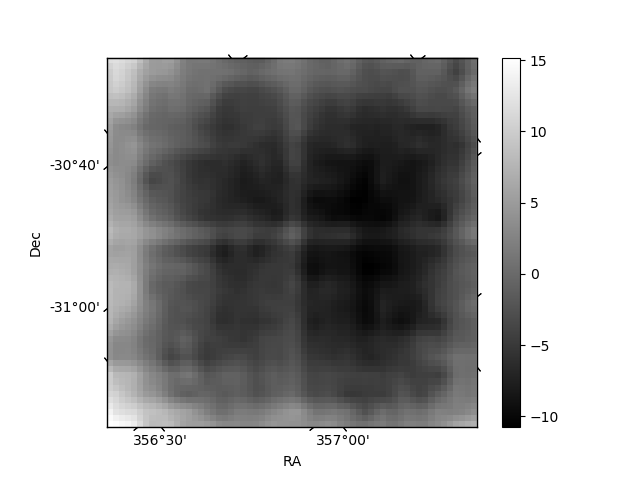 |
| Module-wise count rates for Quadrant C Data is divided into 100 sec bins |
 |
 |
| Module-wise count rates for Quadrant D Data is divided into 100 sec bins |
 |
 |
| Parameter | Plot |
|---|---|
| CZT HV Monitor | 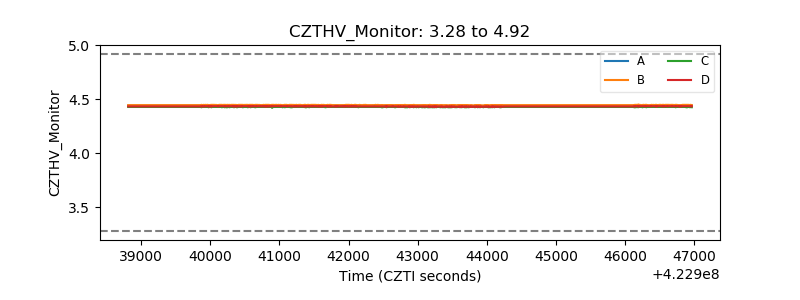 |
| D_VDD | 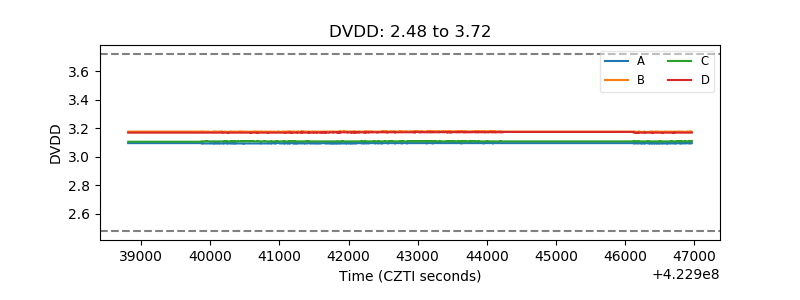 |
| Temperature 1 | 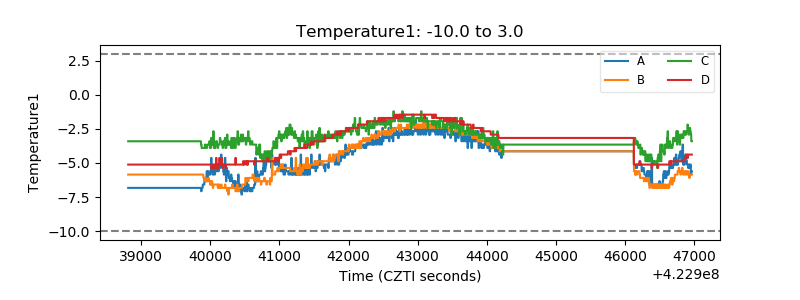 |
| Veto HV Monitor |  |
| Veto LLD | 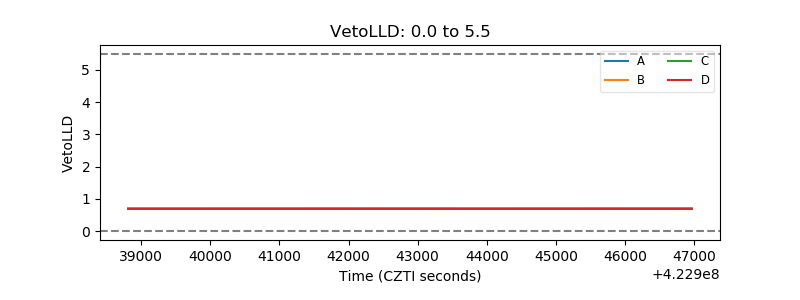 |
| Alpha Counter | 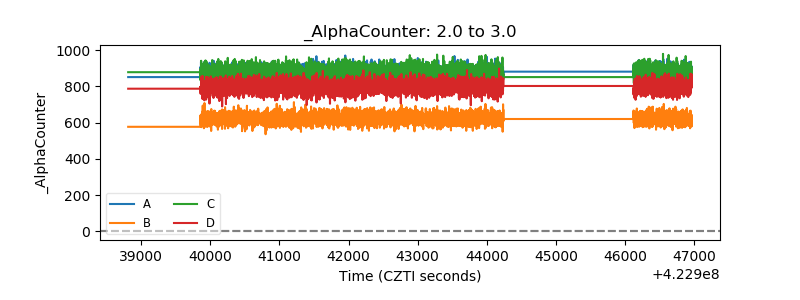 |
| _CPM_Rate | 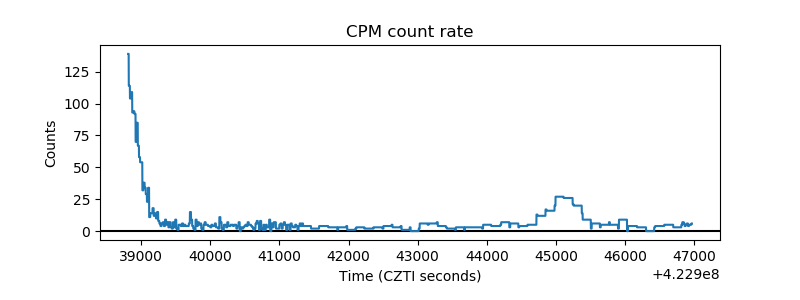 |
| CZT Counter | 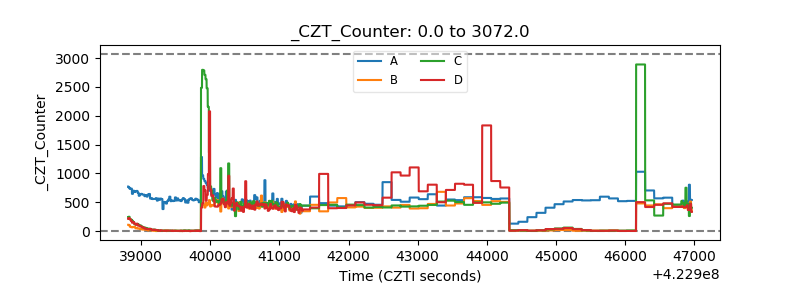 |
| +2.5 Volts monitor | 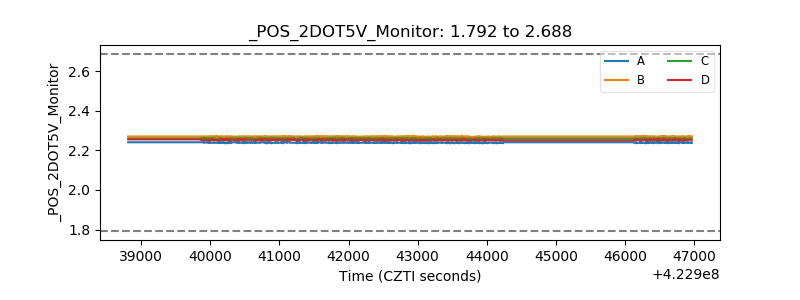 |
| +5 Volts monitor | 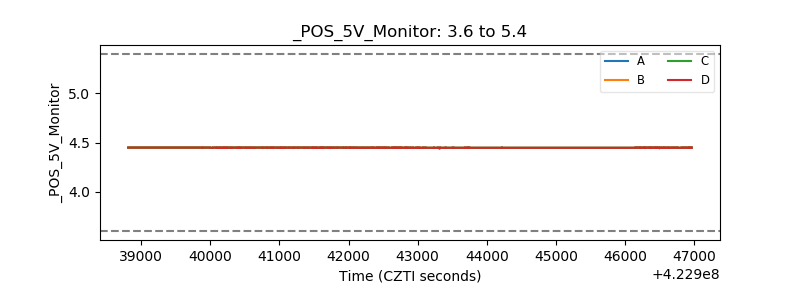 |
| _ROLL_ROT |  |
| _Roll_DEC | 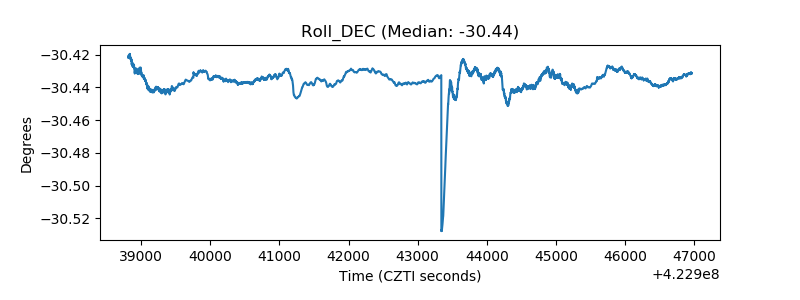 |
| _Roll_RA | 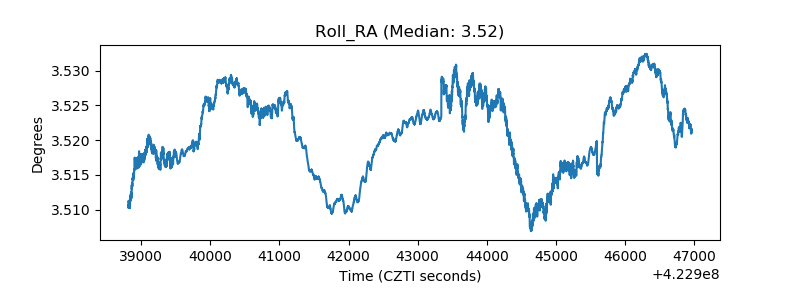 |
| Veto Counter | 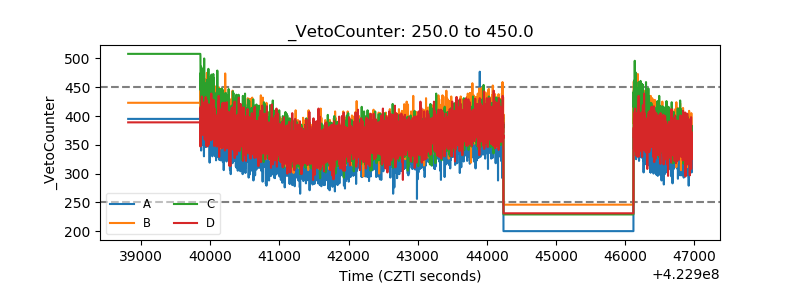 |