| Param | Original file | Final file |
|---|---|---|
| Filename | modeM0/AS1A12_035T01_9000005666_41435cztM0_level2.fits | modeM0/AS1A12_035T01_9000005666_41435cztM0_level2_quad_clean.evt |
| Size (bytes) | 329,690,880 | 90,288,000 |
| Size | 314.4 MB | 86.1 MB |
| Events in quadrant A | 3,087,590 | 604,161 |
| Events in quadrant B | 2,831,813 | 615,124 |
| Events in quadrant C | 3,146,470 | 573,649 |
| Events in quadrant D | 2,704,969 | 552,411 |
| Mode M0 | |||
|---|---|---|---|
| Quadrant | BADHDUFLAG | Total packets | Discarded packets |
| A | 0 | 12598 | 3 |
| B | 0 | 12284 | 2 |
| C | 0 | 12808 | 2 |
| D | 0 | 11902 | 2 |
| Mode SS | |||
|---|---|---|---|
| Quadrant | BADHDUFLAG | Total packets | Discarded packets |
| A | 0 | 112 | 0 |
| B | 0 | 112 | 0 |
| C | 0 | 112 | 0 |
| D | 0 | 112 | 0 |
| Mode M9 | |||
|---|---|---|---|
| Quadrant | BADHDUFLAG | Total packets | Discarded packets |
| A | 0 | 17 | 0 |
| B | 0 | 17 | 0 |
| C | 0 | 17 | 0 |
| D | 0 | 18 | 0 |
| Quadrant | Total seconds | Saturated seconds | Saturation percentage |
|---|---|---|---|
| A | 5556 | 14 | 0.251980% |
| B | 5556 | 71 | 1.277898% |
| C | 5556 | 229 | 4.121670% |
| D | 5556 | 36 | 0.647948% |
Noise dominated data is calculated using 1-second bins in cleaned event files. If a bin has >2000 counts, and if more than 50% of those come from <1% of pixels, then it is considered to be noise-dominated and hence unusable.
| Quadrant | # 1 sec bins | Bins with >0 counts | Bins with >2000 counts | High rate bins dominated by noise | Noise dominated (total time) | Noise dominated (detector-on time) | Marked lightcurve |
|---|---|---|---|---|---|---|---|
| A | 7080 | 5557 | 6 | 6 | 0.08% | 0.11% | 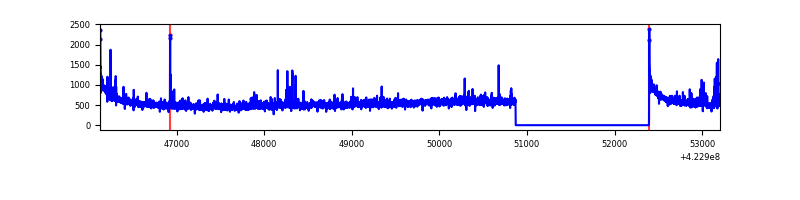 |
| B | 7080 | 5557 | 34 | 34 | 0.48% | 0.61% | 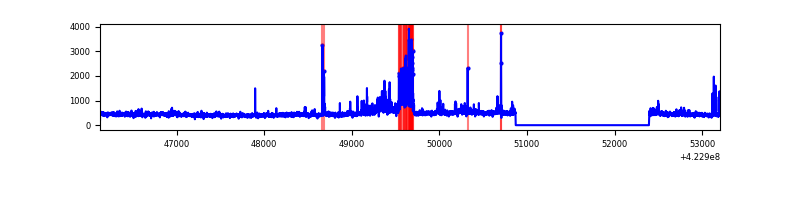 |
| C | 7080 | 5557 | 223 | 223 | 3.15% | 4.01% | 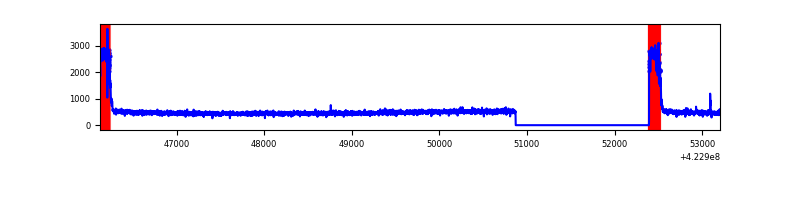 |
| D | 7080 | 5557 | 22 | 22 | 0.31% | 0.40% | 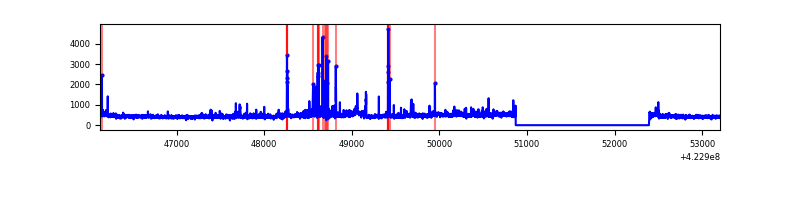 |
Top three noisy pixels from each quadrant. If the there are fewer than three noisy pixels in the level2.evt file, extra rows are filled as -1
| Pixel properties | Quadrant properties | ||||||
|---|---|---|---|---|---|---|---|
| Quadrant | DetID | PixID | Counts | Sigma | Mean | Median | Sigma |
| A | 10 | 83 | 539979 | 4215.6 | 616 | 600 | 127.9 |
| A | 2 | 79 | 55240 | 427.05 | 616 | 600 | 127.9 |
| A | 12 | 189 | 54143 | 418.47 | 616 | 600 | 127.9 |
| B | 0 | 186 | 268825 | 2228.56 | 608 | 591 | 120.4 |
| B | 0 | 190 | 143154 | 1184.45 | 608 | 591 | 120.4 |
| B | 5 | 252 | 17540 | 140.82 | 608 | 591 | 120.4 |
| C | 0 | 10 | 630309 | 4547.5 | 586 | 586 | 138.5 |
| C | 15 | 214 | 227798 | 1640.79 | 586 | 586 | 138.5 |
| C | 15 | 111 | 5583 | 36.08 | 586 | 586 | 138.5 |
| D | 13 | 249 | 104048 | 701.88 | 604 | 586 | 147.4 |
| D | 1 | 52 | 84019 | 566.01 | 604 | 586 | 147.4 |
| D | 13 | 171 | 73383 | 493.85 | 604 | 586 | 147.4 |
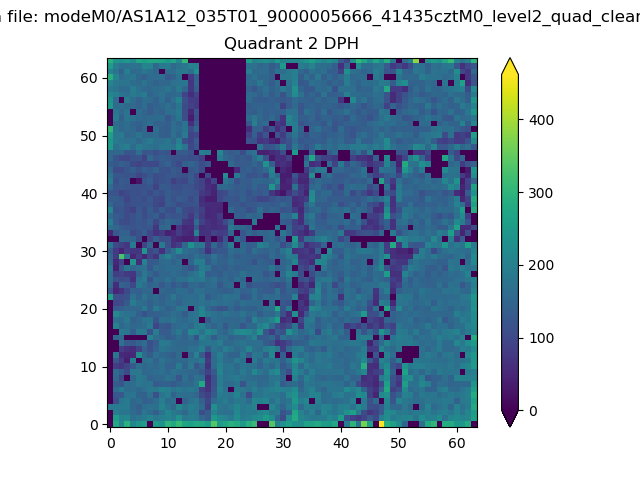
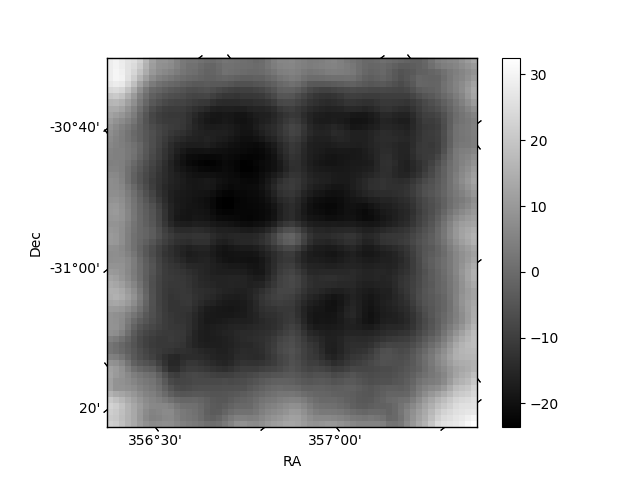
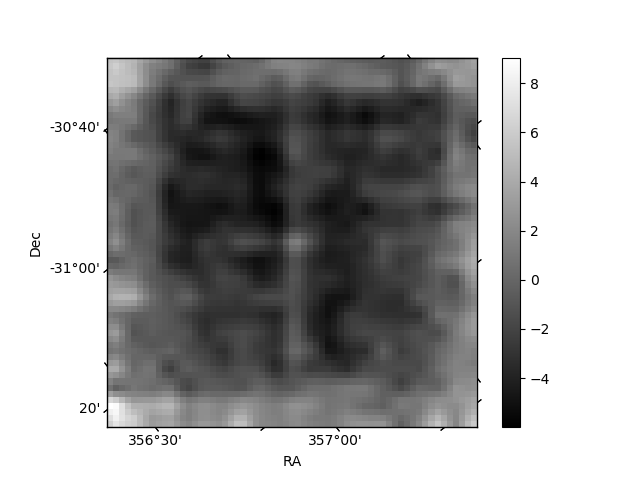
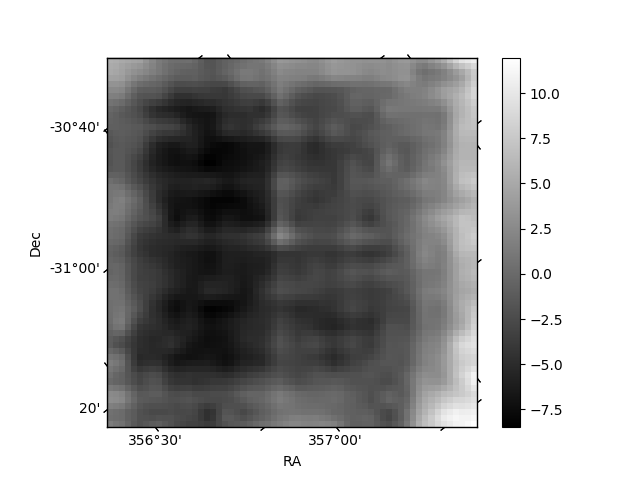
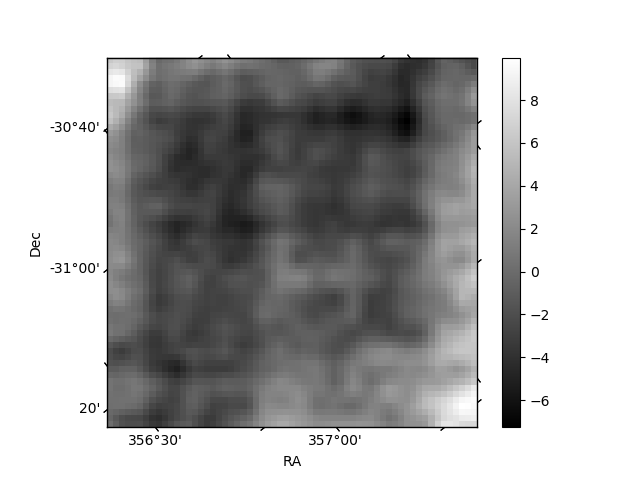
Histogram calculated using DETX and DETY for each event in the final _common_clean file
| Quadrant A | 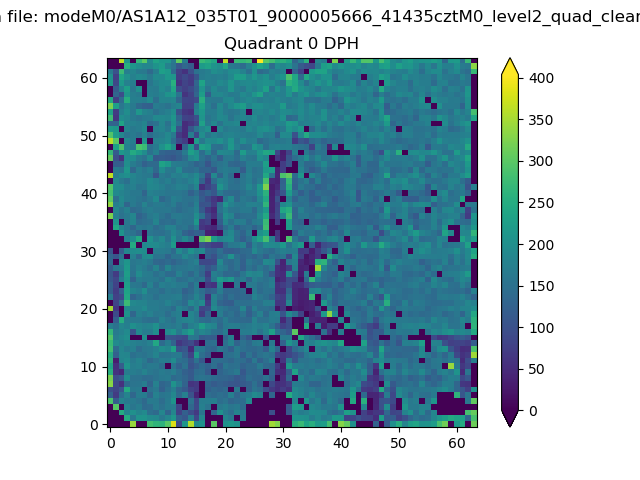 |
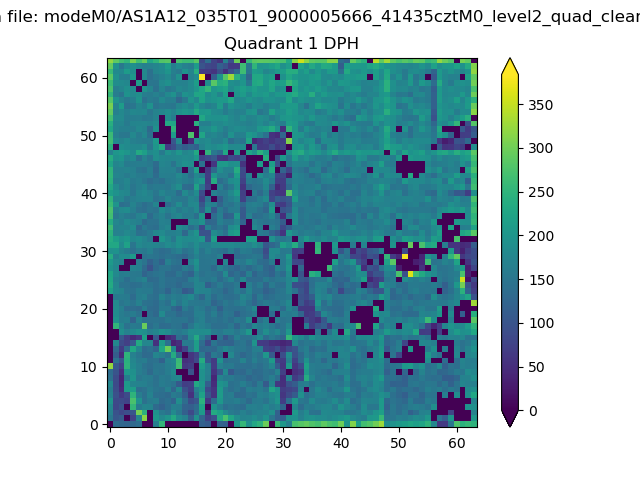 |
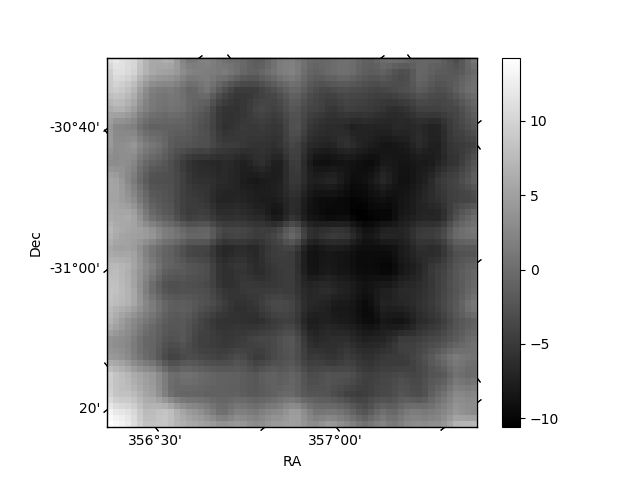
Quadrant B |
|---|---|---|---|
| Quadrant D | 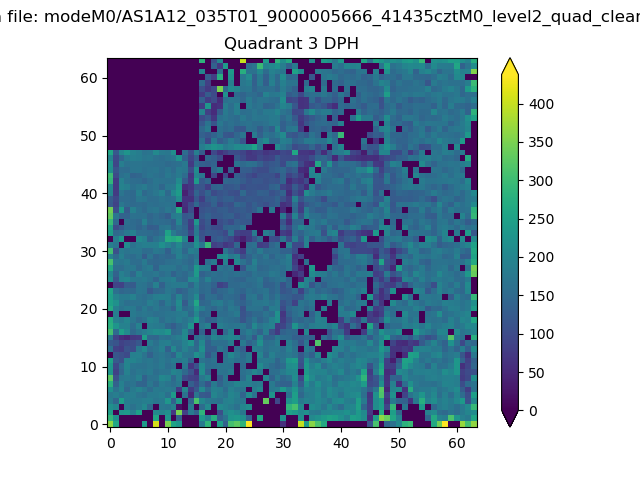 |
 |
Quadrant C |
| Plot type | Count rate plots | Images |
|---|---|---|
| Comparison with Poisson distribution Blue bars denote a histogram of data divided into 1 sec bins. Red curve is a Poisson curve with rate = median count rate of data. |
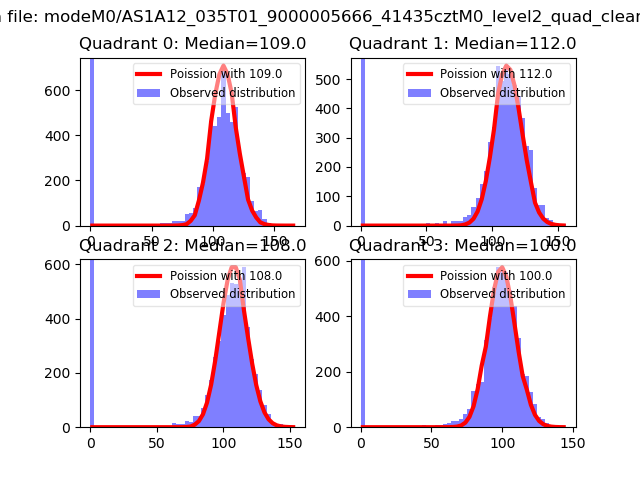 |
 |
| Quadrant-wise count rates Data is divided into 100 sec bins |
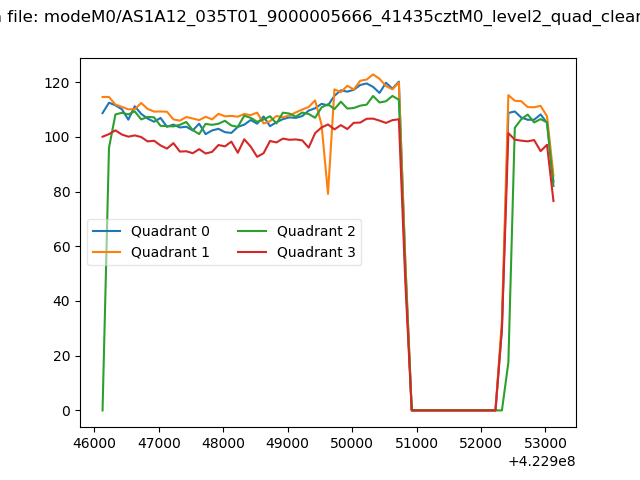 |
|
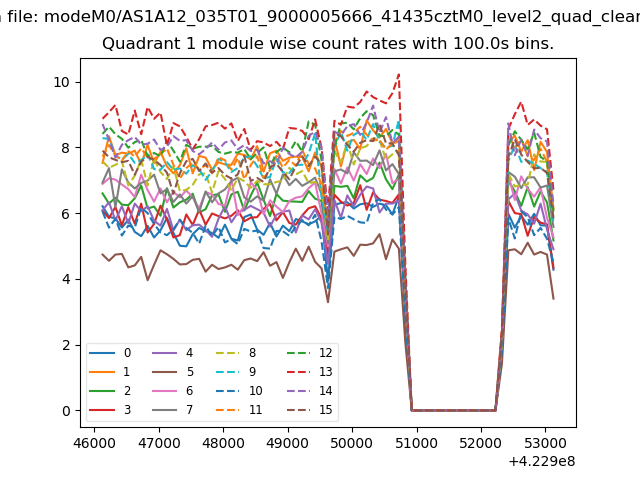
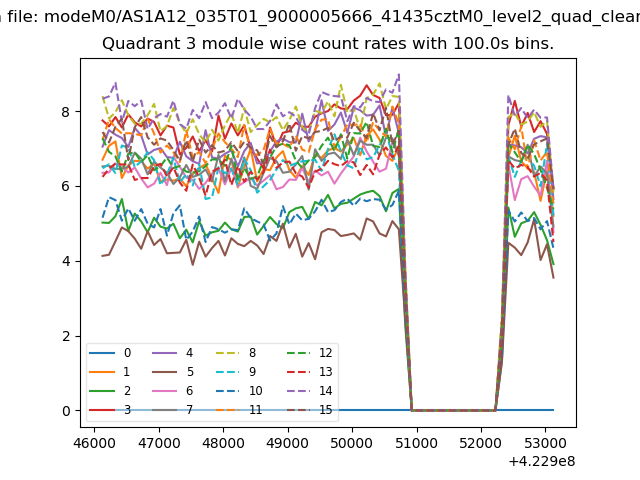
| Module-wise count rates for Quadrant A Data is divided into 100 sec bins |
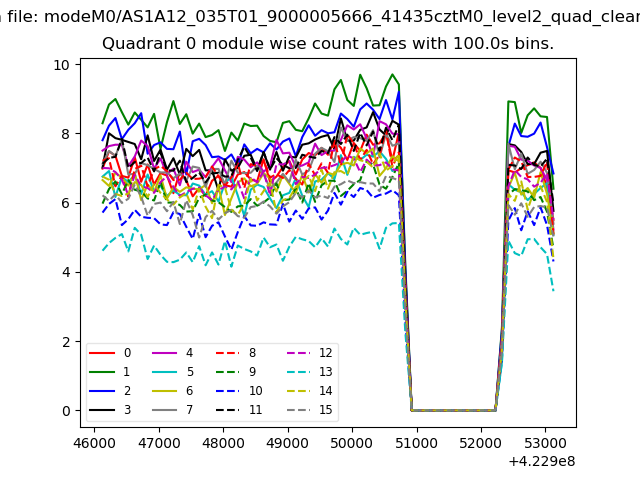 |
 |
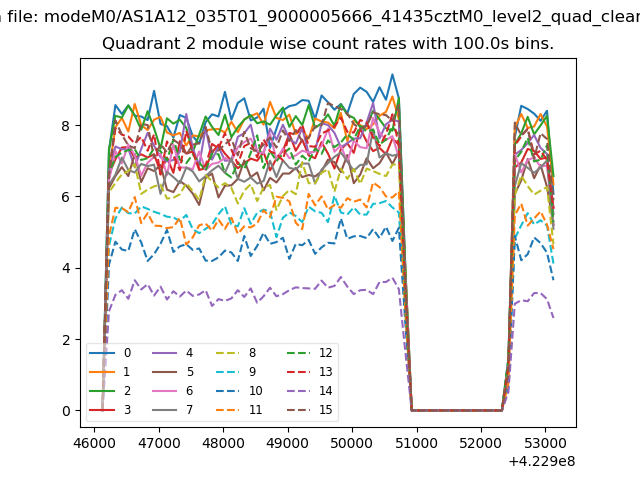
| Module-wise count rates for Quadrant B Data is divided into 100 sec bins |
 |
 |
| Module-wise count rates for Quadrant C Data is divided into 100 sec bins |
 |
 |
| Module-wise count rates for Quadrant D Data is divided into 100 sec bins |
 |
 |
| Parameter | Plot |
|---|---|
| CZT HV Monitor | 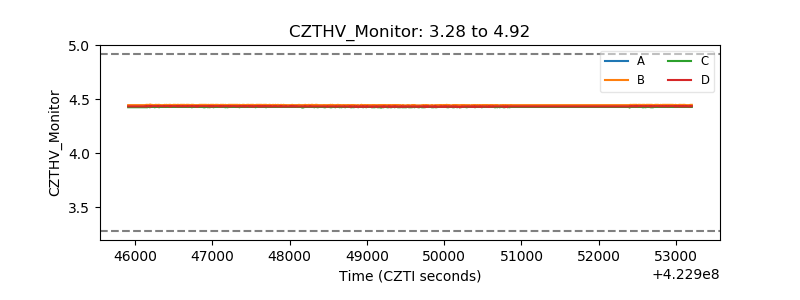 |
| D_VDD | 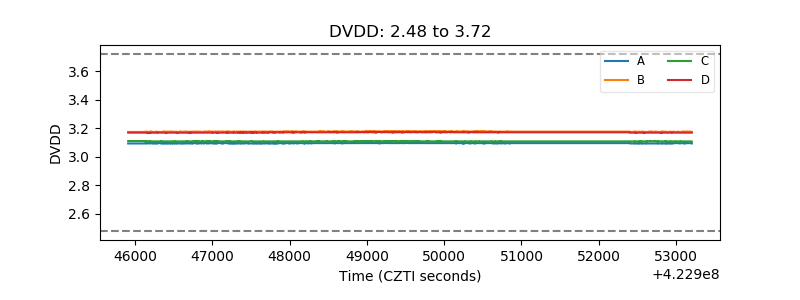 |
| Temperature 1 | 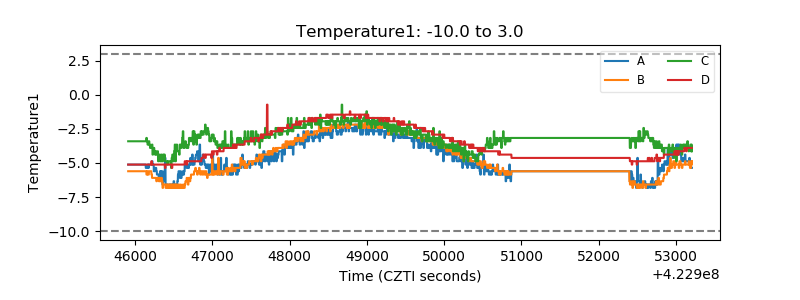 |
| Veto HV Monitor | 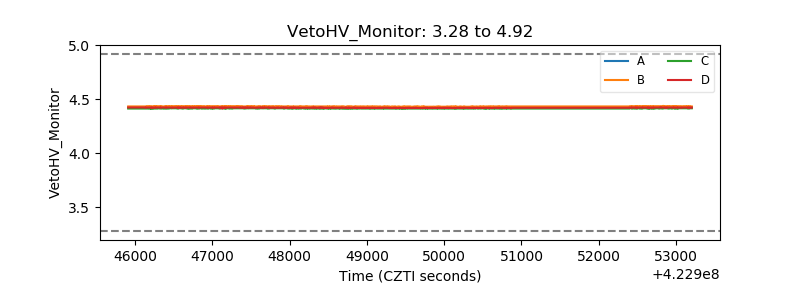 |
| Veto LLD | 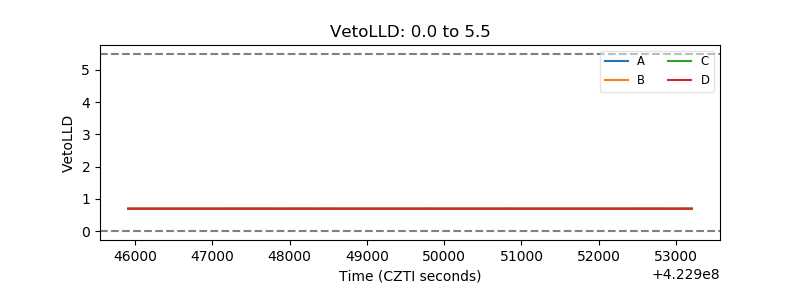 |
| Alpha Counter | 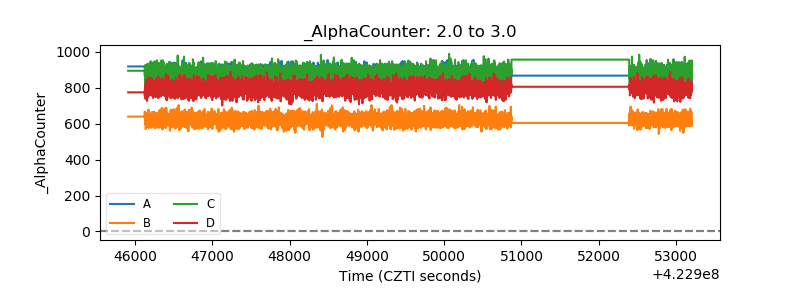 |
| _CPM_Rate | 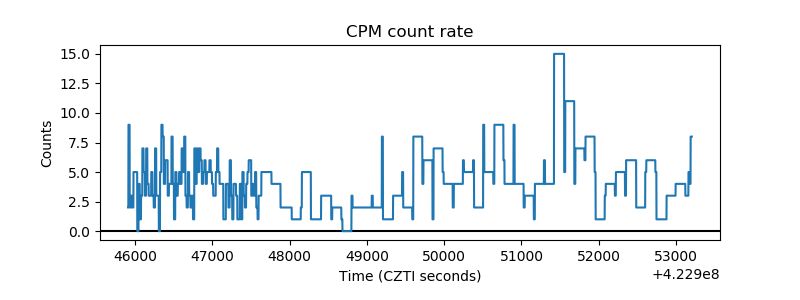 |
| CZT Counter | 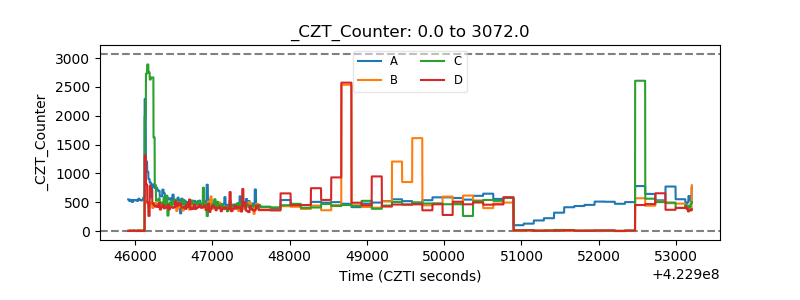 |
| +2.5 Volts monitor | 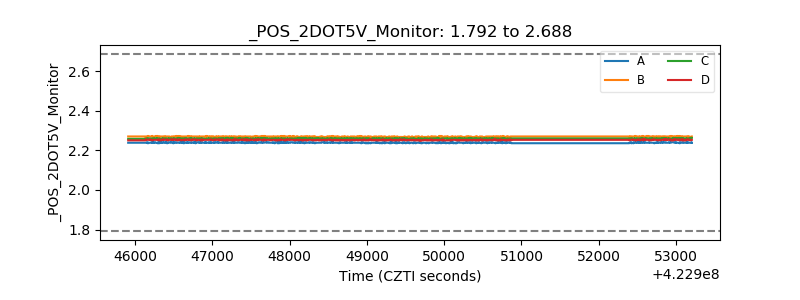 |
| +5 Volts monitor | 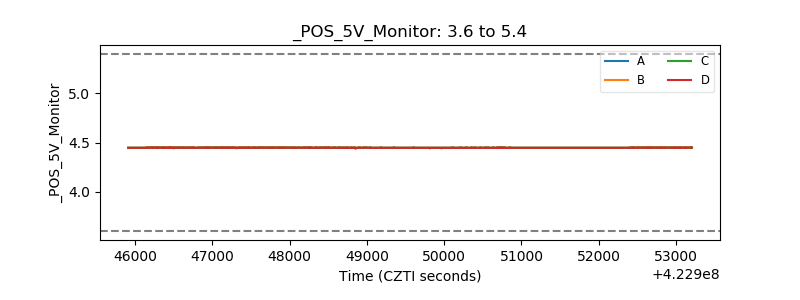 |
| _ROLL_ROT | 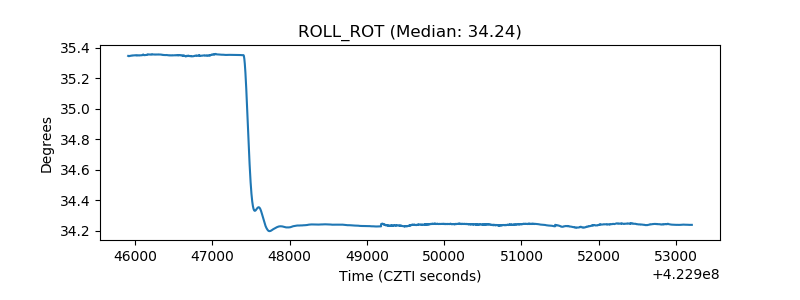 |
| _Roll_DEC | 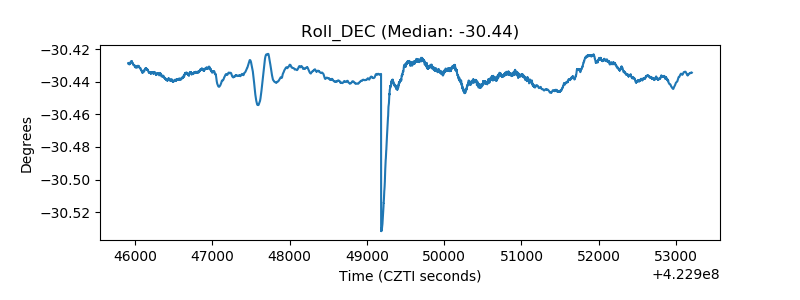 |
| _Roll_RA | 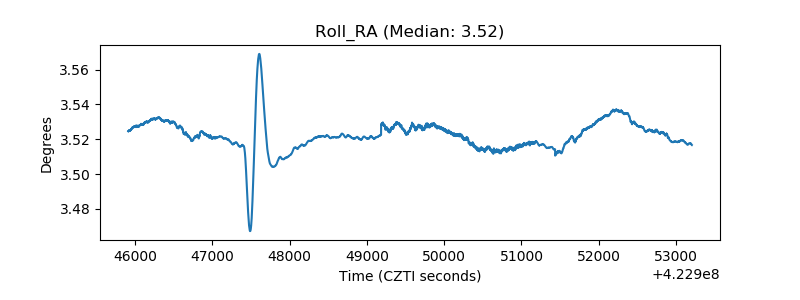 |
| Veto Counter | 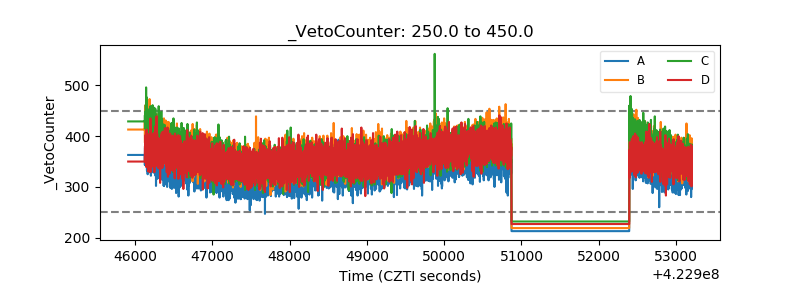 |