| Param | Original file | Final file |
|---|---|---|
| Filename | modeM0/AS1A12_035T01_9000005666_41436cztM0_level2.fits | modeM0/AS1A12_035T01_9000005666_41436cztM0_level2_quad_clean.evt |
| Size (bytes) | 412,182,720 | 99,195,840 |
| Size | 393.1 MB | 94.6 MB |
| Events in quadrant A | 3,555,089 | 673,197 |
| Events in quadrant B | 3,085,896 | 690,387 |
| Events in quadrant C | 3,482,846 | 642,332 |
| Events in quadrant D | 4,650,653 | 563,675 |
| Mode M0 | |||
|---|---|---|---|
| Quadrant | BADHDUFLAG | Total packets | Discarded packets |
| A | 0 | 14248 | 3 |
| B | 0 | 13428 | 2 |
| C | 0 | 14126 | 2 |
| D | 0 | 18239 | 2 |
| Mode SS | |||
|---|---|---|---|
| Quadrant | BADHDUFLAG | Total packets | Discarded packets |
| A | 0 | 130 | 0 |
| B | 0 | 130 | 0 |
| C | 0 | 130 | 0 |
| D | 0 | 130 | 0 |
| Mode M9 | |||
|---|---|---|---|
| Quadrant | BADHDUFLAG | Total packets | Discarded packets |
| A | 0 | 28 | 0 |
| B | 0 | 28 | 0 |
| C | 0 | 28 | 0 |
| D | 0 | 28 | 0 |
| Quadrant | Total seconds | Saturated seconds | Saturation percentage |
|---|---|---|---|
| A | 6210 | 19 | 0.305958% |
| B | 6210 | 49 | 0.789050% |
| C | 6210 | 224 | 3.607085% |
| D | 6210 | 613 | 9.871176% |
Noise dominated data is calculated using 1-second bins in cleaned event files. If a bin has >2000 counts, and if more than 50% of those come from <1% of pixels, then it is considered to be noise-dominated and hence unusable.
| Quadrant | # 1 sec bins | Bins with >0 counts | Bins with >2000 counts | High rate bins dominated by noise | Noise dominated (total time) | Noise dominated (detector-on time) | Marked lightcurve |
|---|---|---|---|---|---|---|---|
| A | 9045 | 6212 | 11 | 11 | 0.12% | 0.18% | 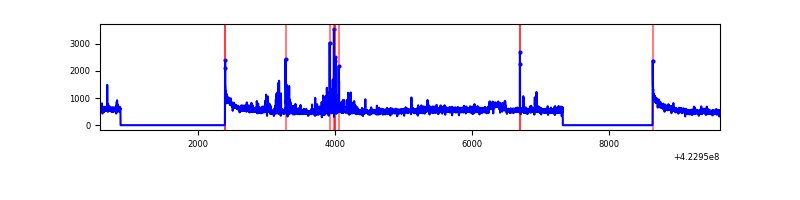 |
| B | 9045 | 6212 | 22 | 22 | 0.24% | 0.35% | 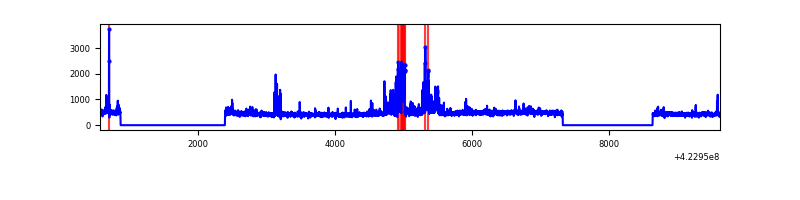 |
| C | 9045 | 6212 | 220 | 220 | 2.43% | 3.54% | 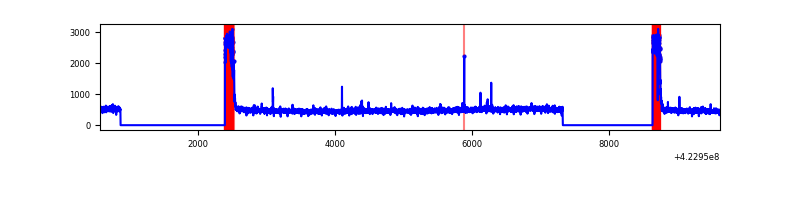 |
| D | 9045 | 6212 | 535 | 535 | 5.91% | 8.61% | 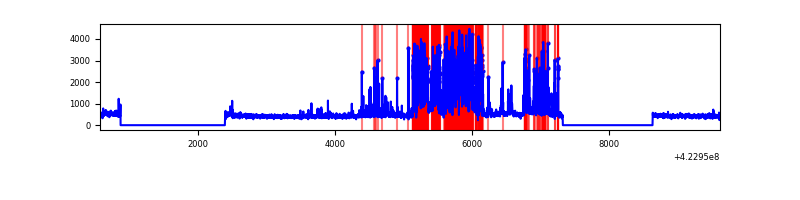 |
Top three noisy pixels from each quadrant. If the there are fewer than three noisy pixels in the level2.evt file, extra rows are filled as -1
| Pixel properties | Quadrant properties | ||||||
|---|---|---|---|---|---|---|---|
| Quadrant | DetID | PixID | Counts | Sigma | Mean | Median | Sigma |
| A | 10 | 83 | 583596 | 4076.36 | 693 | 680 | 143.0 |
| A | 12 | 189 | 136820 | 952.03 | 693 | 680 | 143.0 |
| A | 13 | 248 | 84254 | 584.44 | 693 | 680 | 143.0 |
| B | 0 | 186 | 243134 | 1797.85 | 686 | 666 | 134.9 |
| B | 0 | 190 | 106325 | 783.44 | 686 | 666 | 134.9 |
| B | 5 | 252 | 23717 | 170.92 | 686 | 666 | 134.9 |
| C | 0 | 10 | 621090 | 3995.32 | 661 | 665 | 155.3 |
| C | 15 | 214 | 253999 | 1631.38 | 661 | 665 | 155.3 |
| C | 15 | 111 | 22034 | 137.61 | 661 | 665 | 155.3 |
| D | 1 | 47 | 1863913 | 11639.2 | 649 | 630 | 160.1 |
| D | 13 | 249 | 170250 | 1059.55 | 649 | 630 | 160.1 |
| D | 1 | 52 | 48536 | 299.25 | 649 | 630 | 160.1 |
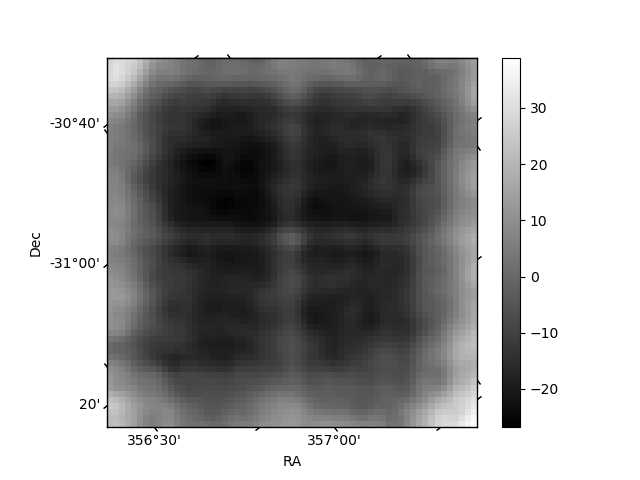
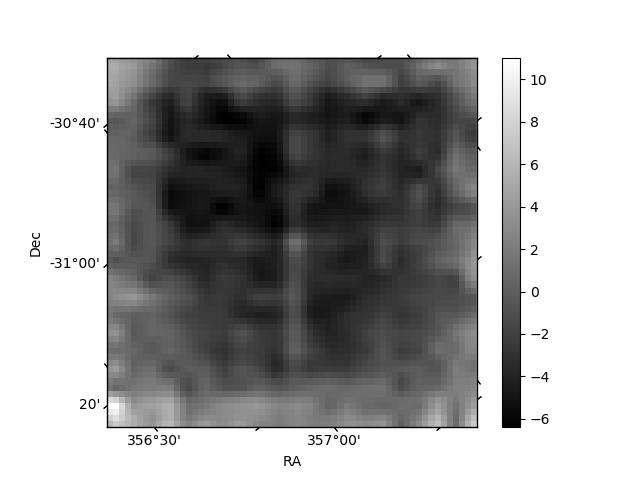
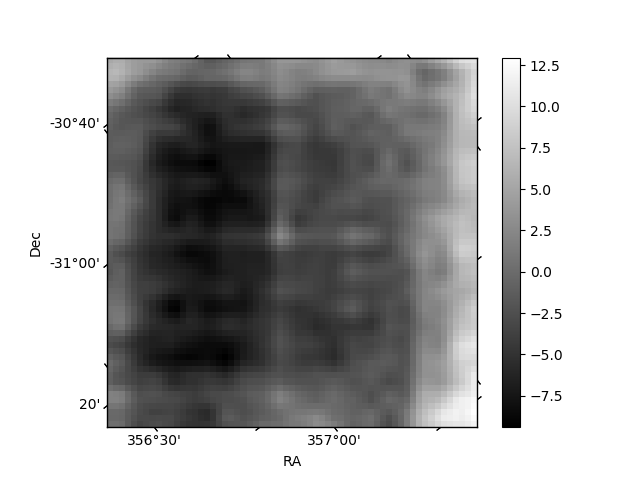
Histogram calculated using DETX and DETY for each event in the final _common_clean file
| Quadrant A | 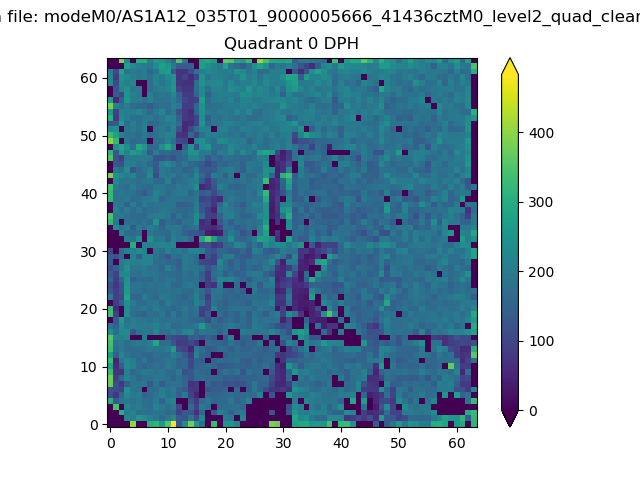 |
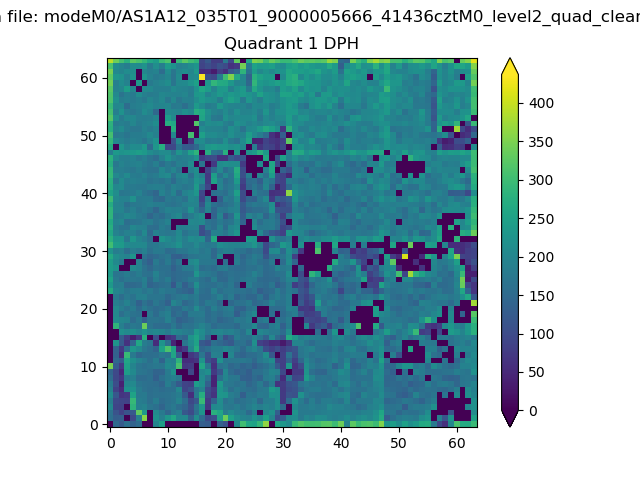 |
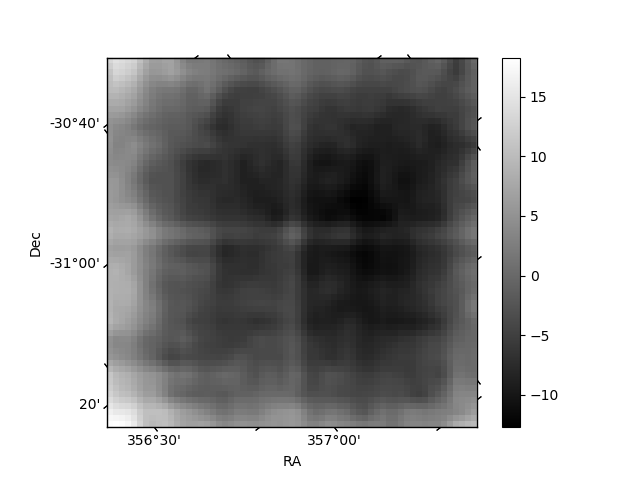
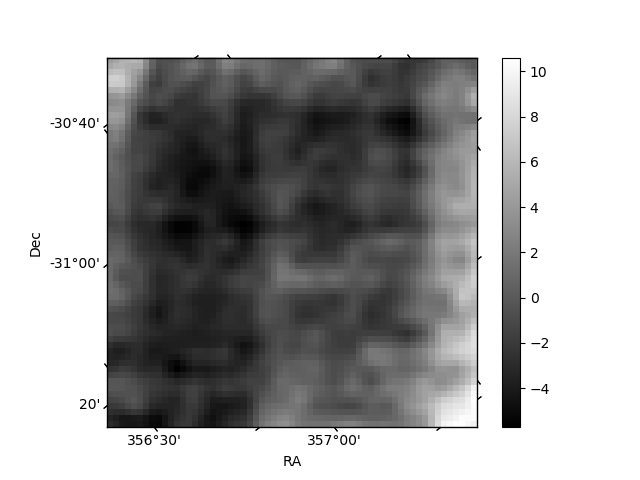
Quadrant B |
|---|---|---|---|
| Quadrant D | 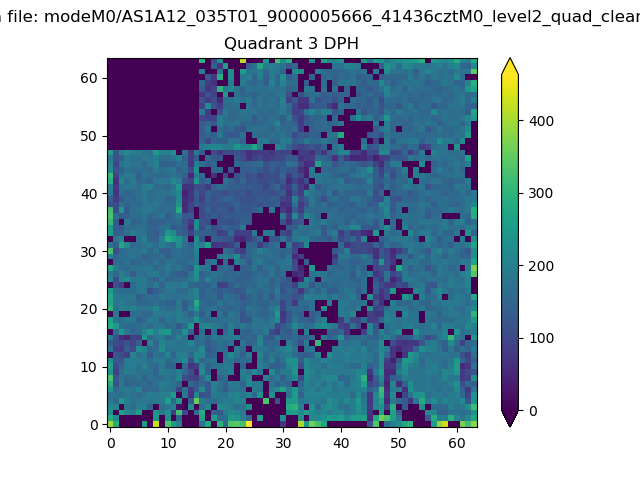 |
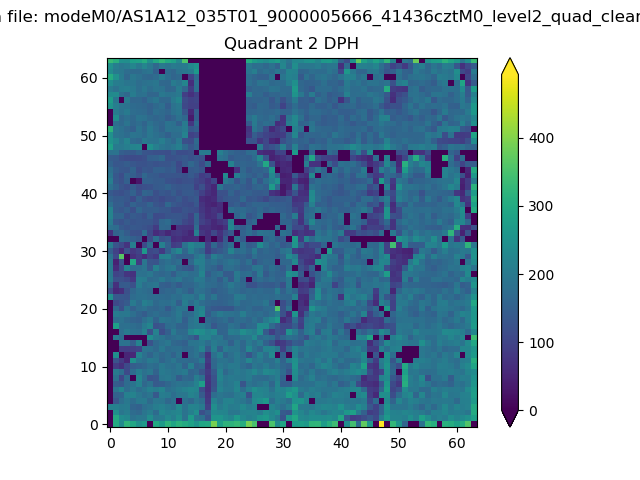 |
Quadrant C |
| Plot type | Count rate plots | Images |
|---|---|---|
| Comparison with Poisson distribution Blue bars denote a histogram of data divided into 1 sec bins. Red curve is a Poisson curve with rate = median count rate of data. |
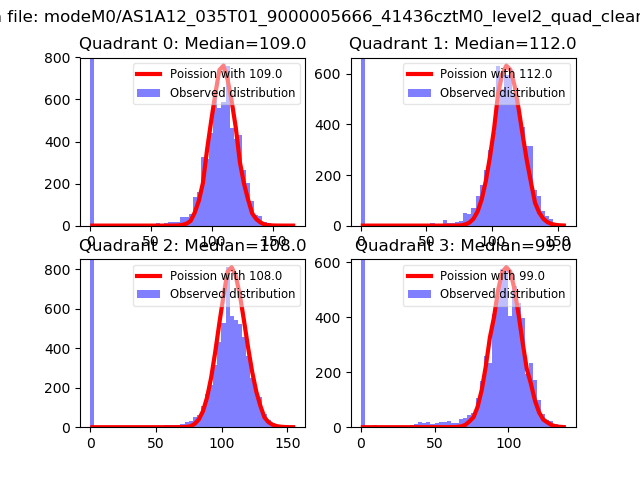 |
 |
| Quadrant-wise count rates Data is divided into 100 sec bins |
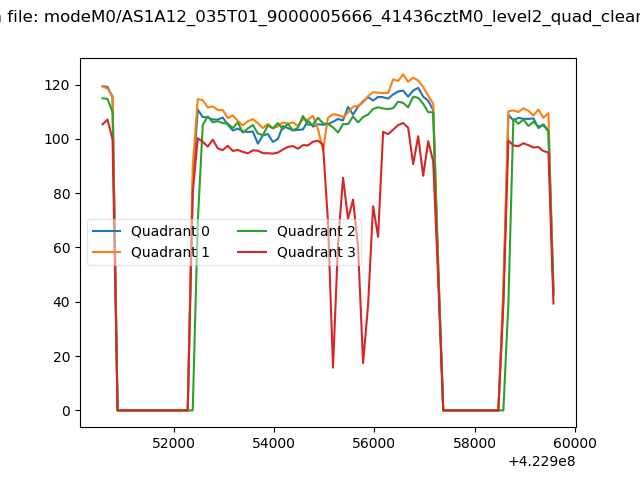 |
|
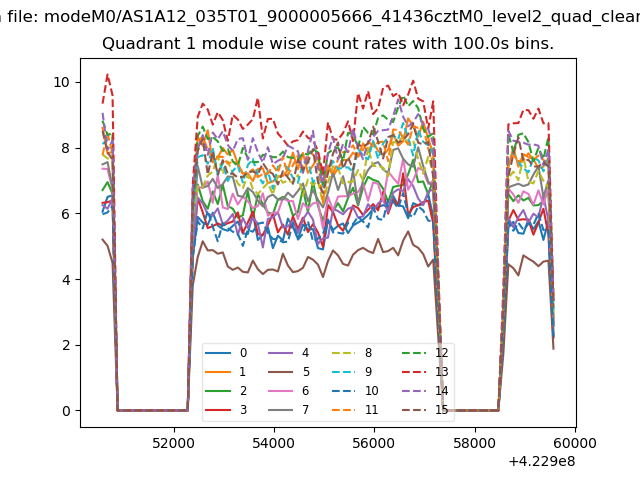
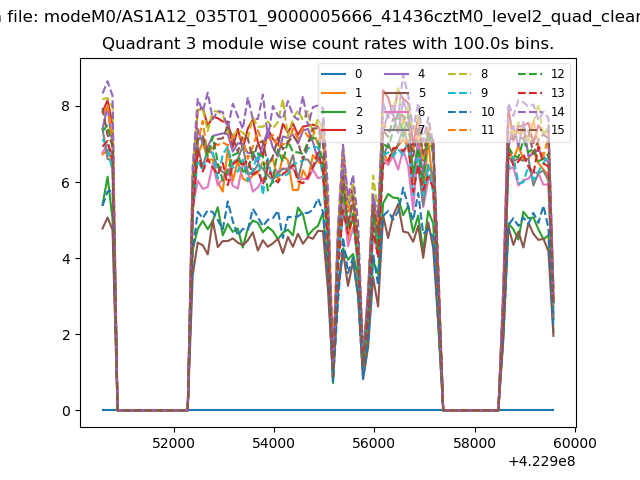
| Module-wise count rates for Quadrant A Data is divided into 100 sec bins |
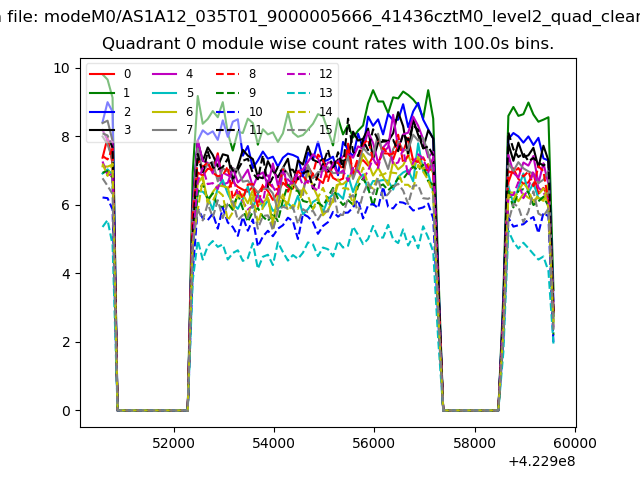 |
 |
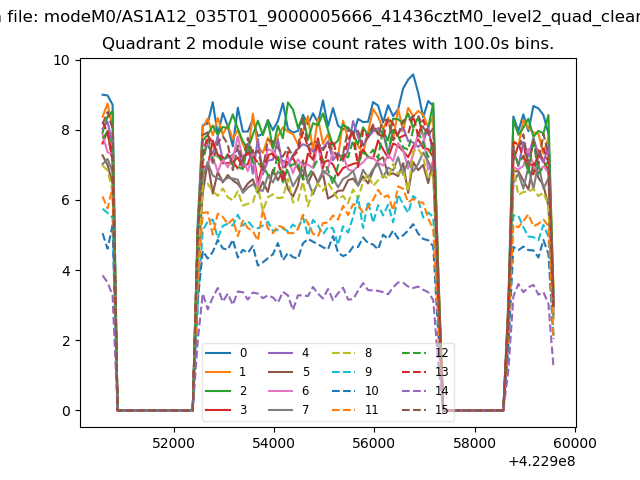
| Module-wise count rates for Quadrant B Data is divided into 100 sec bins |
 |
 |
| Module-wise count rates for Quadrant C Data is divided into 100 sec bins |
 |
 |
| Module-wise count rates for Quadrant D Data is divided into 100 sec bins |
 |
 |
| Parameter | Plot |
|---|---|
| CZT HV Monitor | 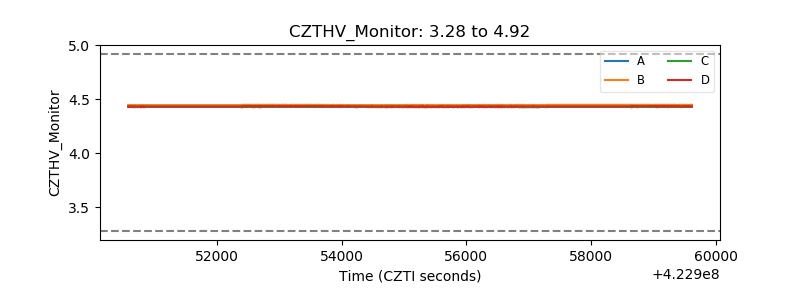 |
| D_VDD | 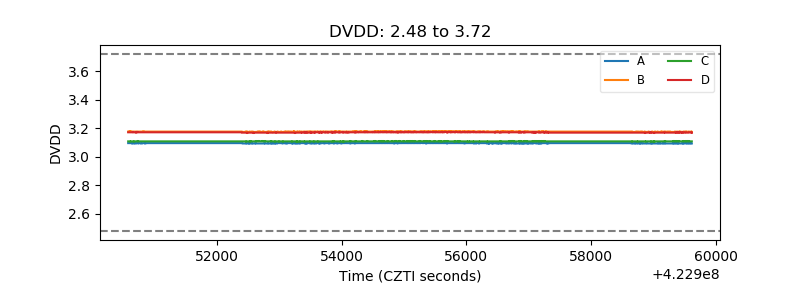 |
| Temperature 1 | 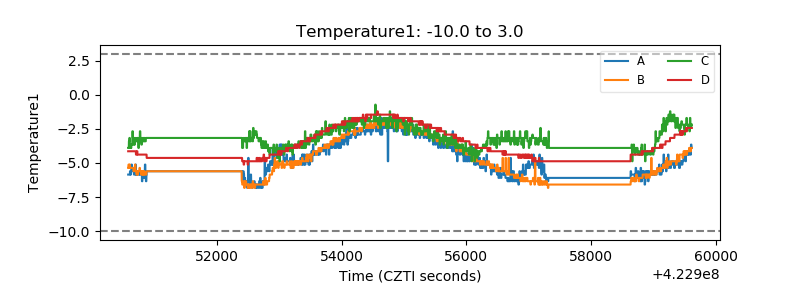 |
| Veto HV Monitor | 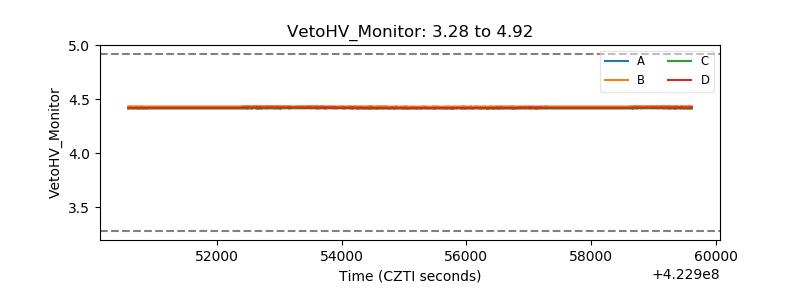 |
| Veto LLD | 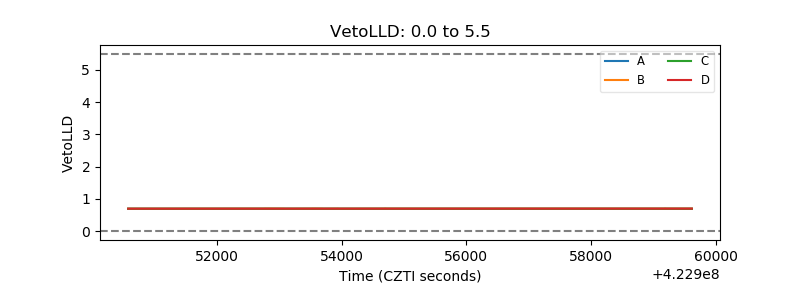 |
| Alpha Counter | 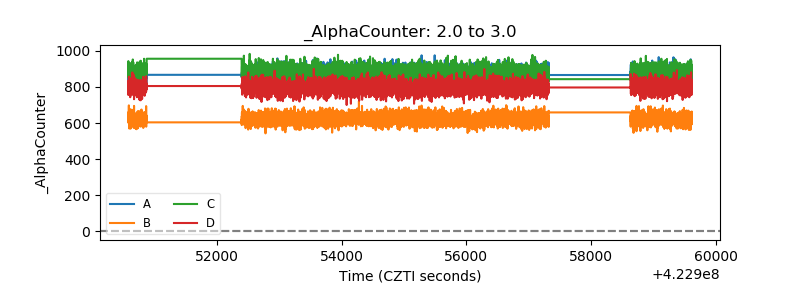 |
| _CPM_Rate | 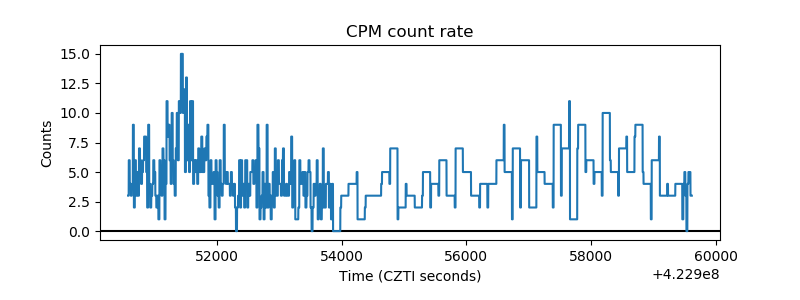 |
| CZT Counter | 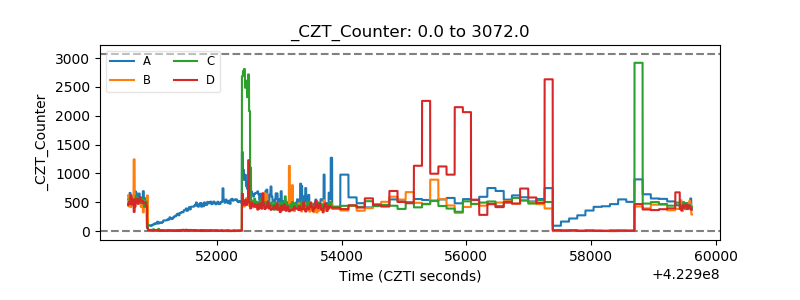 |
| +2.5 Volts monitor | 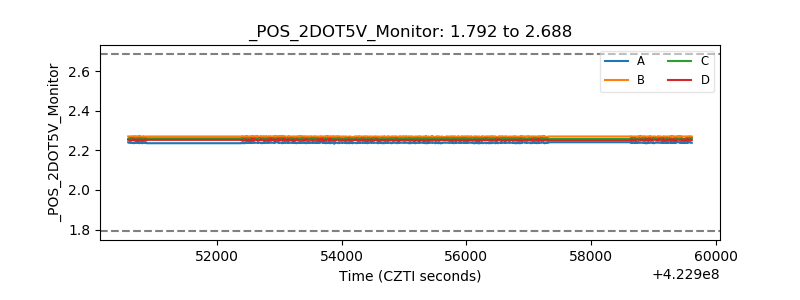 |
| +5 Volts monitor | 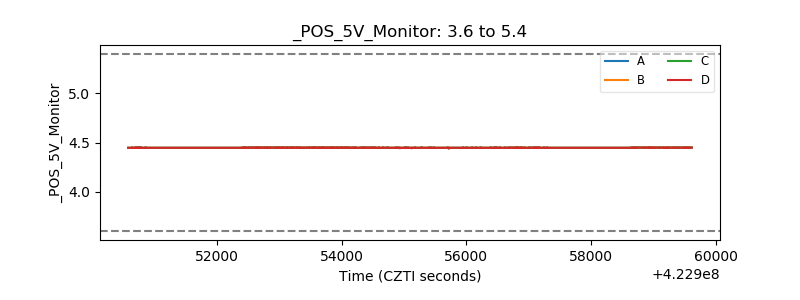 |
| _ROLL_ROT | 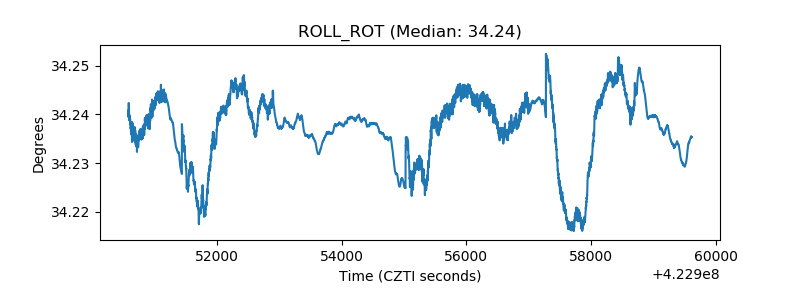 |
| _Roll_DEC | 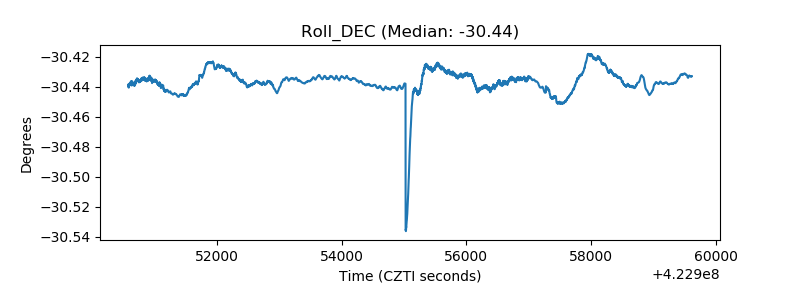 |
| _Roll_RA | 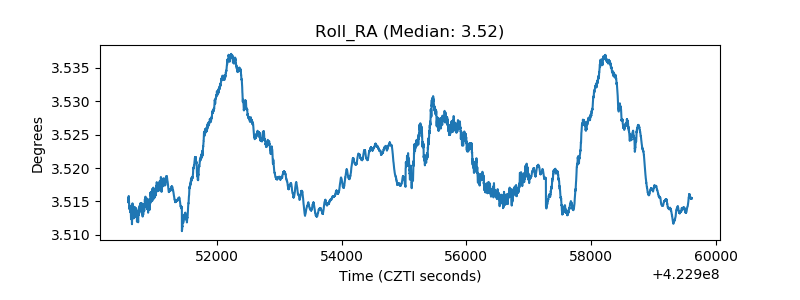 |
| Veto Counter | 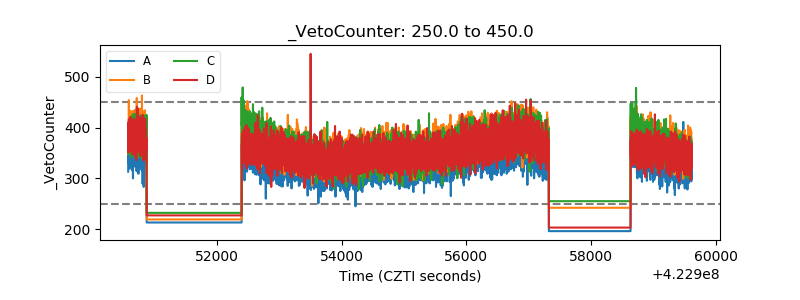 |