| Param | Original file | Final file |
|---|---|---|
| Filename | modeM0/AS1A12_035T01_9000005666_41439cztM0_level2.fits | modeM0/AS1A12_035T01_9000005666_41439cztM0_level2_quad_clean.evt |
| Size (bytes) | 682,243,200 | 170,265,600 |
| Size | 650.6 MB | 162.4 MB |
| Events in quadrant A | 6,304,203 | 1,150,900 |
| Events in quadrant B | 4,932,109 | 1,177,899 |
| Events in quadrant C | 5,507,665 | 1,112,503 |
| Events in quadrant D | 7,682,799 | 974,786 |
| Mode M0 | |||
|---|---|---|---|
| Quadrant | BADHDUFLAG | Total packets | Discarded packets |
| A | 0 | 25020 | 3 |
| B | 0 | 21778 | 2 |
| C | 0 | 22955 | 2 |
| D | 0 | 29928 | 2 |
| Mode SS | |||
|---|---|---|---|
| Quadrant | BADHDUFLAG | Total packets | Discarded packets |
| A | 0 | 218 | 0 |
| B | 0 | 218 | 0 |
| C | 0 | 218 | 0 |
| D | 0 | 218 | 0 |
| Mode M9 | |||
|---|---|---|---|
| Quadrant | BADHDUFLAG | Total packets | Discarded packets |
| A | 0 | 27 | 0 |
| B | 0 | 27 | 0 |
| C | 0 | 27 | 0 |
| D | 0 | 27 | 0 |
| Quadrant | Total seconds | Saturated seconds | Saturation percentage |
|---|---|---|---|
| A | 10670 | 24 | 0.224930% |
| B | 10670 | 12 | 0.112465% |
| C | 10670 | 204 | 1.911903% |
| D | 10670 | 808 | 7.572634% |
Noise dominated data is calculated using 1-second bins in cleaned event files. If a bin has >2000 counts, and if more than 50% of those come from <1% of pixels, then it is considered to be noise-dominated and hence unusable.
| Quadrant | # 1 sec bins | Bins with >0 counts | Bins with >2000 counts | High rate bins dominated by noise | Noise dominated (total time) | Noise dominated (detector-on time) | Marked lightcurve |
|---|---|---|---|---|---|---|---|
| A | 13446 | 10672 | 4 | 4 | 0.03% | 0.04% | 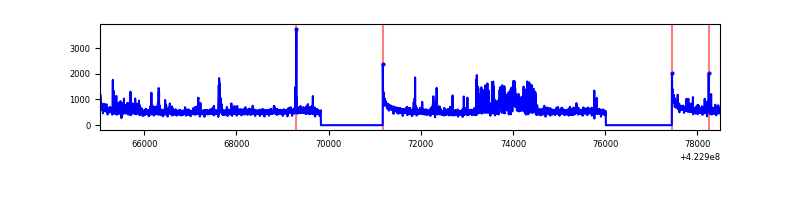 |
| B | 13446 | 10672 | 1 | 1 | 0.01% | 0.01% | 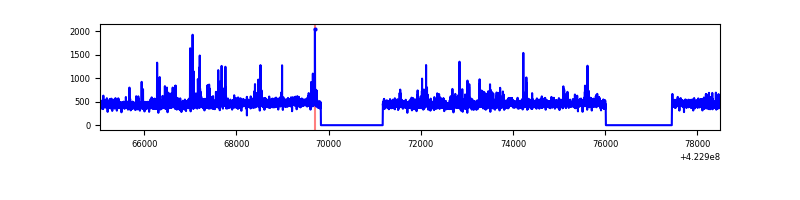 |
| C | 13446 | 10672 | 195 | 195 | 1.45% | 1.83% | 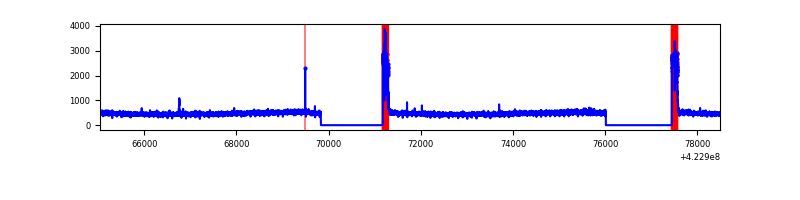 |
| D | 13446 | 10672 | 667 | 667 | 4.96% | 6.25% | 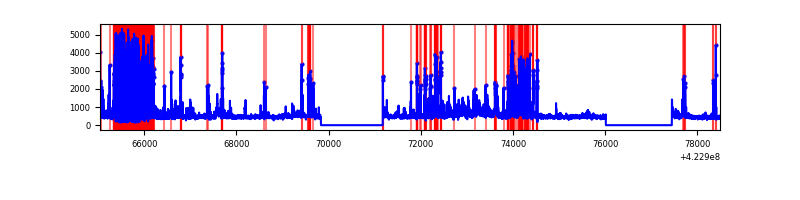 |
Top three noisy pixels from each quadrant. If the there are fewer than three noisy pixels in the level2.evt file, extra rows are filled as -1
| Pixel properties | Quadrant properties | ||||||
|---|---|---|---|---|---|---|---|
| Quadrant | DetID | PixID | Counts | Sigma | Mean | Median | Sigma |
| A | 10 | 83 | 920176 | 3776.83 | 1191 | 1164 | 243.3 |
| A | 2 | 79 | 660828 | 2711.0 | 1191 | 1164 | 243.3 |
| A | 12 | 189 | 51824 | 208.19 | 1191 | 1164 | 243.3 |
| B | 0 | 190 | 207145 | 894.38 | 1183 | 1150 | 230.3 |
| B | 0 | 155 | 34169 | 143.36 | 1183 | 1150 | 230.3 |
| B | 12 | 111 | 29542 | 123.27 | 1183 | 1150 | 230.3 |
| C | 0 | 10 | 569763 | 2112.88 | 1150 | 1156 | 269.1 |
| C | 15 | 214 | 438544 | 1625.28 | 1150 | 1156 | 269.1 |
| C | 12 | 249 | 13619 | 46.31 | 1150 | 1156 | 269.1 |
| D | 1 | 52 | 1931973 | 6977.61 | 1125 | 1091 | 276.7 |
| D | 13 | 249 | 1112507 | 4016.32 | 1125 | 1091 | 276.7 |
| D | 13 | 171 | 114109 | 408.41 | 1125 | 1091 | 276.7 |
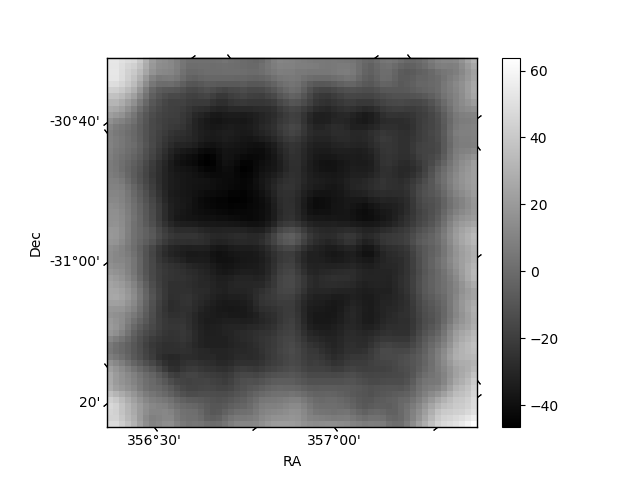
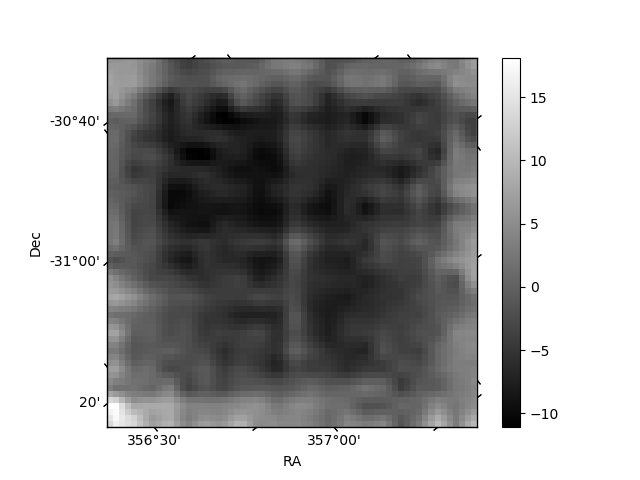
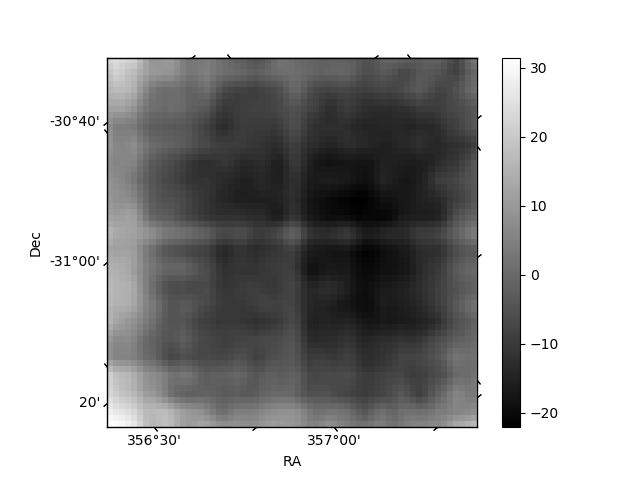
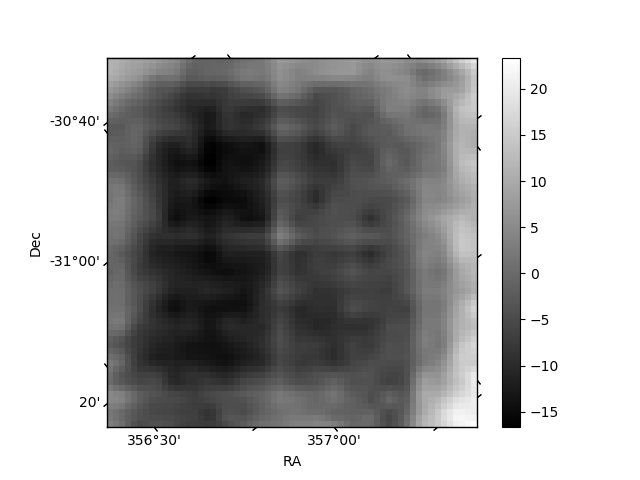
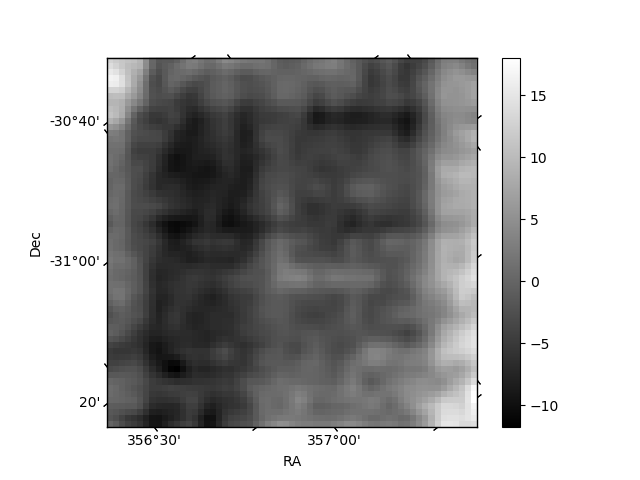
Histogram calculated using DETX and DETY for each event in the final _common_clean file
| Quadrant A | 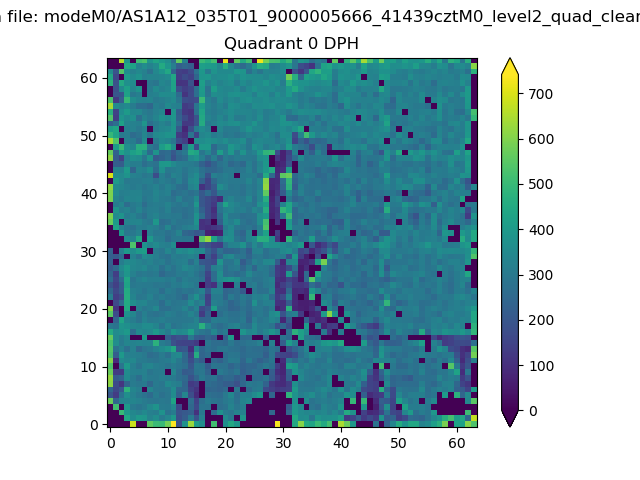 |
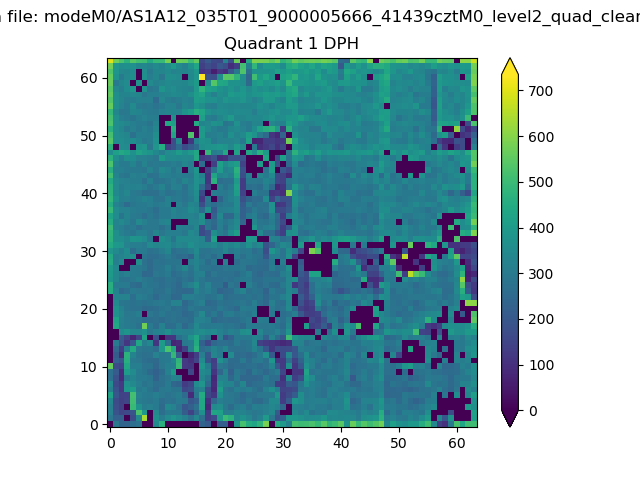 |
Quadrant B |
|---|---|---|---|
| Quadrant D | 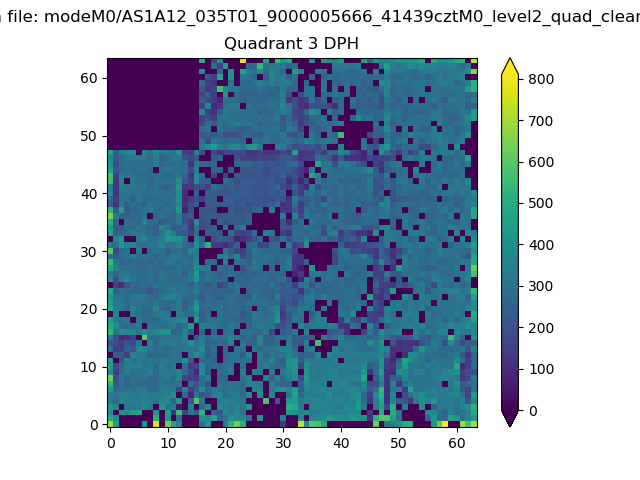 |
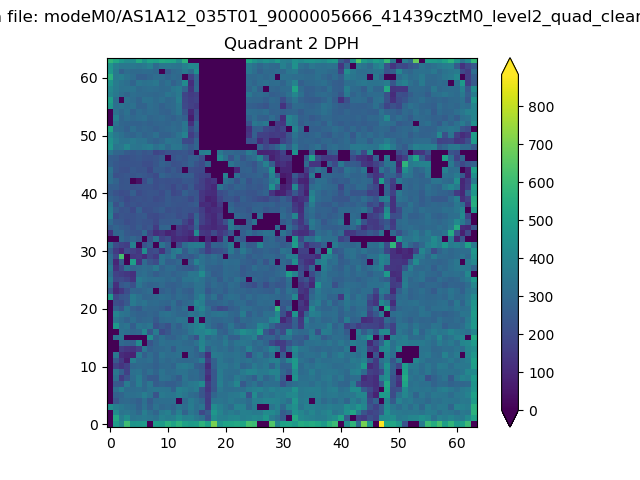 |
Quadrant C |
| Plot type | Count rate plots | Images |
|---|---|---|
| Comparison with Poisson distribution Blue bars denote a histogram of data divided into 1 sec bins. Red curve is a Poisson curve with rate = median count rate of data. |
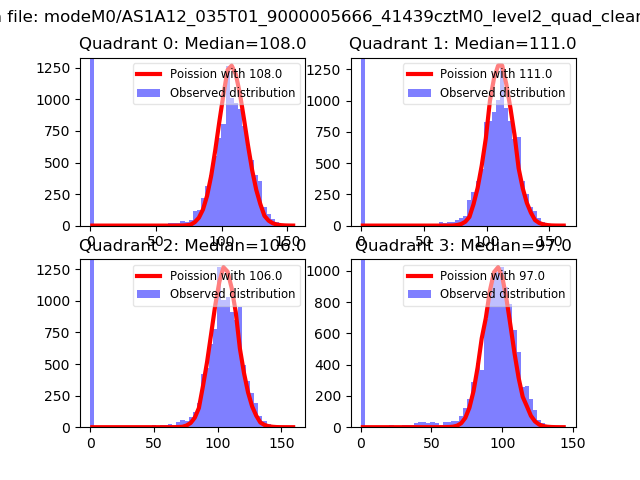 |
 |
| Quadrant-wise count rates Data is divided into 100 sec bins |
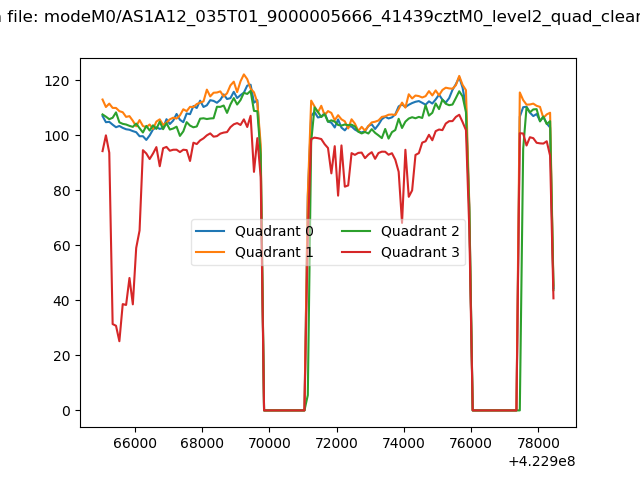 |
|
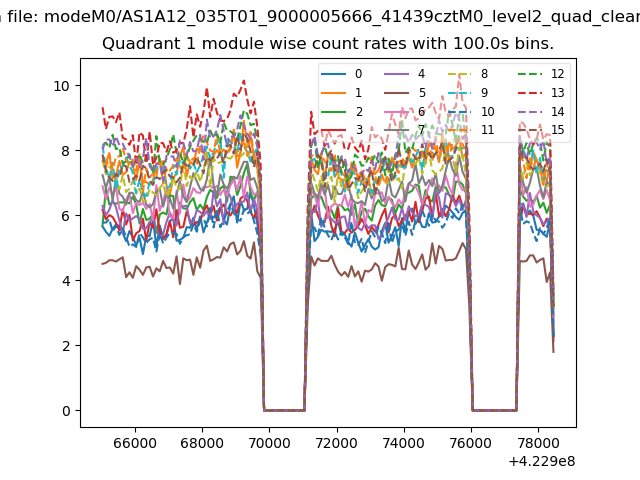
| Module-wise count rates for Quadrant A Data is divided into 100 sec bins |
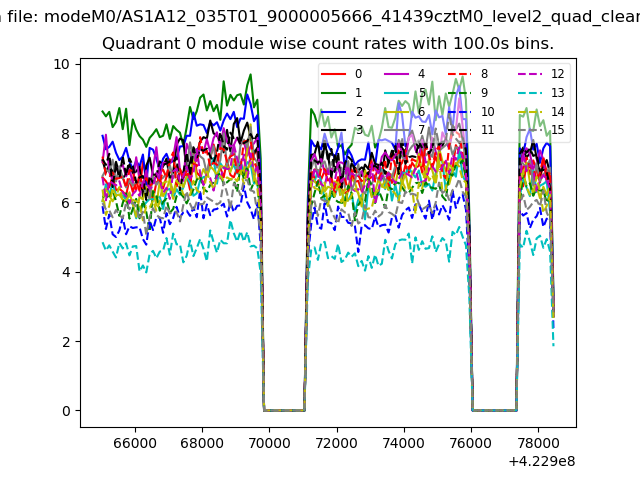 |
 |
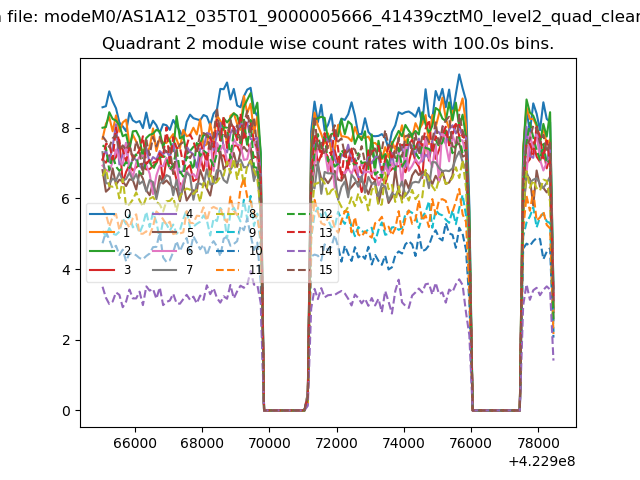
| Module-wise count rates for Quadrant B Data is divided into 100 sec bins |
 |
 |
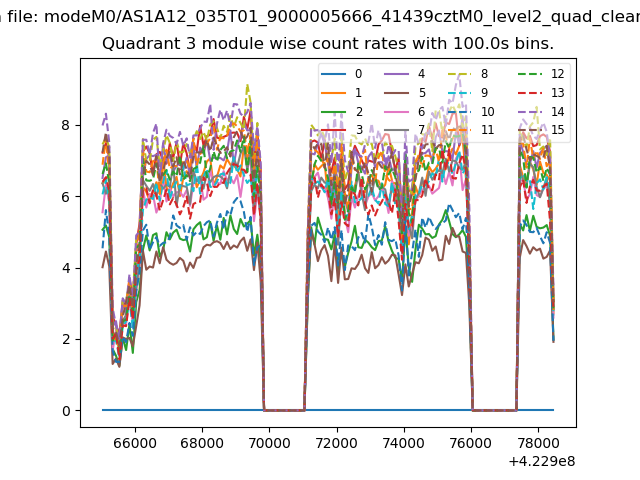
| Module-wise count rates for Quadrant C Data is divided into 100 sec bins |
 |
 |
| Module-wise count rates for Quadrant D Data is divided into 100 sec bins |
 |
 |
| Parameter | Plot |
|---|---|
| CZT HV Monitor | 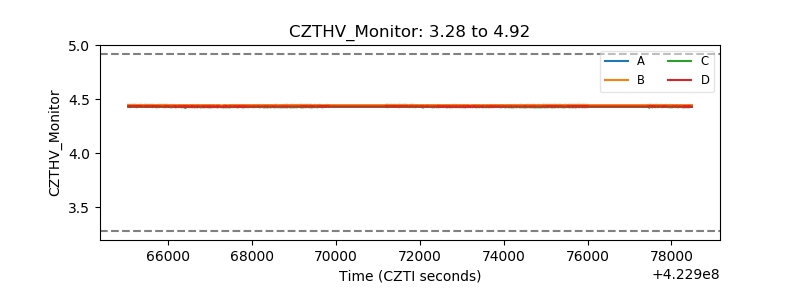 |
| D_VDD | 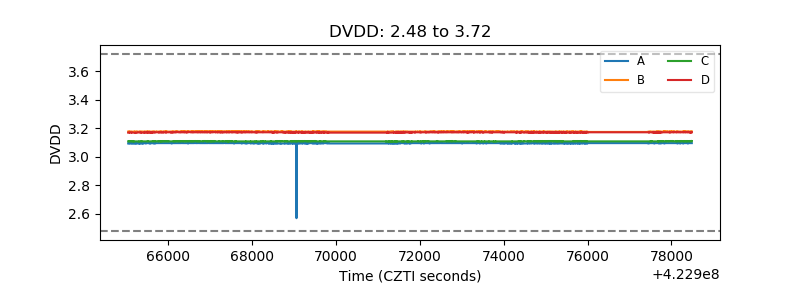 |
| Temperature 1 | 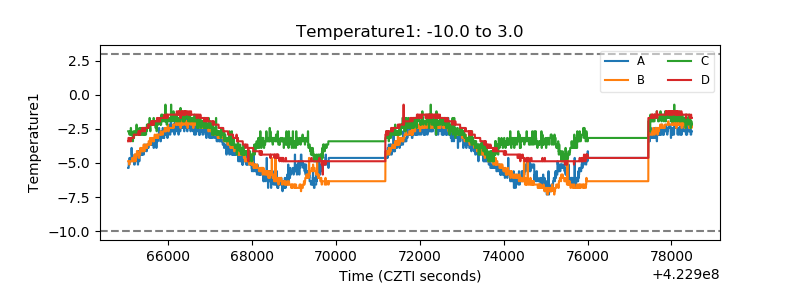 |
| Veto HV Monitor | 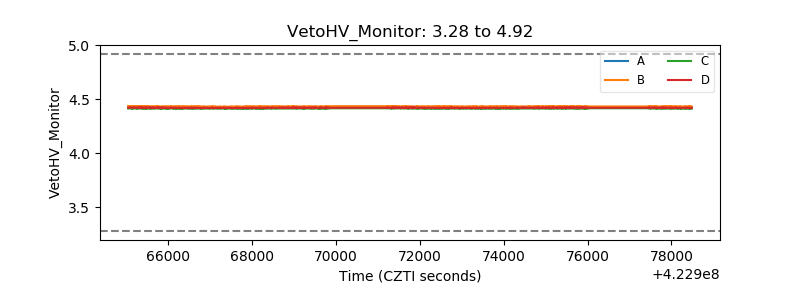 |
| Veto LLD | 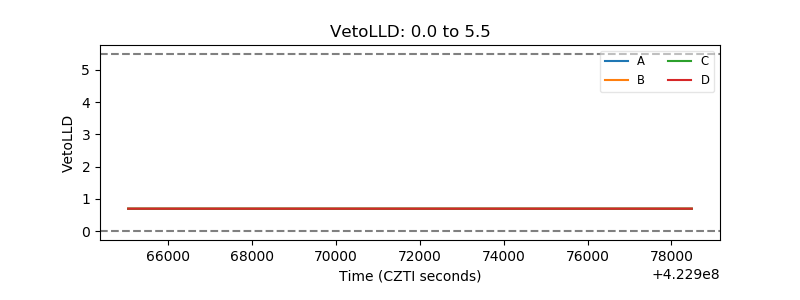 |
| Alpha Counter | 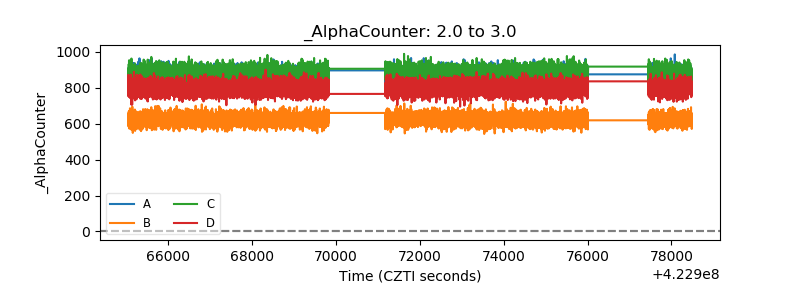 |
| _CPM_Rate | 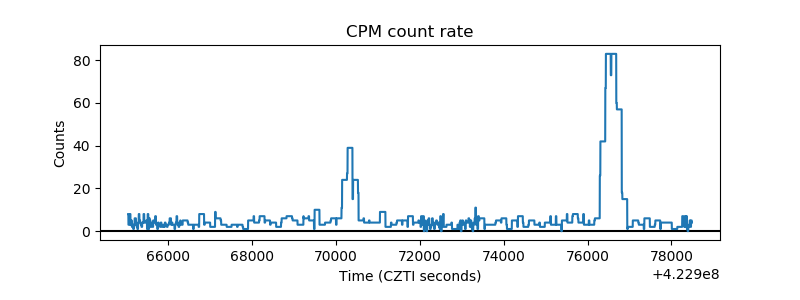 |
| CZT Counter | 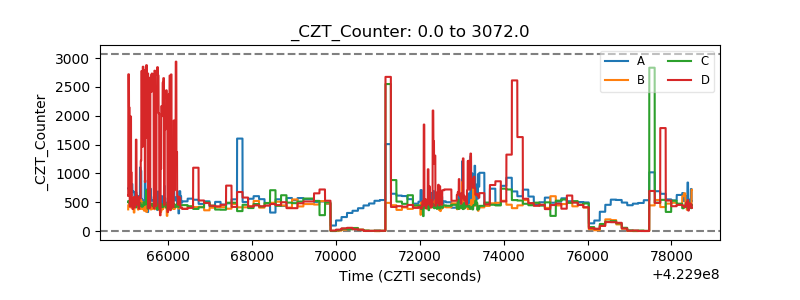 |
| +2.5 Volts monitor | 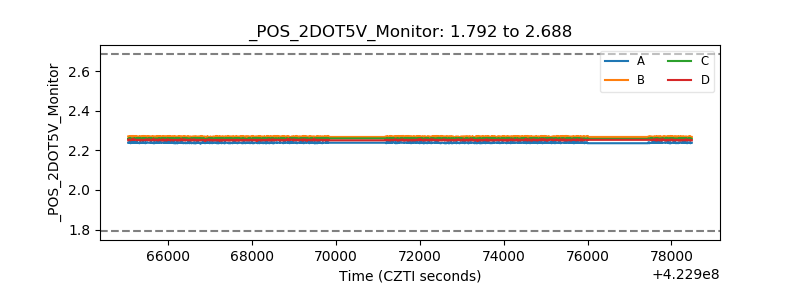 |
| +5 Volts monitor | 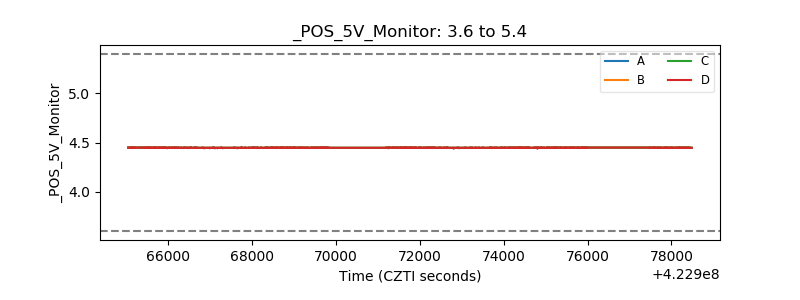 |
| _ROLL_ROT | 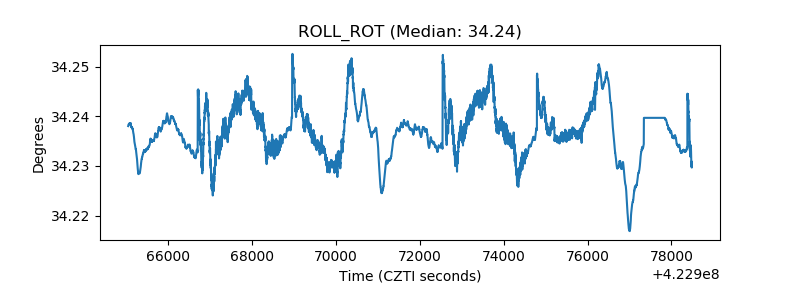 |
| _Roll_DEC | 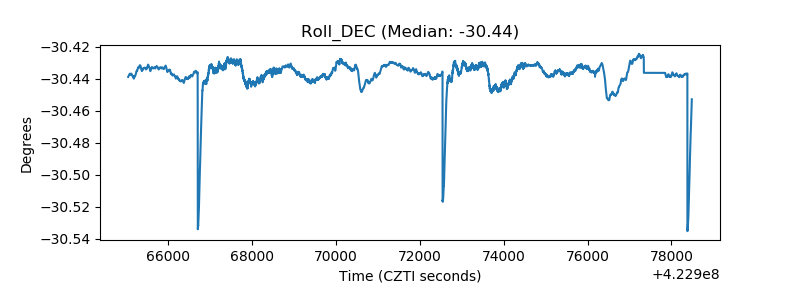 |
| _Roll_RA | 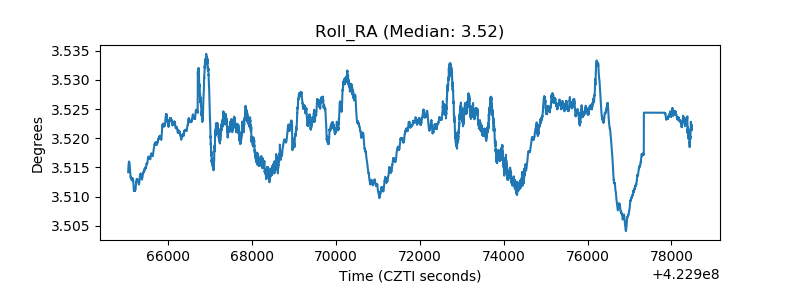 |
| Veto Counter | 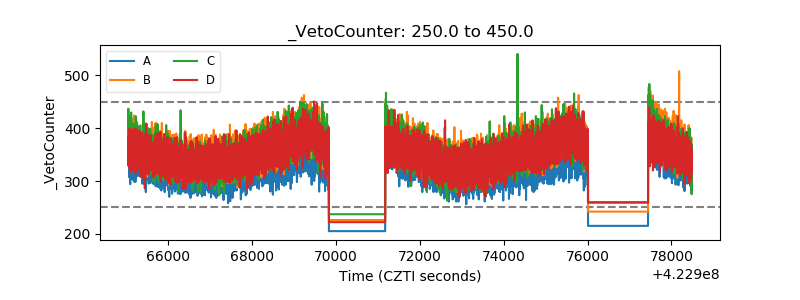 |