| Param | Original file | Final file |
|---|---|---|
| Filename | modeM0/AS1A12_035T01_9000005666_41440cztM0_level2.fits | modeM0/AS1A12_035T01_9000005666_41440cztM0_level2_quad_clean.evt |
| Size (bytes) | 243,063,360 | 68,584,320 |
| Size | 231.8 MB | 65.4 MB |
| Events in quadrant A | 2,490,468 | 459,638 |
| Events in quadrant B | 1,936,650 | 468,118 |
| Events in quadrant C | 2,241,638 | 434,055 |
| Events in quadrant D | 1,995,909 | 415,628 |
| Mode M0 | |||
|---|---|---|---|
| Quadrant | BADHDUFLAG | Total packets | Discarded packets |
| A | 0 | 10010 | 1 |
| B | 0 | 8622 | 1 |
| C | 0 | 9338 | 1 |
| D | 0 | 9027 | 1 |
| Mode SS | |||
|---|---|---|---|
| Quadrant | BADHDUFLAG | Total packets | Discarded packets |
| A | 0 | 84 | 0 |
| B | 0 | 84 | 0 |
| C | 0 | 84 | 0 |
| D | 0 | 84 | 0 |
| Mode M9 | |||
|---|---|---|---|
| Quadrant | BADHDUFLAG | Total packets | Discarded packets |
| A | 0 | 11 | 0 |
| B | 0 | 11 | 0 |
| C | 0 | 11 | 0 |
| D | 0 | 12 | 0 |
| Quadrant | Total seconds | Saturated seconds | Saturation percentage |
|---|---|---|---|
| A | 4255 | 5 | 0.117509% |
| B | 4255 | 4 | 0.094007% |
| C | 4255 | 117 | 2.749706% |
| D | 4255 | 24 | 0.564042% |
Noise dominated data is calculated using 1-second bins in cleaned event files. If a bin has >2000 counts, and if more than 50% of those come from <1% of pixels, then it is considered to be noise-dominated and hence unusable.
| Quadrant | # 1 sec bins | Bins with >0 counts | Bins with >2000 counts | High rate bins dominated by noise | Noise dominated (total time) | Noise dominated (detector-on time) | Marked lightcurve |
|---|---|---|---|---|---|---|---|
| A | 4255 | 4255 | 5 | 5 | 0.12% | 0.12% | 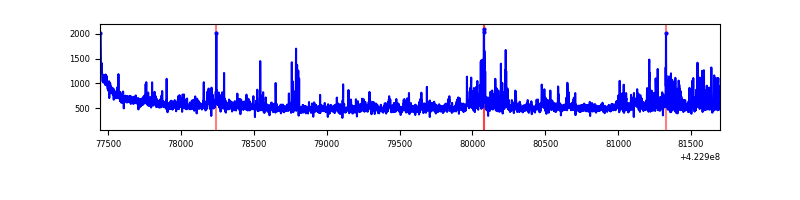 |
| B | 4255 | 4255 | 1 | 1 | 0.02% | 0.02% | 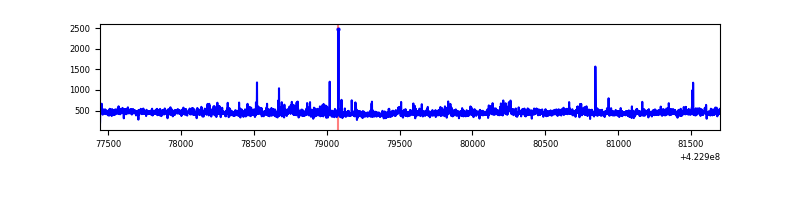 |
| C | 4255 | 4255 | 115 | 115 | 2.70% | 2.70% | 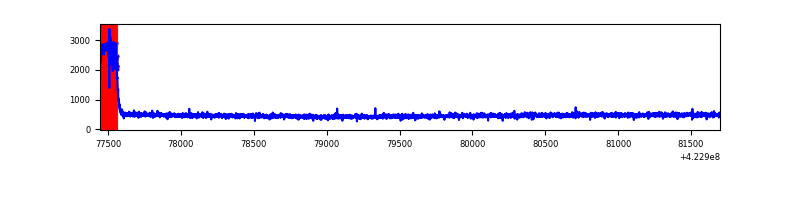 |
| D | 4255 | 4255 | 18 | 18 | 0.42% | 0.42% | 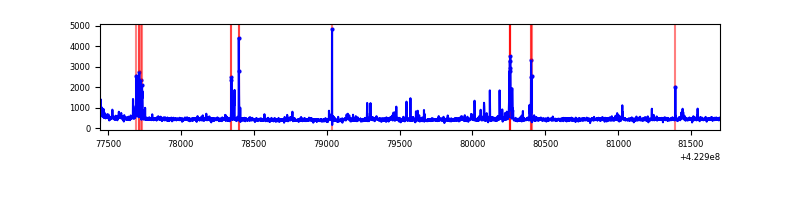 |
Top three noisy pixels from each quadrant. If the there are fewer than three noisy pixels in the level2.evt file, extra rows are filled as -1
| Pixel properties | Quadrant properties | ||||||
|---|---|---|---|---|---|---|---|
| Quadrant | DetID | PixID | Counts | Sigma | Mean | Median | Sigma |
| A | 10 | 83 | 373578 | 3813.94 | 468 | 457 | 97.8 |
| A | 2 | 79 | 285506 | 2913.69 | 468 | 457 | 97.8 |
| A | 13 | 248 | 10174 | 99.32 | 468 | 457 | 97.8 |
| B | 0 | 190 | 76437 | 825.01 | 465 | 451 | 92.1 |
| B | 0 | 155 | 22774 | 242.37 | 465 | 451 | 92.1 |
| B | 12 | 111 | 11399 | 118.87 | 465 | 451 | 92.1 |
| C | 0 | 10 | 311650 | 2956.2 | 448 | 449 | 105.3 |
| C | 15 | 214 | 173283 | 1641.81 | 448 | 449 | 105.3 |
| C | 9 | 54 | 8078 | 72.47 | 448 | 449 | 105.3 |
| D | 13 | 249 | 136985 | 1204.69 | 457 | 443 | 113.3 |
| D | 5 | 222 | 29163 | 253.39 | 457 | 443 | 113.3 |
| D | 2 | 249 | 26468 | 229.61 | 457 | 443 | 113.3 |
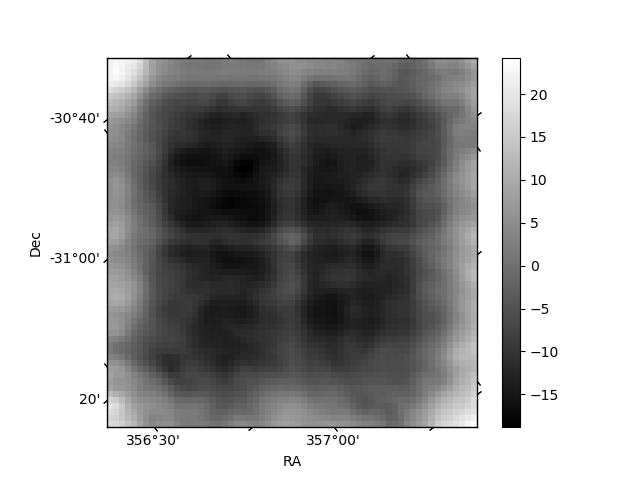
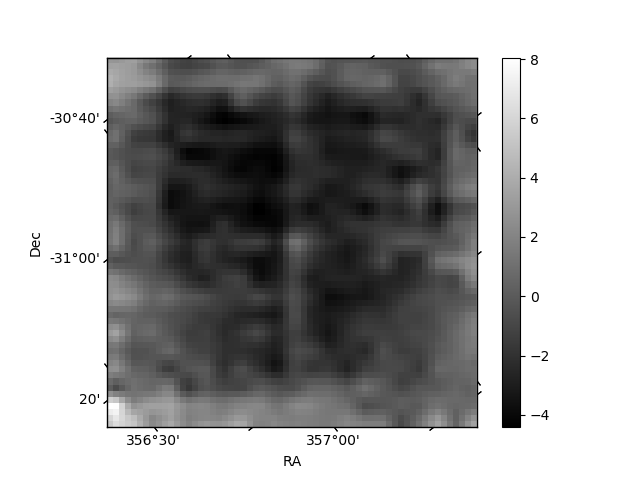
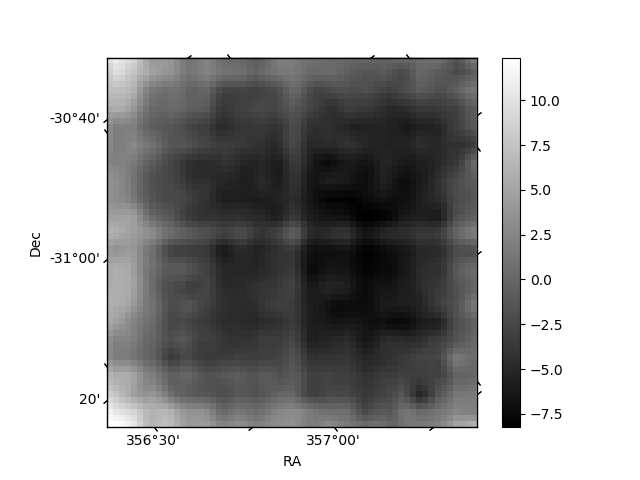
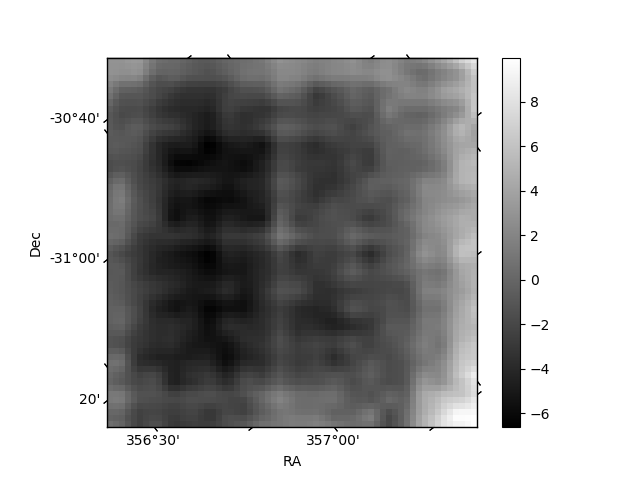
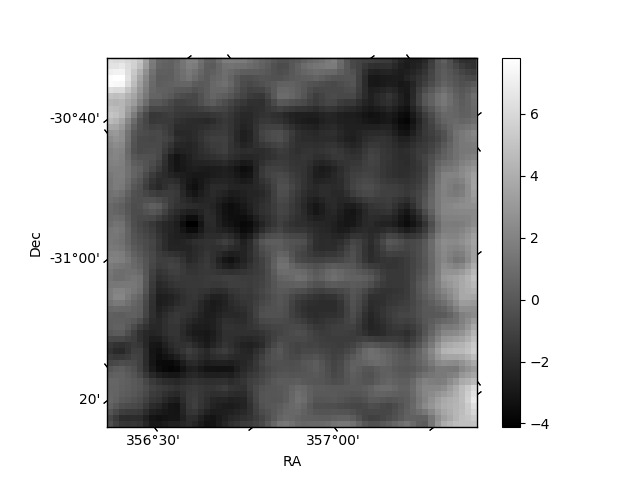
Histogram calculated using DETX and DETY for each event in the final _common_clean file
| Quadrant A | 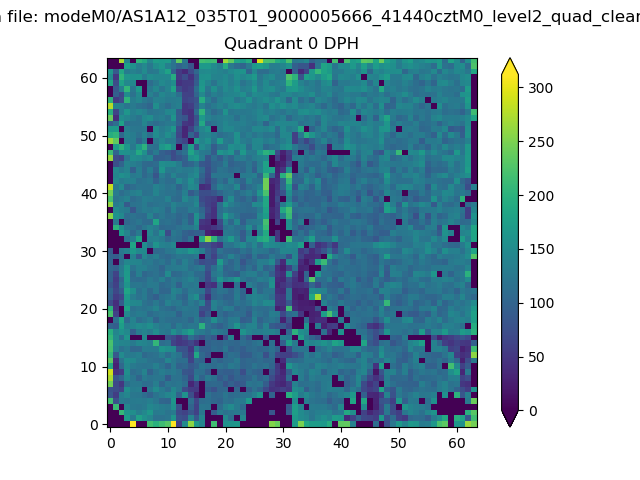 |
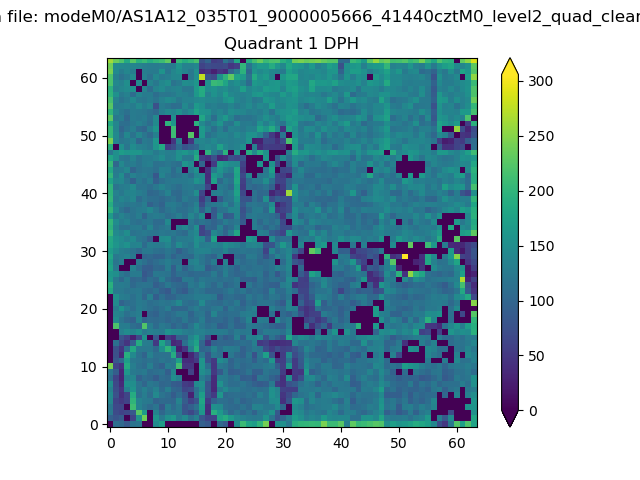 |
Quadrant B |
|---|---|---|---|
| Quadrant D | 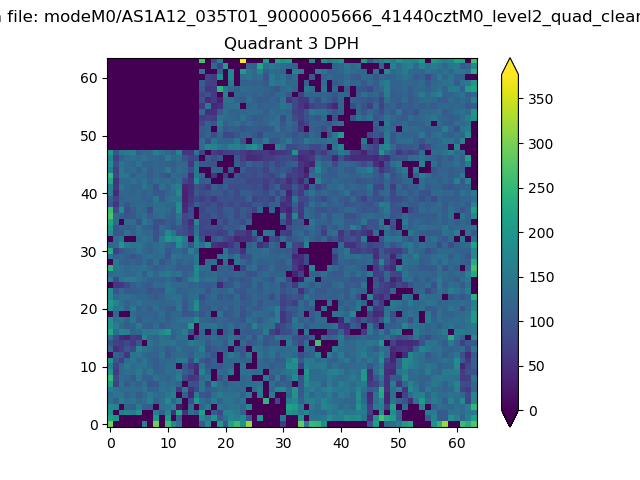 |
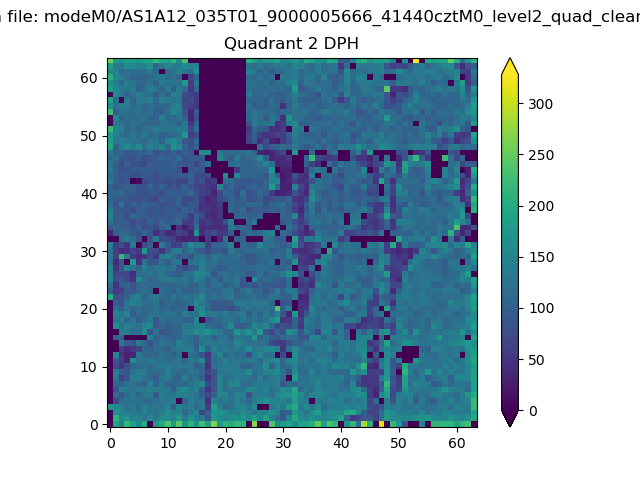 |
Quadrant C |
| Plot type | Count rate plots | Images |
|---|---|---|
| Comparison with Poisson distribution Blue bars denote a histogram of data divided into 1 sec bins. Red curve is a Poisson curve with rate = median count rate of data. |
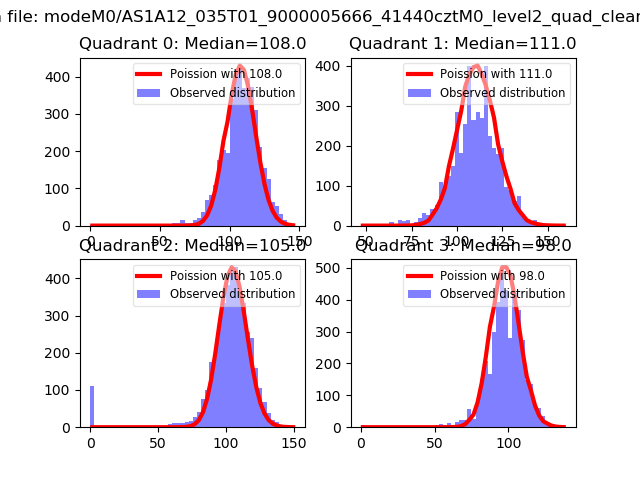 |
 |
| Quadrant-wise count rates Data is divided into 100 sec bins |
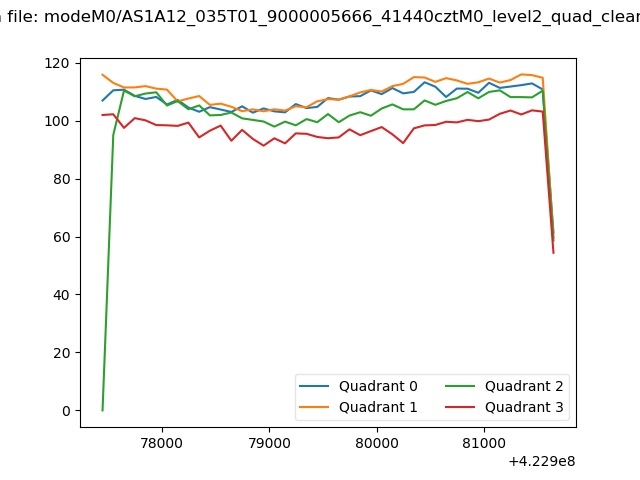 |
|
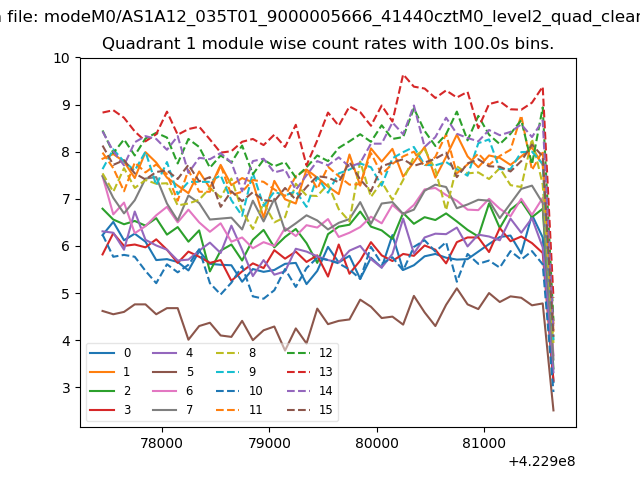
| Module-wise count rates for Quadrant A Data is divided into 100 sec bins |
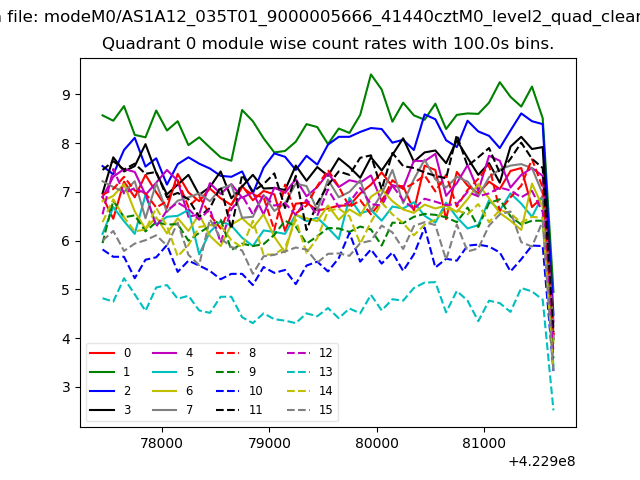 |
 |
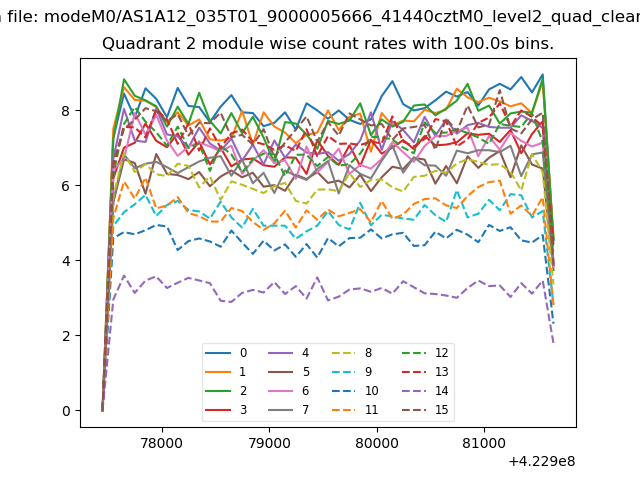
| Module-wise count rates for Quadrant B Data is divided into 100 sec bins |
 |
 |
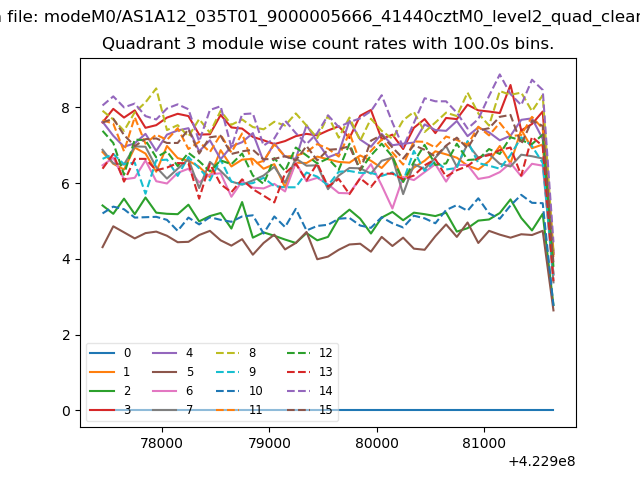
| Module-wise count rates for Quadrant C Data is divided into 100 sec bins |
 |
 |
| Module-wise count rates for Quadrant D Data is divided into 100 sec bins |
 |
 |
| Parameter | Plot |
|---|---|
| CZT HV Monitor | 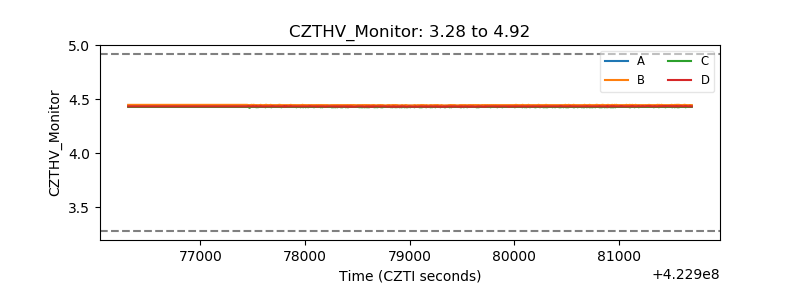 |
| D_VDD | 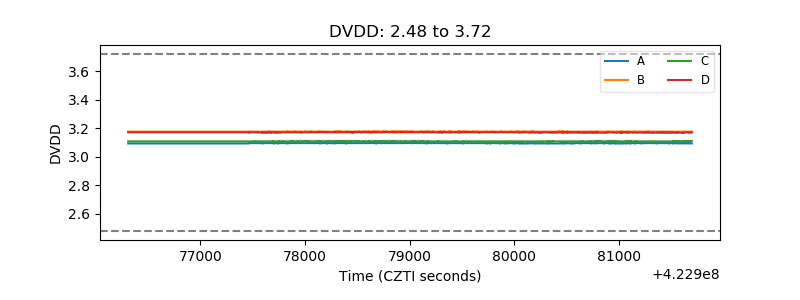 |
| Temperature 1 | 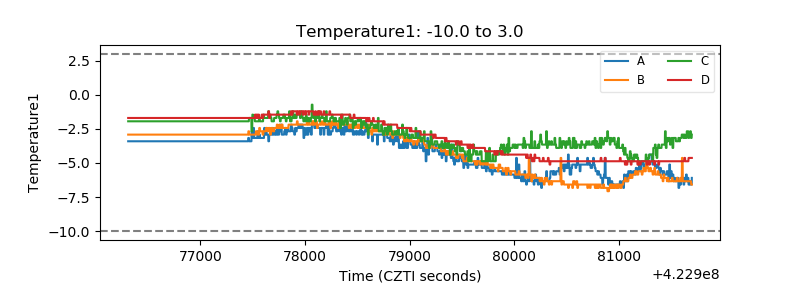 |
| Veto HV Monitor | 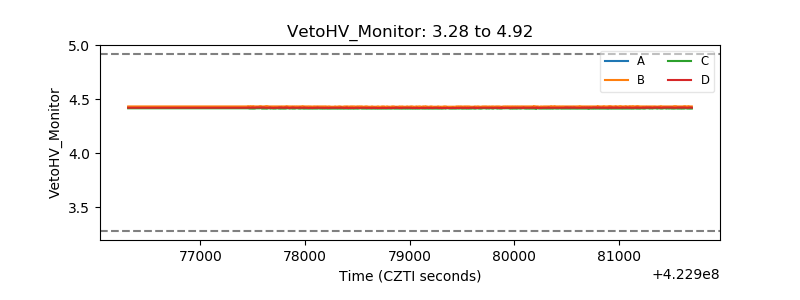 |
| Veto LLD | 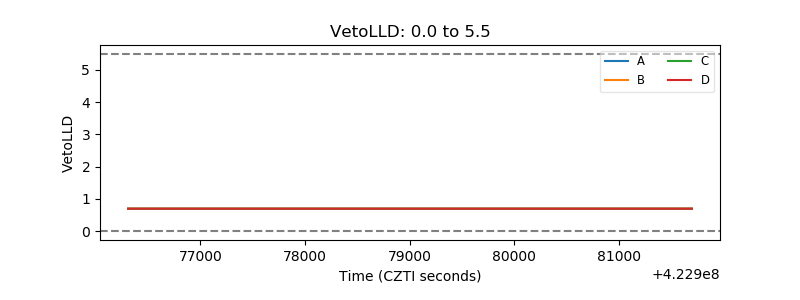 |
| Alpha Counter | 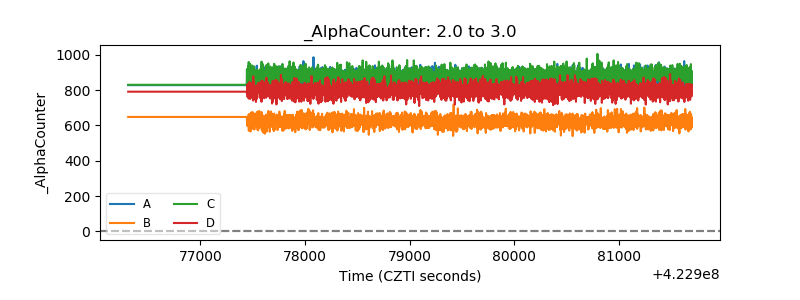 |
| _CPM_Rate | 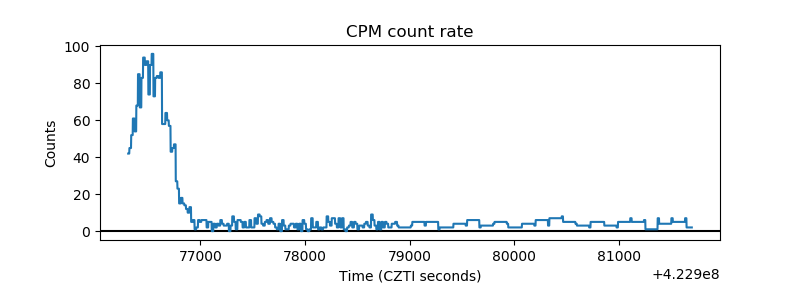 |
| CZT Counter | 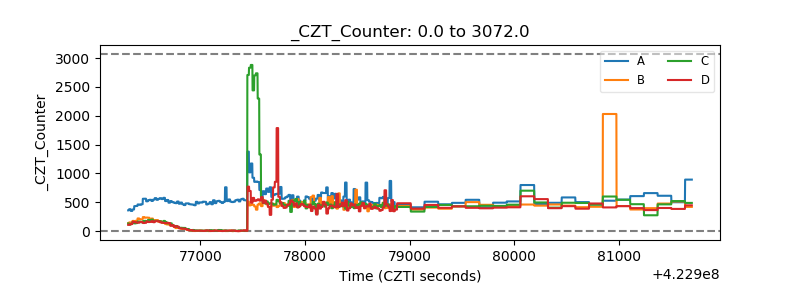 |
| +2.5 Volts monitor | 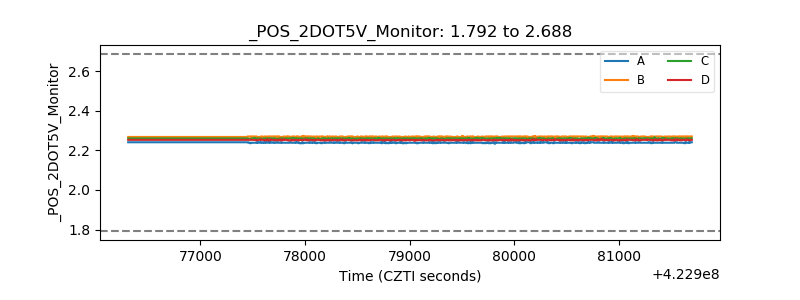 |
| +5 Volts monitor | 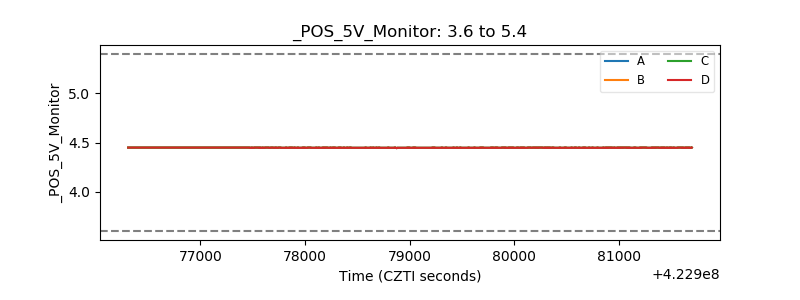 |
| _ROLL_ROT | 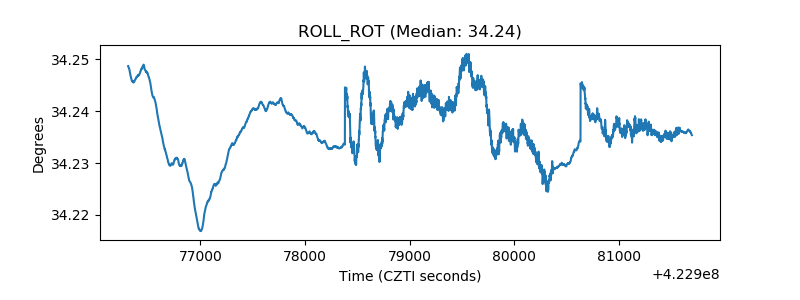 |
| _Roll_DEC | 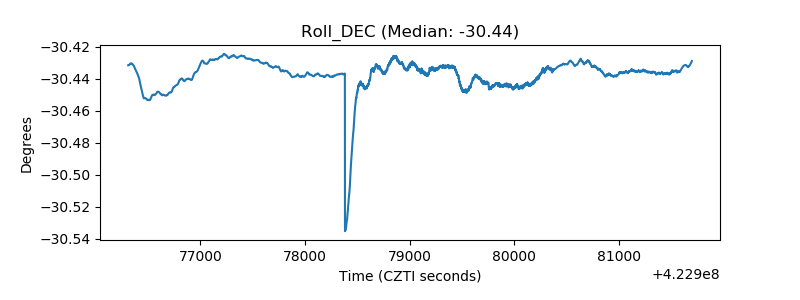 |
| _Roll_RA | 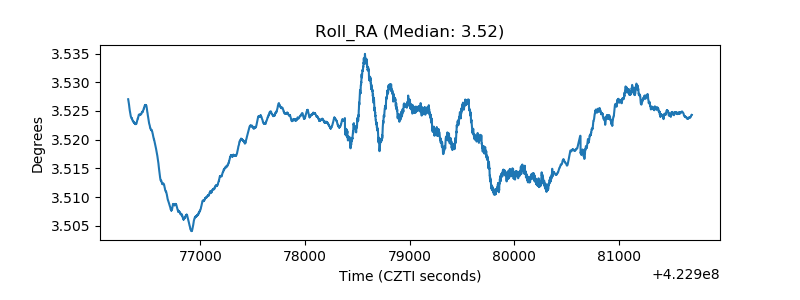 |
| Veto Counter | 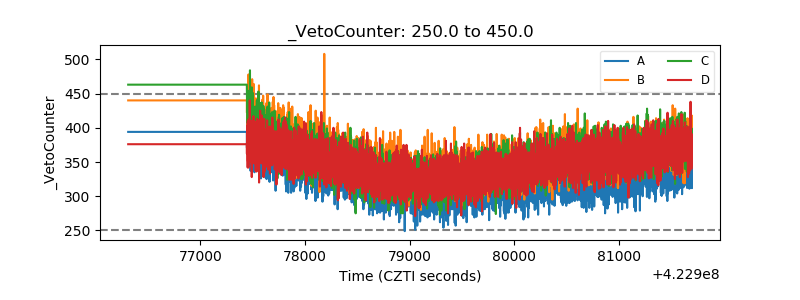 |