| Param | Original file | Final file |
|---|---|---|
| Filename | modeM0/AS1T05_108T01_9000005664_41396cztM0_level2.fits | modeM0/AS1T05_108T01_9000005664_41396cztM0_level2_quad_clean.evt |
| Size (bytes) | 713,764,800 | 179,804,160 |
| Size | 680.7 MB | 171.5 MB |
| Events in quadrant A | 5,830,224 | 1,211,401 |
| Events in quadrant B | 5,254,256 | 1,235,614 |
| Events in quadrant C | 6,691,898 | 1,156,699 |
| Events in quadrant D | 7,777,722 | 1,066,104 |
| Mode M0 | |||
|---|---|---|---|
| Quadrant | BADHDUFLAG | Total packets | Discarded packets |
| A | 0 | 24313 | 4 |
| B | 0 | 23362 | 3 |
| C | 0 | 27163 | 3 |
| D | 0 | 30668 | 3 |
| Mode M9 | |||
|---|---|---|---|
| Quadrant | BADHDUFLAG | Total packets | Discarded packets |
| A | 0 | 42 | 0 |
| B | 0 | 42 | 0 |
| C | 0 | 42 | 0 |
| D | 0 | 42 | 0 |
| Mode SS | |||
|---|---|---|---|
| Quadrant | BADHDUFLAG | Total packets | Discarded packets |
| A | 0 | 230 | 0 |
| B | 0 | 230 | 0 |
| C | 0 | 230 | 0 |
| D | 0 | 230 | 0 |
| Quadrant | Total seconds | Saturated seconds | Saturation percentage |
|---|---|---|---|
| A | 11184 | 27 | 0.241416% |
| B | 11184 | 40 | 0.357654% |
| C | 11184 | 324 | 2.896996% |
| D | 11184 | 509 | 4.551144% |
Noise dominated data is calculated using 1-second bins in cleaned event files. If a bin has >2000 counts, and if more than 50% of those come from <1% of pixels, then it is considered to be noise-dominated and hence unusable.
| Quadrant | # 1 sec bins | Bins with >0 counts | Bins with >2000 counts | High rate bins dominated by noise | Noise dominated (total time) | Noise dominated (detector-on time) | Marked lightcurve |
|---|---|---|---|---|---|---|---|
| A | 15420 | 11187 | 4 | 4 | 0.03% | 0.04% | 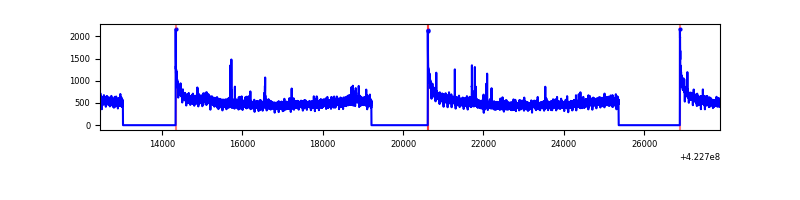 |
| B | 15420 | 11187 | 22 | 22 | 0.14% | 0.20% | 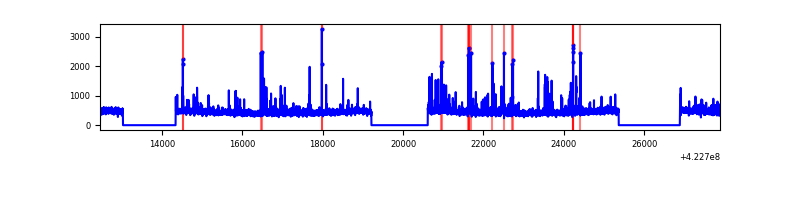 |
| C | 15420 | 11187 | 293 | 293 | 1.90% | 2.62% | 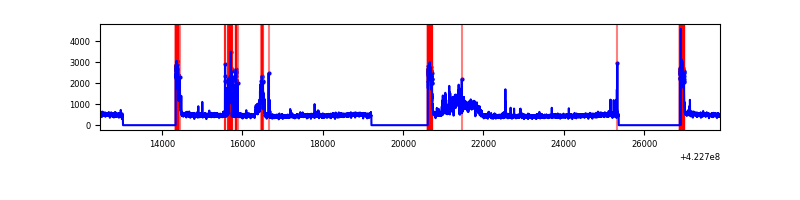 |
| D | 15420 | 11187 | 425 | 425 | 2.76% | 3.80% | 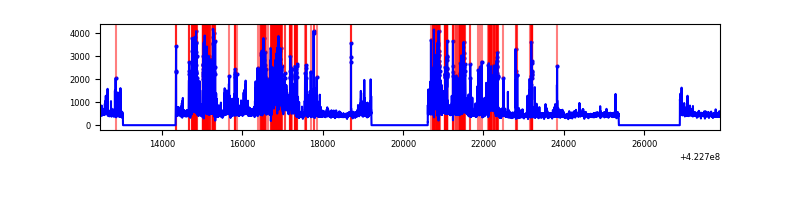 |
Top three noisy pixels from each quadrant. If the there are fewer than three noisy pixels in the level2.evt file, extra rows are filled as -1
| Pixel properties | Quadrant properties | ||||||
|---|---|---|---|---|---|---|---|
| Quadrant | DetID | PixID | Counts | Sigma | Mean | Median | Sigma |
| A | 10 | 83 | 988602 | 3965.16 | 1217 | 1190 | 249.0 |
| A | 2 | 79 | 68125 | 268.79 | 1217 | 1190 | 249.0 |
| A | 13 | 248 | 28786 | 110.82 | 1217 | 1190 | 249.0 |
| B | 5 | 255 | 287030 | 1230.59 | 1207 | 1173 | 232.3 |
| B | 0 | 190 | 169485 | 724.57 | 1207 | 1173 | 232.3 |
| B | 0 | 229 | 39550 | 165.21 | 1207 | 1173 | 232.3 |
| C | 9 | 54 | 845119 | 3086.87 | 1172 | 1176 | 273.4 |
| C | 0 | 10 | 723416 | 2641.72 | 1172 | 1176 | 273.4 |
| C | 15 | 214 | 464869 | 1696.04 | 1172 | 1176 | 273.4 |
| D | 13 | 249 | 911741 | 3199.08 | 1168 | 1132 | 284.6 |
| D | 5 | 222 | 617621 | 2165.8 | 1168 | 1132 | 284.6 |
| D | 2 | 249 | 562468 | 1972.04 | 1168 | 1132 | 284.6 |
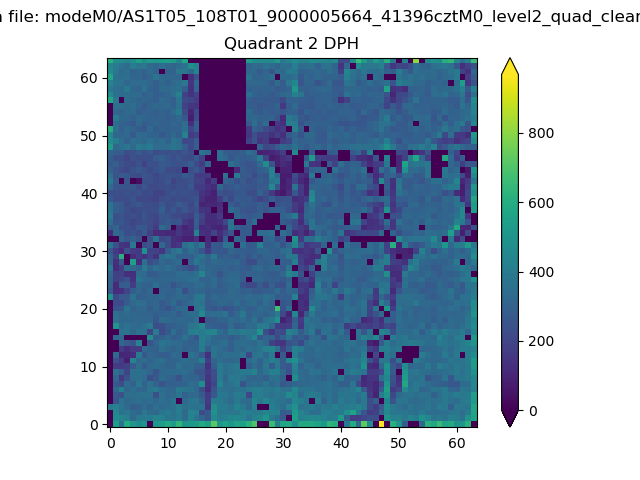
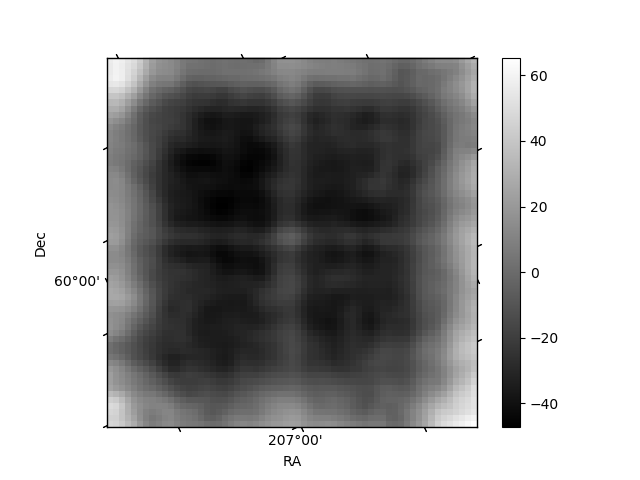
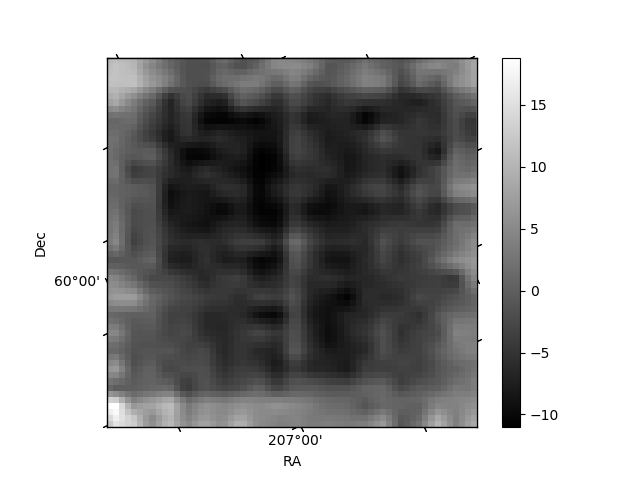
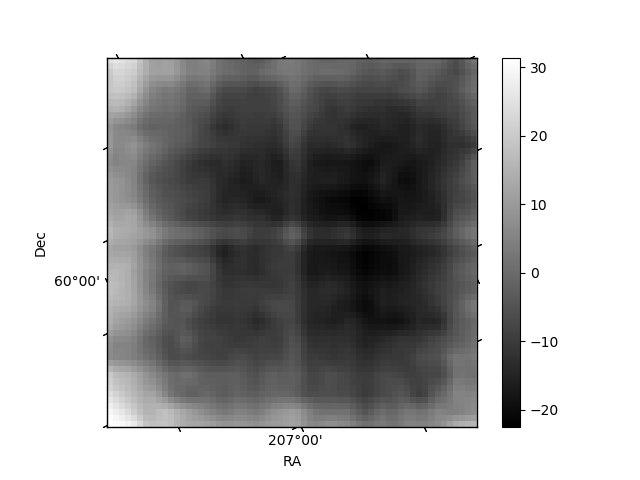
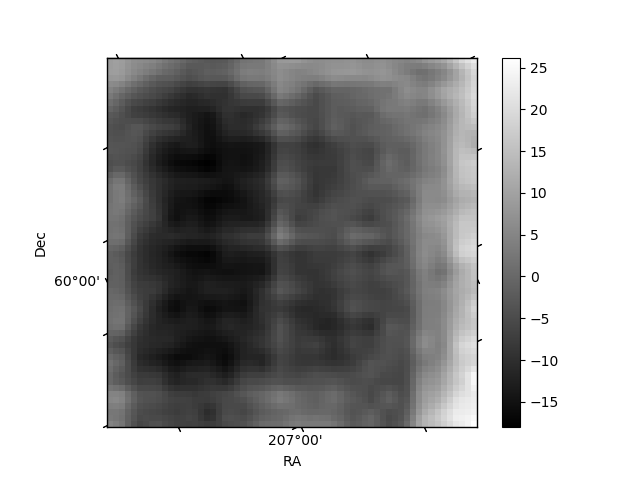
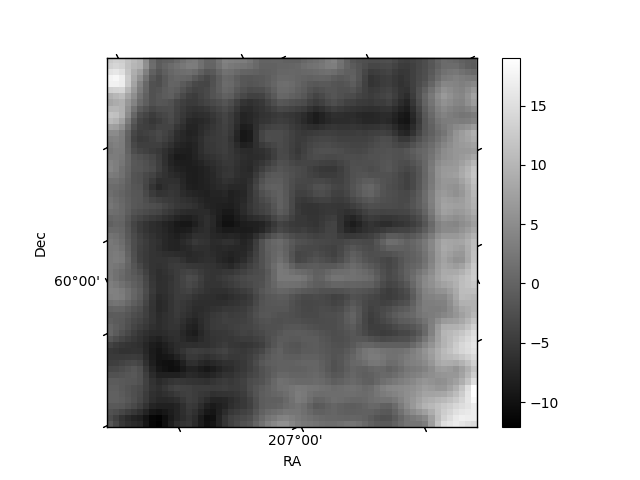
Histogram calculated using DETX and DETY for each event in the final _common_clean file
| Quadrant A | 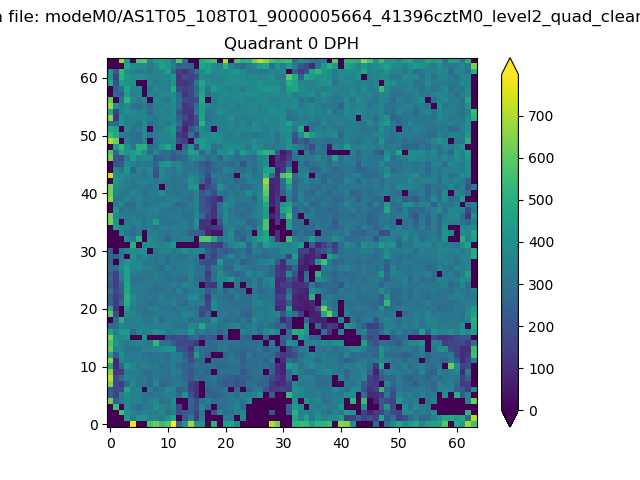 |
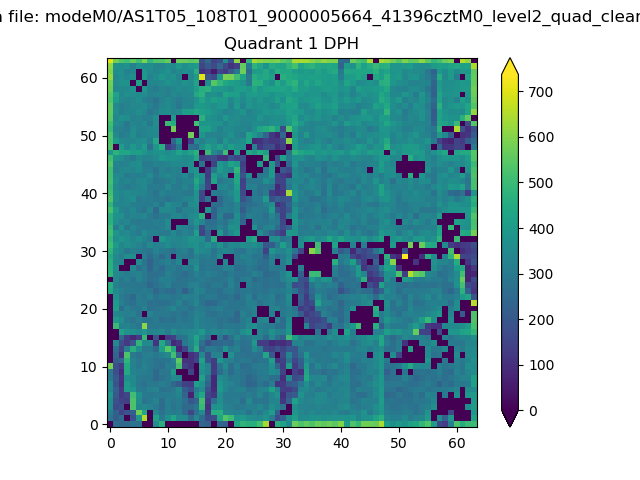 |
Quadrant B |
|---|---|---|---|
| Quadrant D | 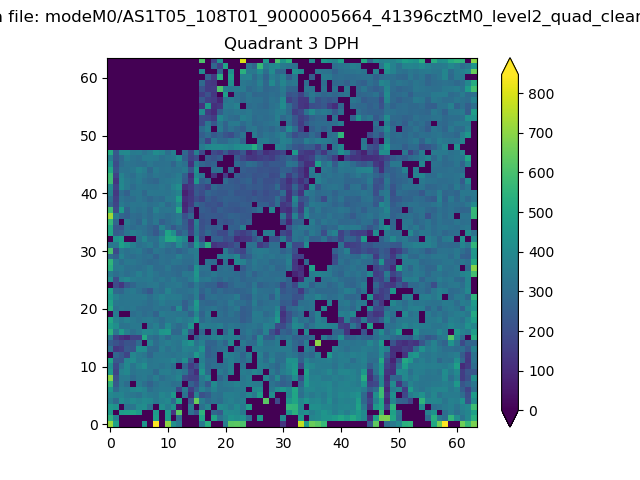 |
 |
Quadrant C |
| Plot type | Count rate plots | Images |
|---|---|---|
| Comparison with Poisson distribution Blue bars denote a histogram of data divided into 1 sec bins. Red curve is a Poisson curve with rate = median count rate of data. |
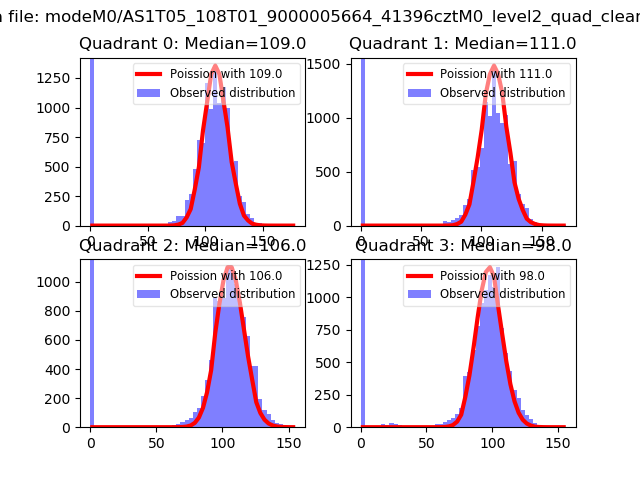 |
 |
| Quadrant-wise count rates Data is divided into 100 sec bins |
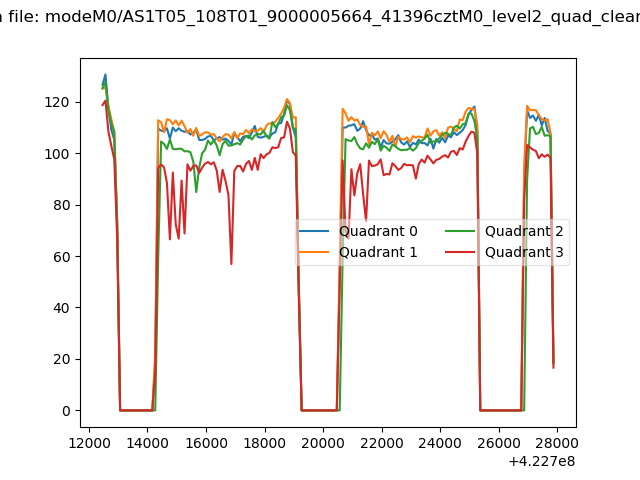 |
|
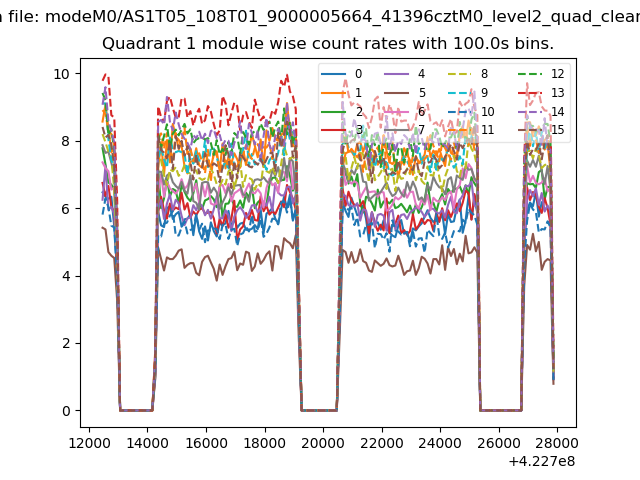
| Module-wise count rates for Quadrant A Data is divided into 100 sec bins |
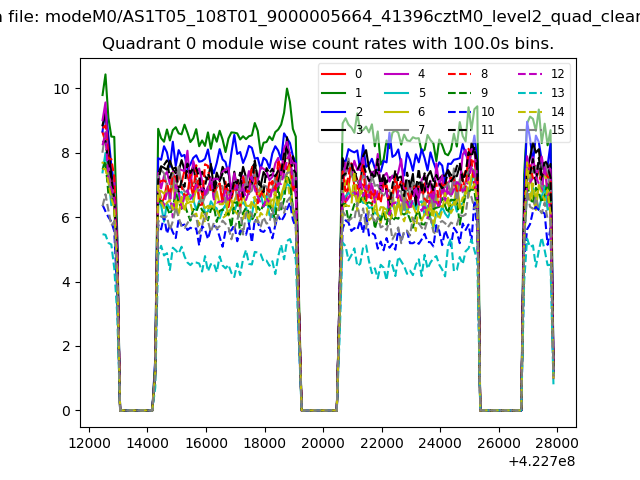 |
 |
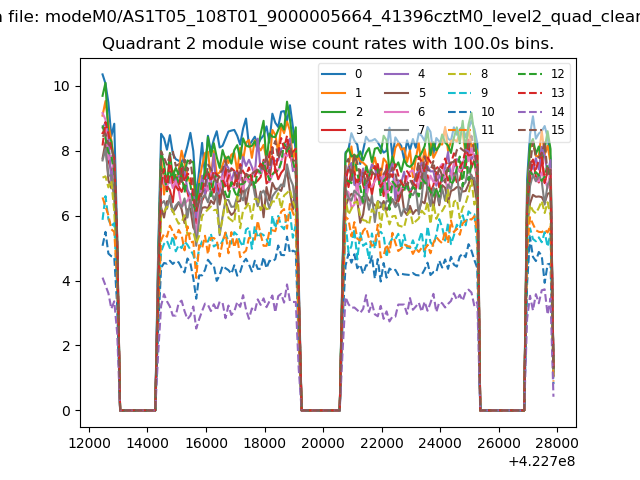
| Module-wise count rates for Quadrant B Data is divided into 100 sec bins |
 |
 |
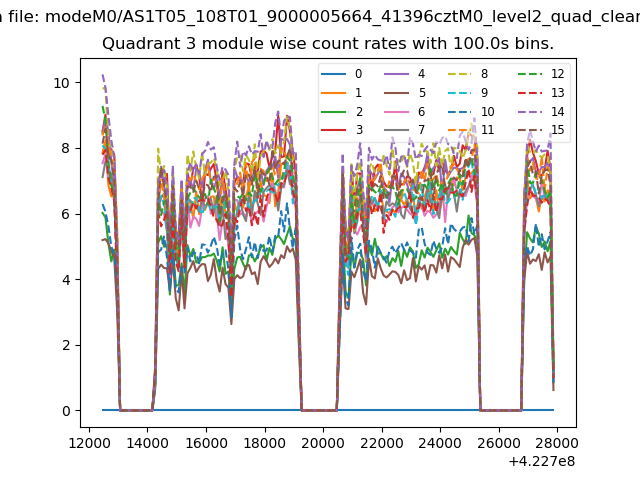
| Module-wise count rates for Quadrant C Data is divided into 100 sec bins |
 |
 |
| Module-wise count rates for Quadrant D Data is divided into 100 sec bins |
 |
 |
| Parameter | Plot |
|---|---|
| CZT HV Monitor | 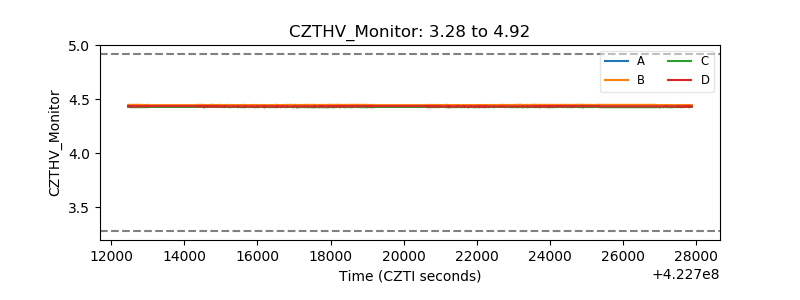 |
| D_VDD | 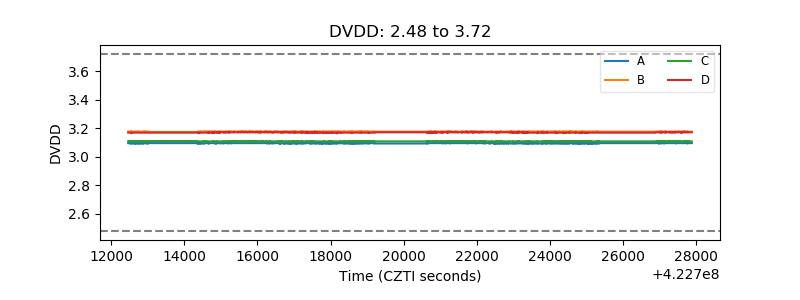 |
| Temperature 1 | 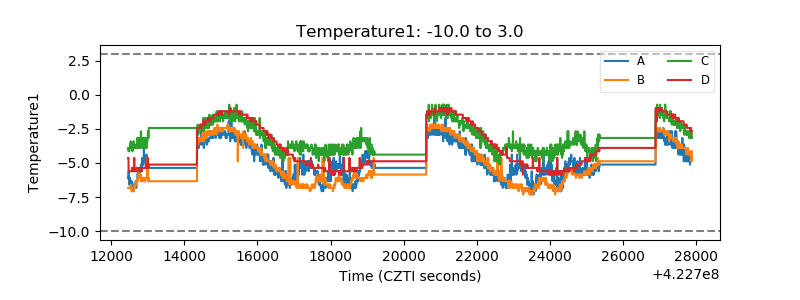 |
| Veto HV Monitor | 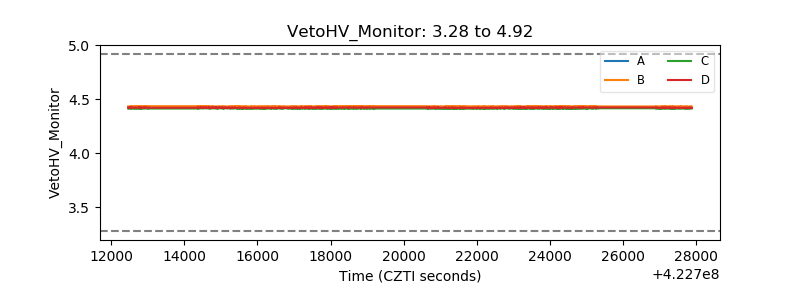 |
| Veto LLD | 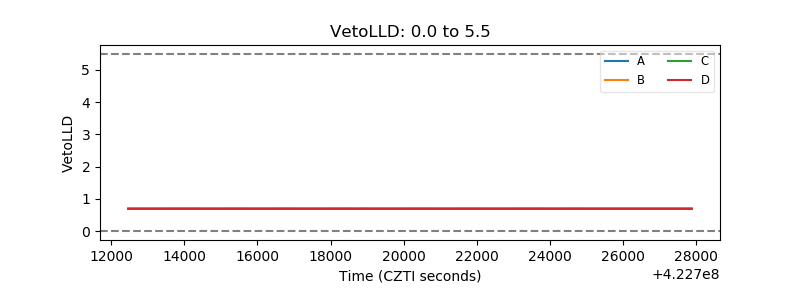 |
| Alpha Counter | 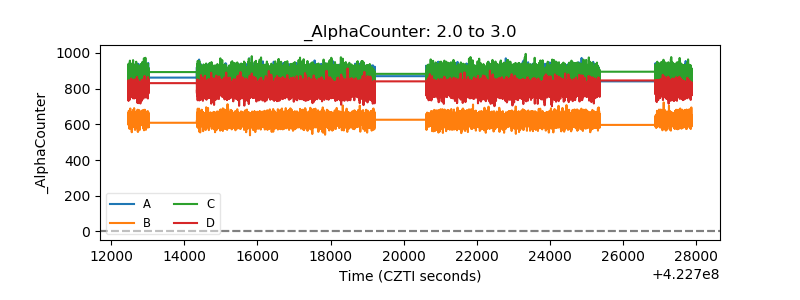 |
| _CPM_Rate | 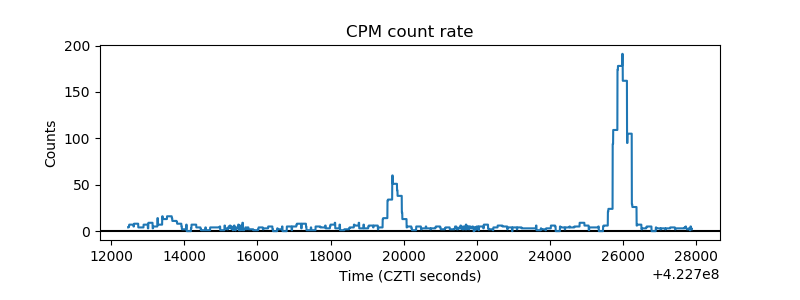 |
| CZT Counter | 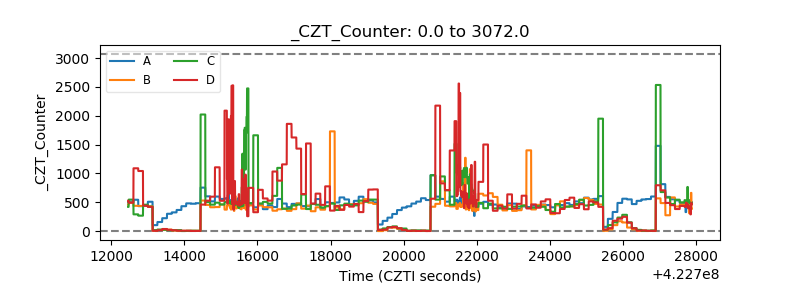 |
| +2.5 Volts monitor | 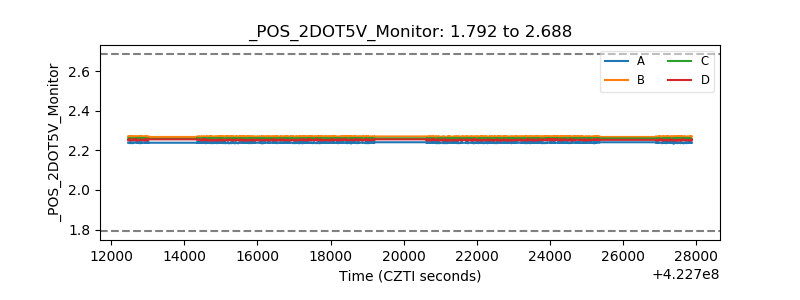 |
| +5 Volts monitor | 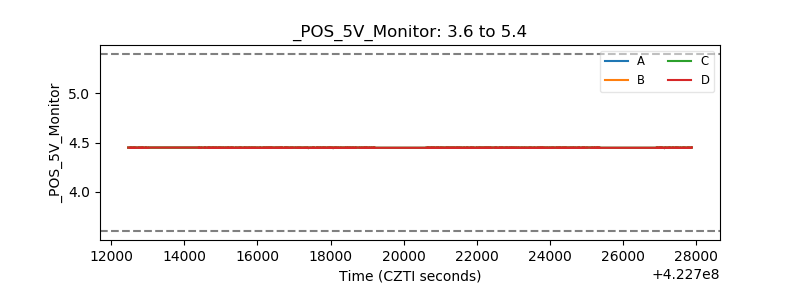 |
| _ROLL_ROT | 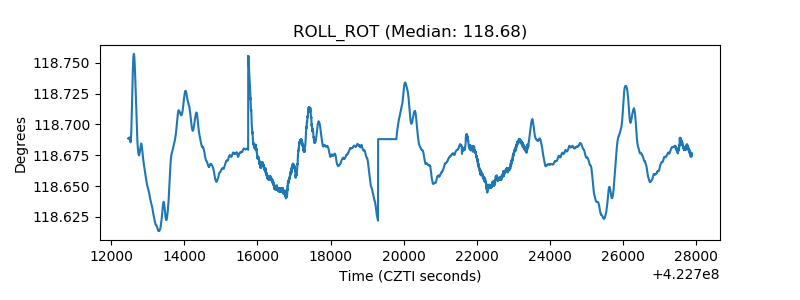 |
| _Roll_DEC | 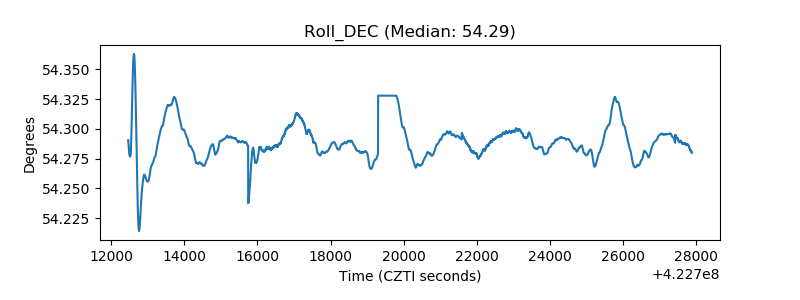 |
| _Roll_RA | 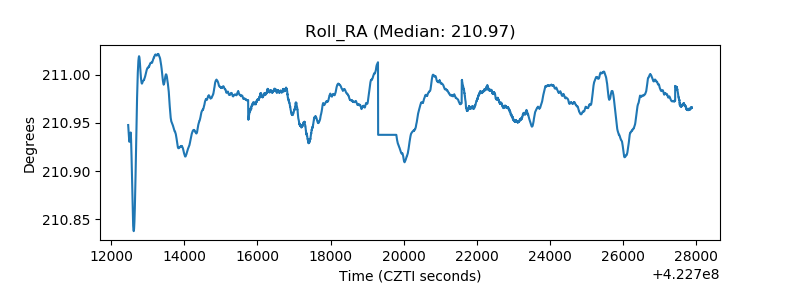 |
| Veto Counter | 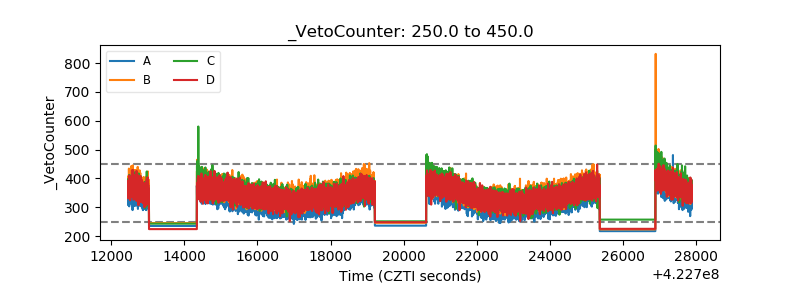 |