| Param | Original file | Final file |
|---|---|---|
| Filename | modeM0/AS1T05_108T01_9000005664_41397cztM0_level2.fits | modeM0/AS1T05_108T01_9000005664_41397cztM0_level2_quad_clean.evt |
| Size (bytes) | 320,676,480 | 90,581,760 |
| Size | 305.8 MB | 86.4 MB |
| Events in quadrant A | 2,959,484 | 605,570 |
| Events in quadrant B | 2,735,299 | 616,699 |
| Events in quadrant C | 3,095,614 | 575,130 |
| Events in quadrant D | 2,644,123 | 554,151 |
| Mode M0 | |||
|---|---|---|---|
| Quadrant | BADHDUFLAG | Total packets | Discarded packets |
| A | 0 | 12401 | 3 |
| B | 0 | 12086 | 2 |
| C | 0 | 12825 | 2 |
| D | 0 | 11818 | 2 |
| Mode M9 | |||
|---|---|---|---|
| Quadrant | BADHDUFLAG | Total packets | Discarded packets |
| A | 0 | 18 | 0 |
| B | 0 | 18 | 0 |
| C | 0 | 18 | 0 |
| D | 0 | 19 | 0 |
| Mode SS | |||
|---|---|---|---|
| Quadrant | BADHDUFLAG | Total packets | Discarded packets |
| A | 0 | 114 | 0 |
| B | 0 | 114 | 0 |
| C | 0 | 114 | 0 |
| D | 0 | 114 | 0 |
| Quadrant | Total seconds | Saturated seconds | Saturation percentage |
|---|---|---|---|
| A | 5591 | 17 | 0.304060% |
| B | 5591 | 60 | 1.073153% |
| C | 5591 | 226 | 4.042211% |
| D | 5591 | 17 | 0.304060% |
Noise dominated data is calculated using 1-second bins in cleaned event files. If a bin has >2000 counts, and if more than 50% of those come from <1% of pixels, then it is considered to be noise-dominated and hence unusable.
| Quadrant | # 1 sec bins | Bins with >0 counts | Bins with >2000 counts | High rate bins dominated by noise | Noise dominated (total time) | Noise dominated (detector-on time) | Marked lightcurve |
|---|---|---|---|---|---|---|---|
| A | 7203 | 5592 | 6 | 6 | 0.08% | 0.11% | 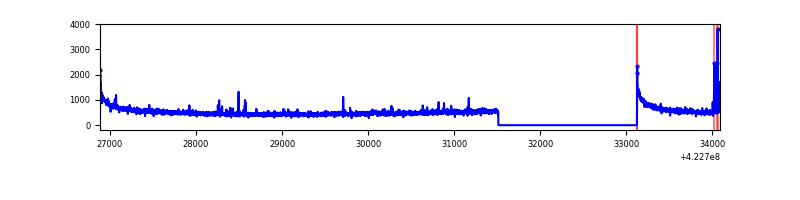 |
| B | 7203 | 5592 | 33 | 33 | 0.46% | 0.59% | 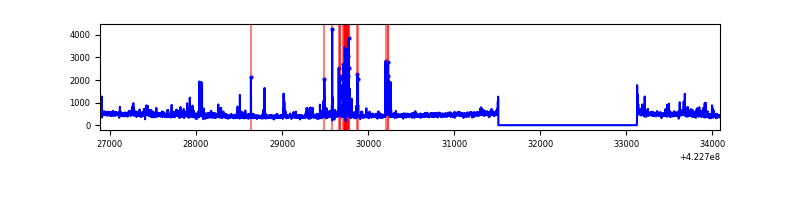 |
| C | 7203 | 5592 | 210 | 210 | 2.92% | 3.76% | 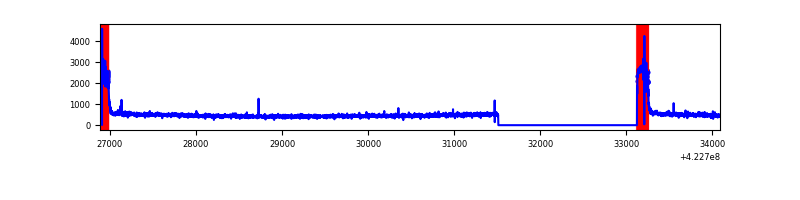 |
| D | 7203 | 5592 | 12 | 12 | 0.17% | 0.21% | 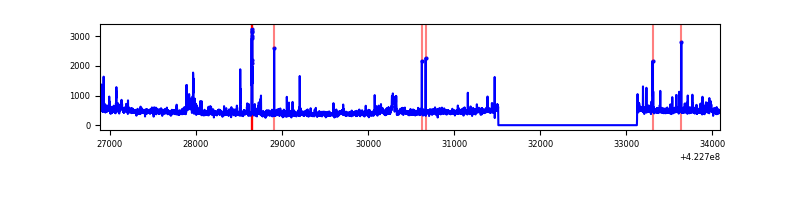 |
Top three noisy pixels from each quadrant. If the there are fewer than three noisy pixels in the level2.evt file, extra rows are filled as -1
| Pixel properties | Quadrant properties | ||||||
|---|---|---|---|---|---|---|---|
| Quadrant | DetID | PixID | Counts | Sigma | Mean | Median | Sigma |
| A | 10 | 83 | 542332 | 4352.12 | 599 | 586 | 124.5 |
| A | 13 | 248 | 42754 | 338.76 | 599 | 586 | 124.5 |
| A | 12 | 189 | 24856 | 194.97 | 599 | 586 | 124.5 |
| B | 5 | 255 | 240252 | 2075.64 | 597 | 580 | 115.5 |
| B | 0 | 190 | 117586 | 1013.31 | 597 | 580 | 115.5 |
| B | 12 | 111 | 15122 | 125.94 | 597 | 580 | 115.5 |
| C | 0 | 10 | 602655 | 4483.61 | 576 | 578 | 134.3 |
| C | 15 | 214 | 230900 | 1715.19 | 576 | 578 | 134.3 |
| C | 15 | 111 | 6869 | 46.85 | 576 | 578 | 134.3 |
| D | 12 | 79 | 173484 | 1193.95 | 592 | 573 | 144.8 |
| D | 5 | 222 | 76042 | 521.11 | 592 | 573 | 144.8 |
| D | 1 | 52 | 50382 | 343.93 | 592 | 573 | 144.8 |
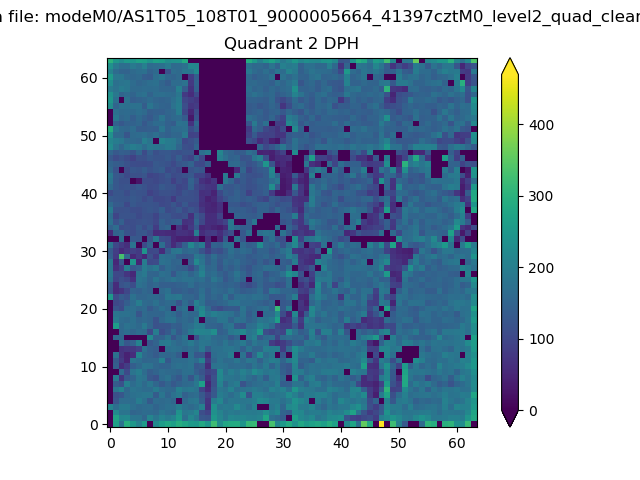
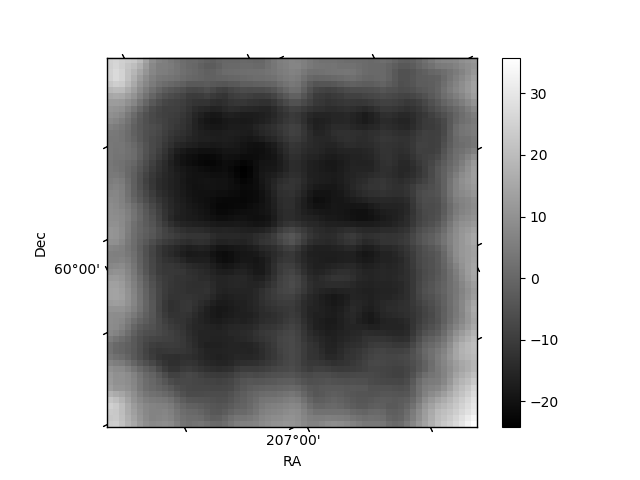
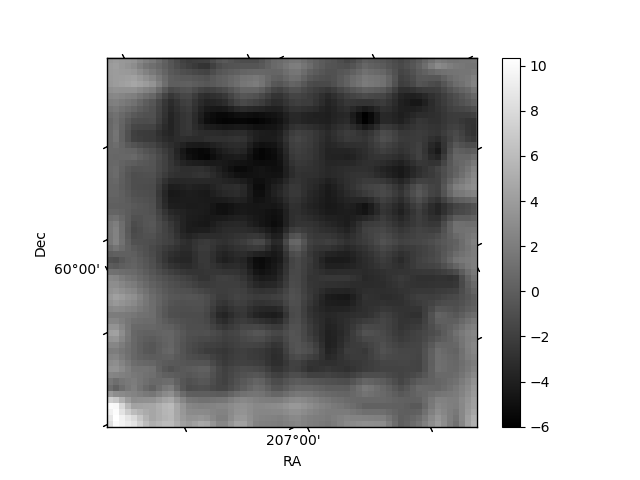
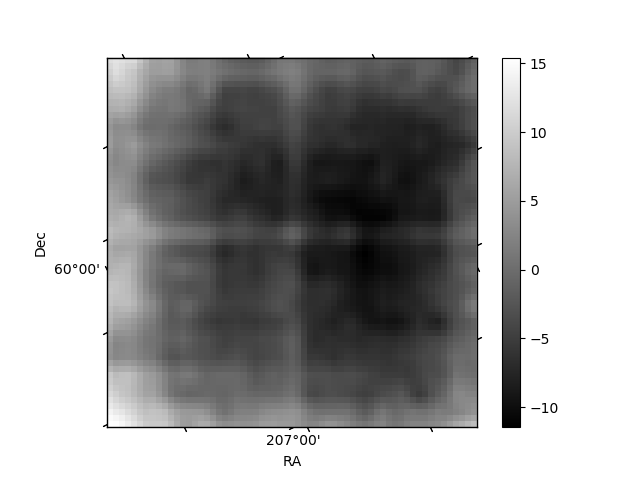
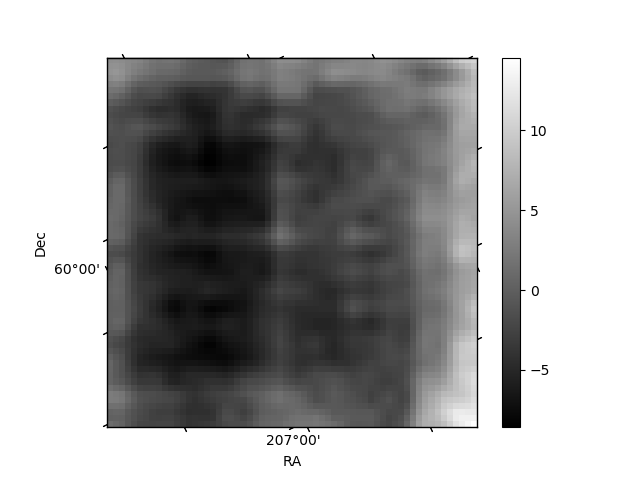
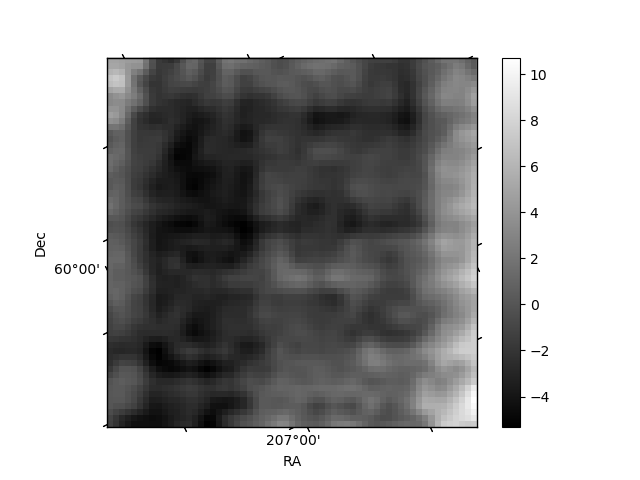
Histogram calculated using DETX and DETY for each event in the final _common_clean file
| Quadrant A | 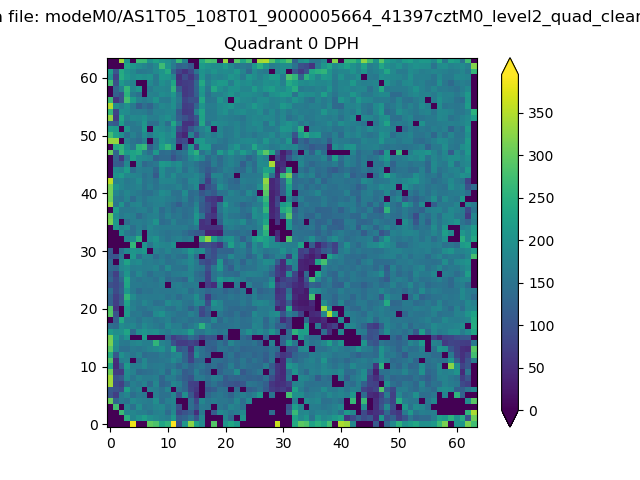 |
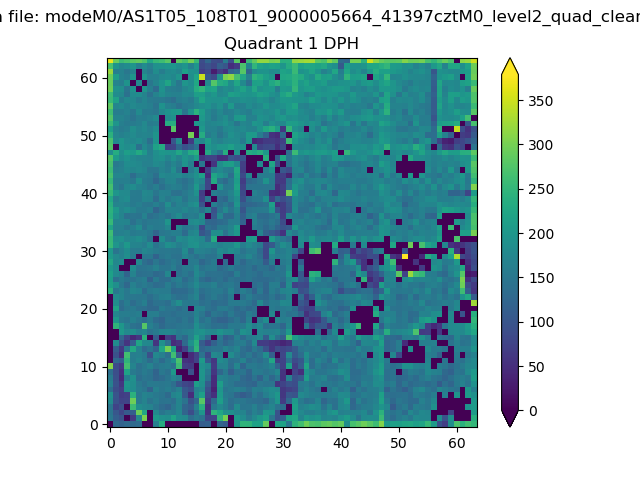 |
Quadrant B |
|---|---|---|---|
| Quadrant D | 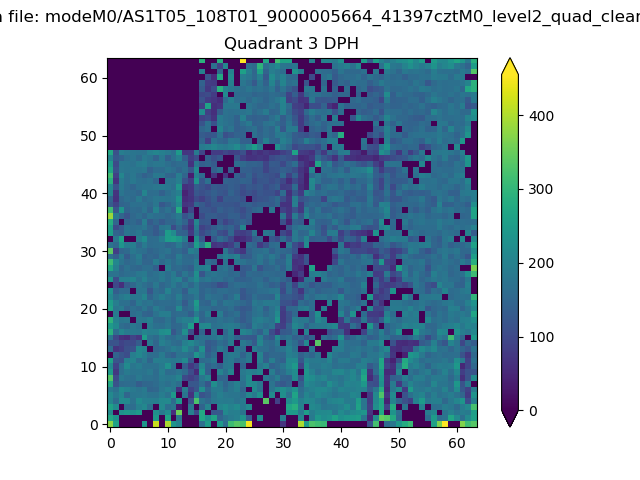 |
 |
Quadrant C |
| Plot type | Count rate plots | Images |
|---|---|---|
| Comparison with Poisson distribution Blue bars denote a histogram of data divided into 1 sec bins. Red curve is a Poisson curve with rate = median count rate of data. |
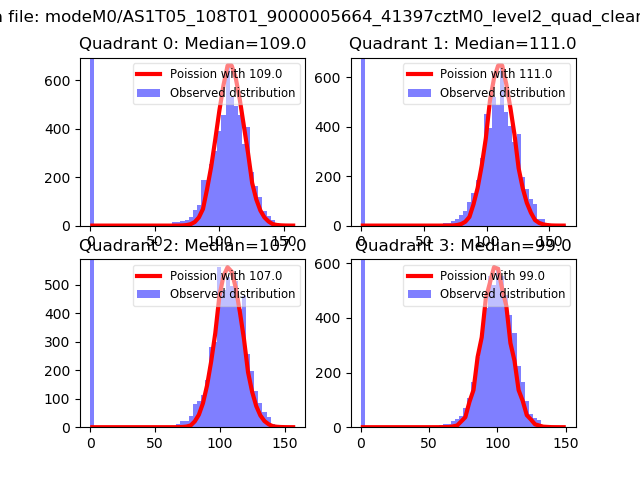 |
 |
| Quadrant-wise count rates Data is divided into 100 sec bins |
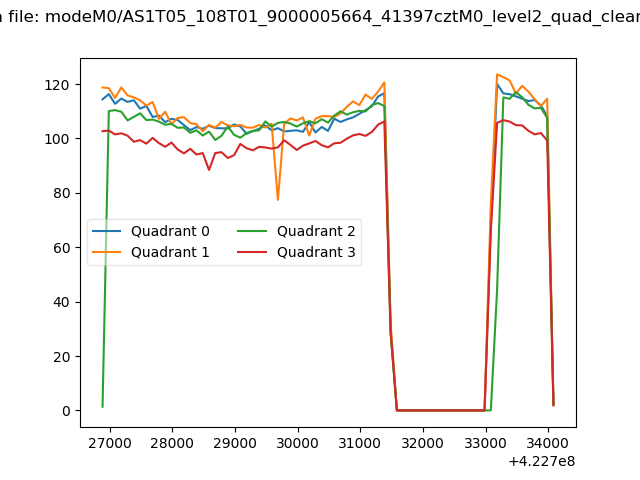 |
|
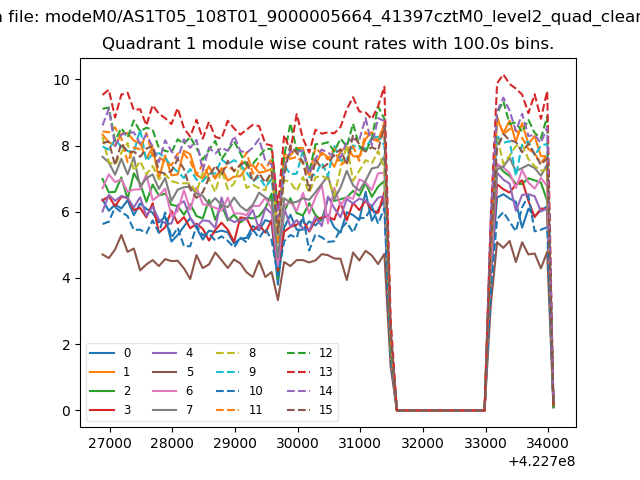
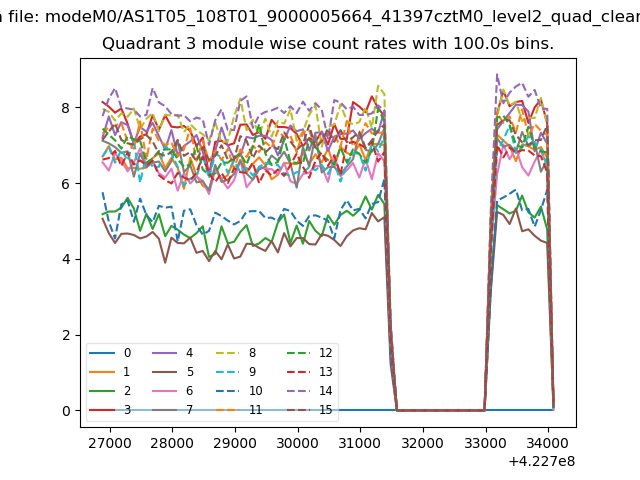
| Module-wise count rates for Quadrant A Data is divided into 100 sec bins |
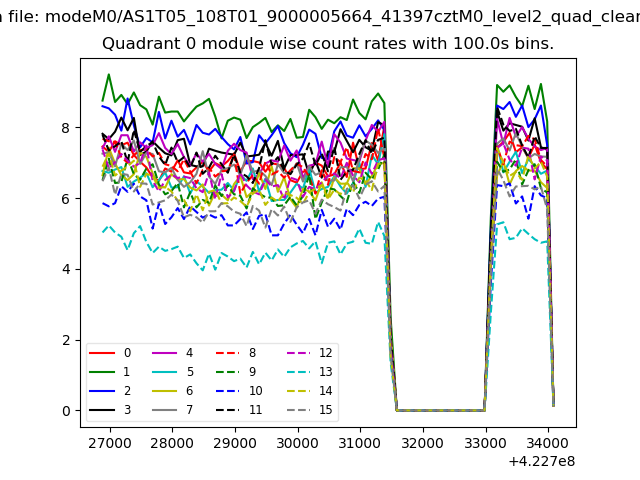 |
 |
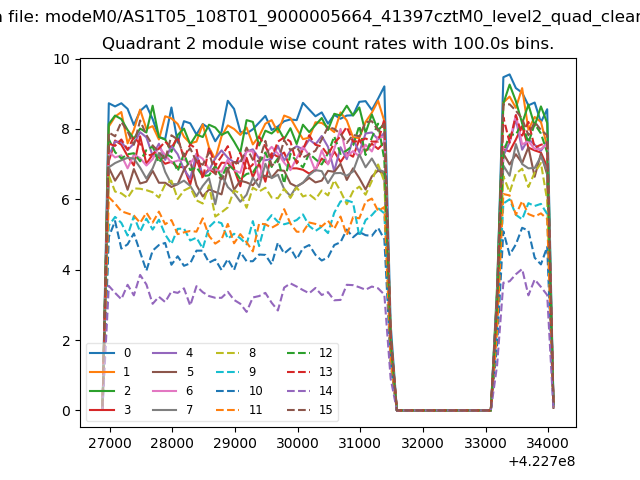
| Module-wise count rates for Quadrant B Data is divided into 100 sec bins |
 |
 |
| Module-wise count rates for Quadrant C Data is divided into 100 sec bins |
 |
 |
| Module-wise count rates for Quadrant D Data is divided into 100 sec bins |
 |
 |
| Parameter | Plot |
|---|---|
| CZT HV Monitor | 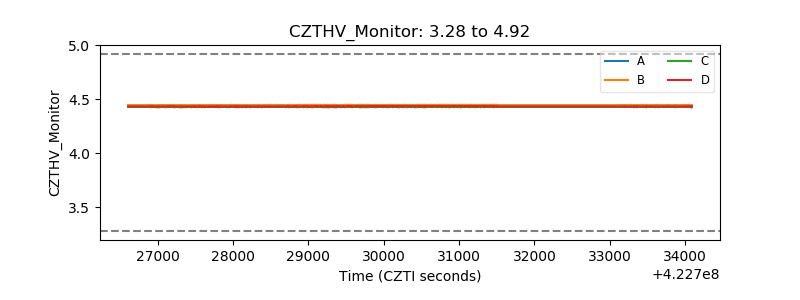 |
| D_VDD | 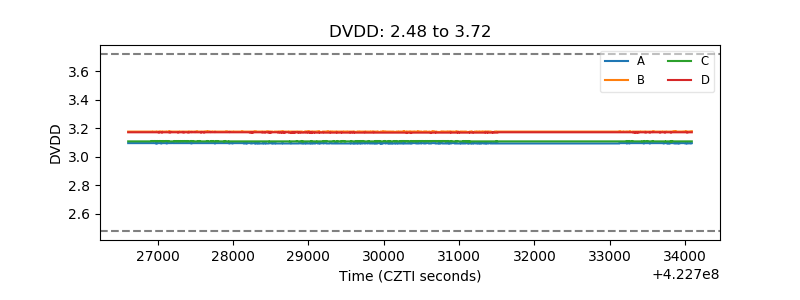 |
| Temperature 1 |  |
| Veto HV Monitor |  |
| Veto LLD | 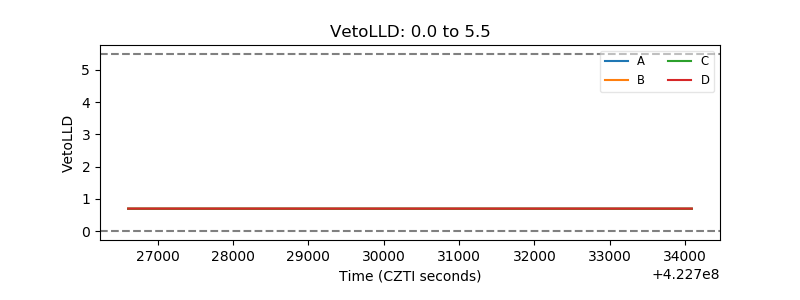 |
| Alpha Counter | 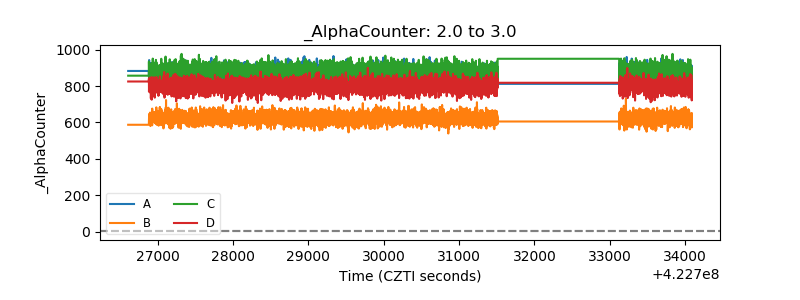 |
| _CPM_Rate | 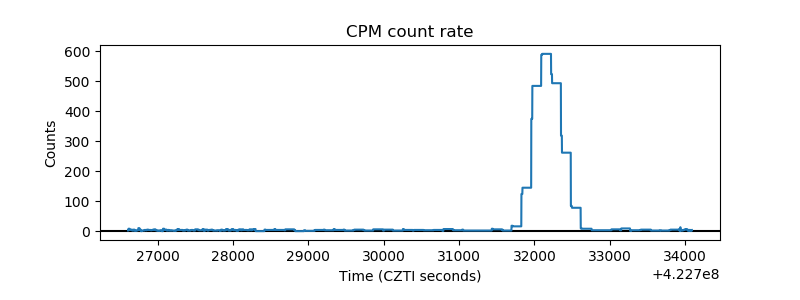 |
| CZT Counter | 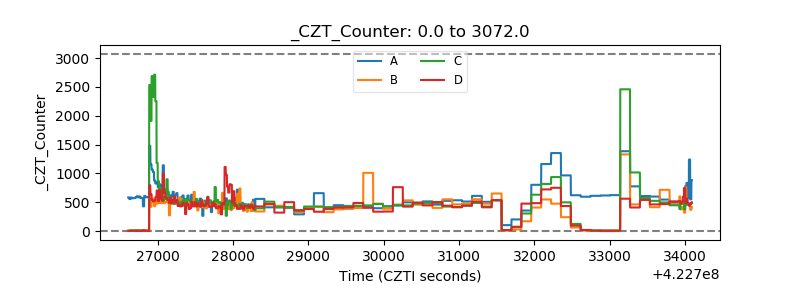 |
| +2.5 Volts monitor | 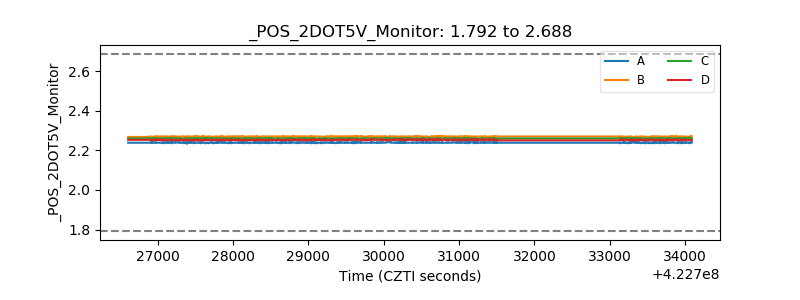 |
| +5 Volts monitor | 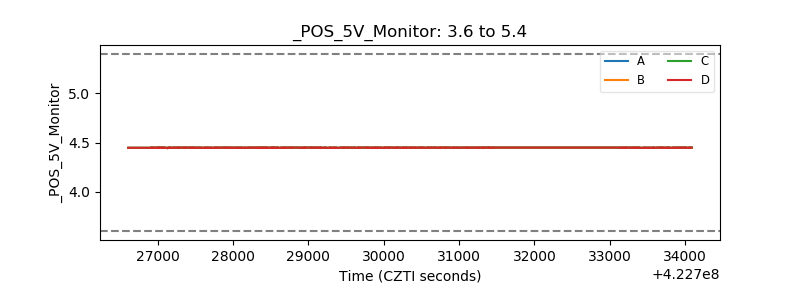 |
| _ROLL_ROT | 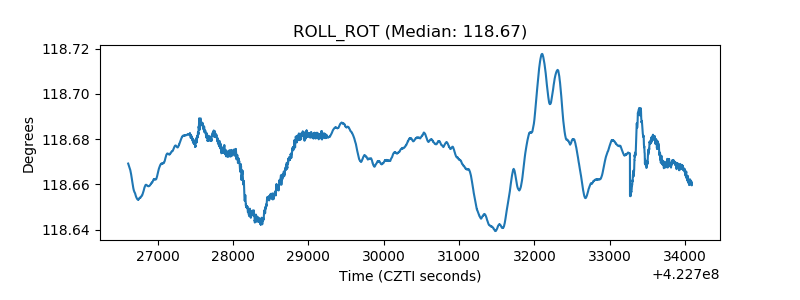 |
| _Roll_DEC | 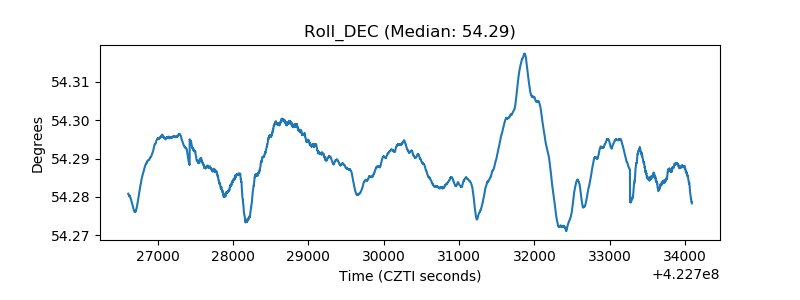 |
| _Roll_RA | 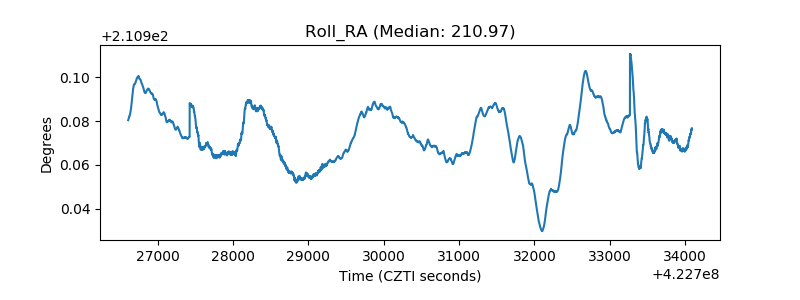 |
| Veto Counter | 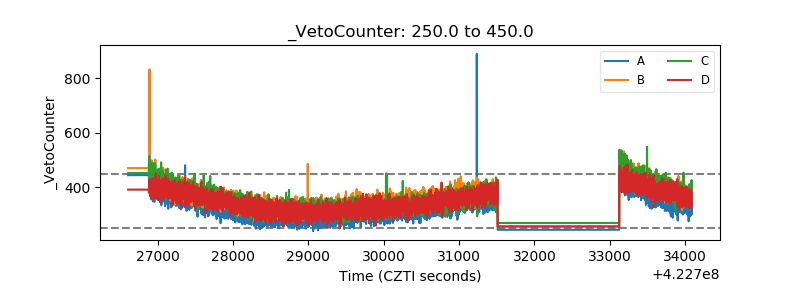 |