| Param | Original file | Final file |
|---|---|---|
| Filename | modeM0/AS1T05_108T01_9000005664_41399cztM0_level2.fits | modeM0/AS1T05_108T01_9000005664_41399cztM0_level2_quad_clean.evt |
| Size (bytes) | 311,590,080 | 87,713,280 |
| Size | 297.2 MB | 83.6 MB |
| Events in quadrant A | 2,856,108 | 588,000 |
| Events in quadrant B | 2,466,558 | 603,011 |
| Events in quadrant C | 3,035,183 | 552,365 |
| Events in quadrant D | 2,760,336 | 538,697 |
| Mode M0 | |||
|---|---|---|---|
| Quadrant | BADHDUFLAG | Total packets | Discarded packets |
| A | 0 | 11912 | 3 |
| B | 0 | 11150 | 2 |
| C | 0 | 12526 | 2 |
| D | 0 | 11646 | 2 |
| Mode M9 | |||
|---|---|---|---|
| Quadrant | BADHDUFLAG | Total packets | Discarded packets |
| A | 0 | 23 | 0 |
| B | 0 | 23 | 0 |
| C | 0 | 23 | 0 |
| D | 0 | 24 | 0 |
| Mode SS | |||
|---|---|---|---|
| Quadrant | BADHDUFLAG | Total packets | Discarded packets |
| A | 0 | 110 | 0 |
| B | 0 | 110 | 0 |
| C | 0 | 110 | 0 |
| D | 0 | 110 | 0 |
| Quadrant | Total seconds | Saturated seconds | Saturation percentage |
|---|---|---|---|
| A | 5333 | 21 | 0.393775% |
| B | 5333 | 14 | 0.262516% |
| C | 5333 | 255 | 4.781549% |
| D | 5333 | 26 | 0.487530% |
Noise dominated data is calculated using 1-second bins in cleaned event files. If a bin has >2000 counts, and if more than 50% of those come from <1% of pixels, then it is considered to be noise-dominated and hence unusable.
| Quadrant | # 1 sec bins | Bins with >0 counts | Bins with >2000 counts | High rate bins dominated by noise | Noise dominated (total time) | Noise dominated (detector-on time) | Marked lightcurve |
|---|---|---|---|---|---|---|---|
| A | 7096 | 5334 | 8 | 8 | 0.11% | 0.15% | 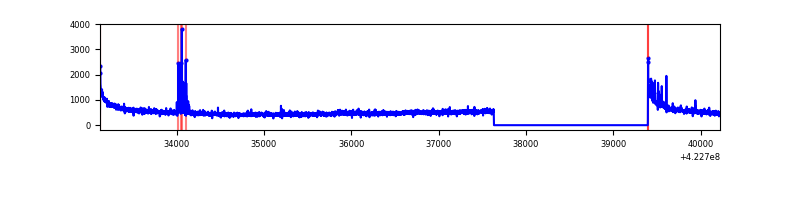 |
| B | 7096 | 5334 | 7 | 7 | 0.10% | 0.13% | 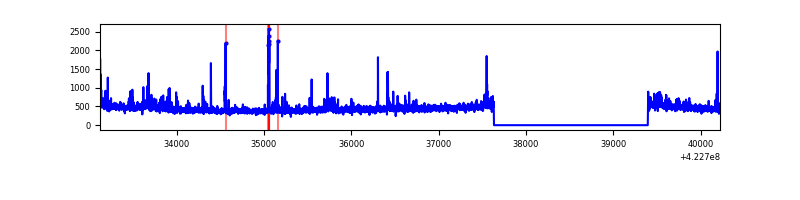 |
| C | 7096 | 5334 | 239 | 239 | 3.37% | 4.48% | 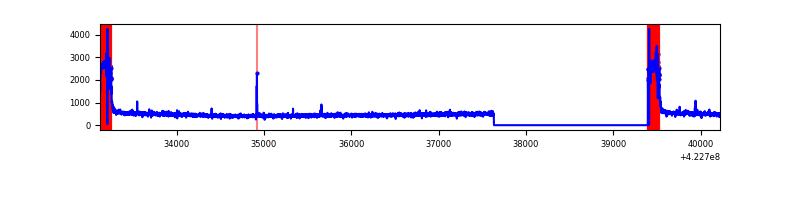 |
| D | 7096 | 5334 | 19 | 19 | 0.27% | 0.36% | 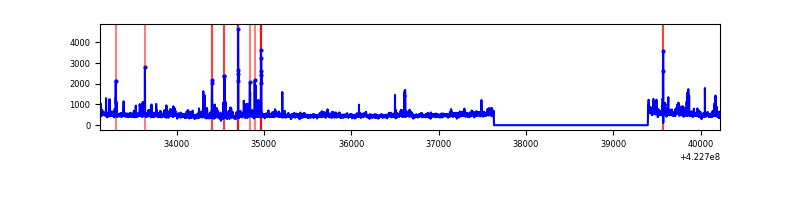 |
Top three noisy pixels from each quadrant. If the there are fewer than three noisy pixels in the level2.evt file, extra rows are filled as -1
| Pixel properties | Quadrant properties | ||||||
|---|---|---|---|---|---|---|---|
| Quadrant | DetID | PixID | Counts | Sigma | Mean | Median | Sigma |
| A | 10 | 83 | 521281 | 4453.21 | 570 | 557 | 116.9 |
| A | 13 | 248 | 82878 | 704.01 | 570 | 557 | 116.9 |
| A | 12 | 189 | 18640 | 154.65 | 570 | 557 | 116.9 |
| B | 5 | 255 | 123180 | 1114.88 | 571 | 555 | 110.0 |
| B | 0 | 190 | 69243 | 624.5 | 571 | 555 | 110.0 |
| B | 0 | 189 | 15766 | 138.3 | 571 | 555 | 110.0 |
| C | 0 | 10 | 681412 | 5382.12 | 542 | 544 | 126.5 |
| C | 15 | 214 | 218393 | 1722.05 | 542 | 544 | 126.5 |
| C | 12 | 249 | 11332 | 85.28 | 542 | 544 | 126.5 |
| D | 13 | 174 | 197763 | 1454.8 | 560 | 545 | 135.6 |
| D | 12 | 79 | 140474 | 1032.2 | 560 | 545 | 135.6 |
| D | 5 | 222 | 121376 | 891.33 | 560 | 545 | 135.6 |
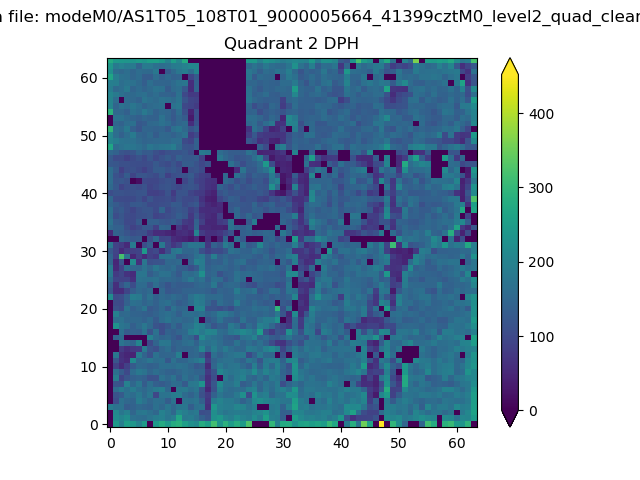
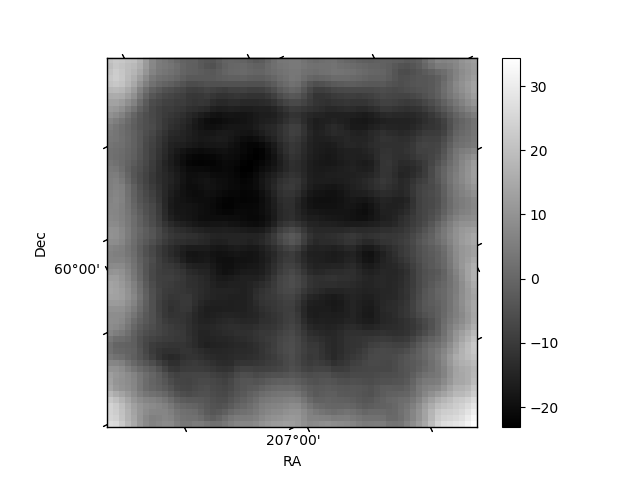
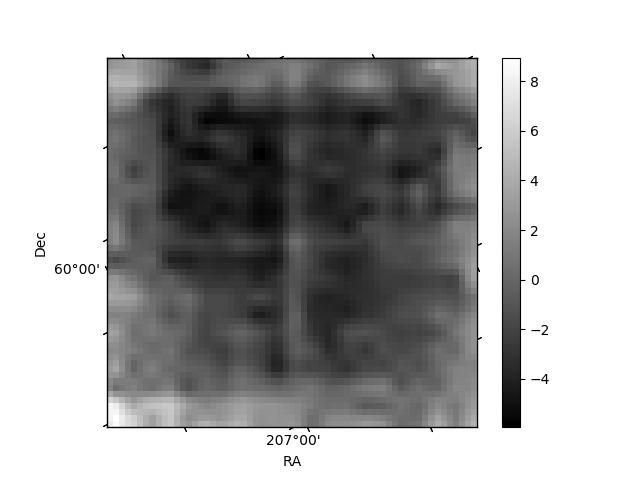
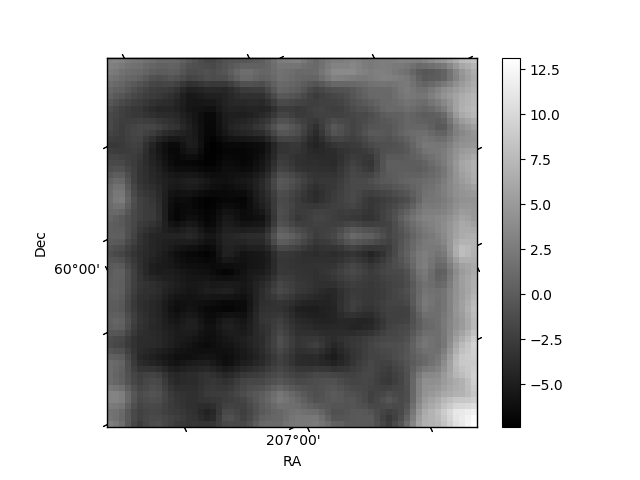
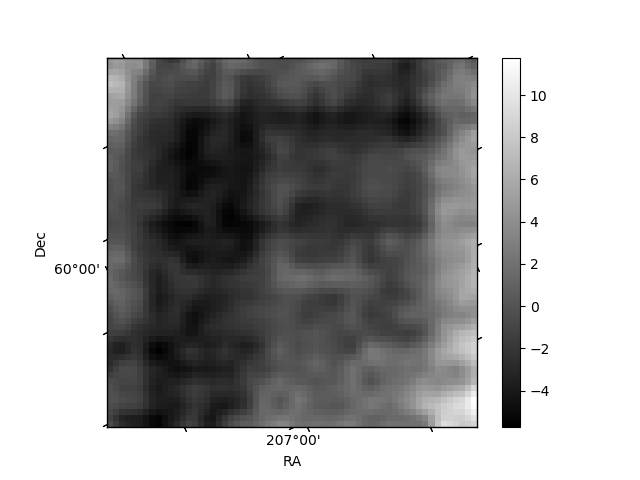
Histogram calculated using DETX and DETY for each event in the final _common_clean file
| Quadrant A | 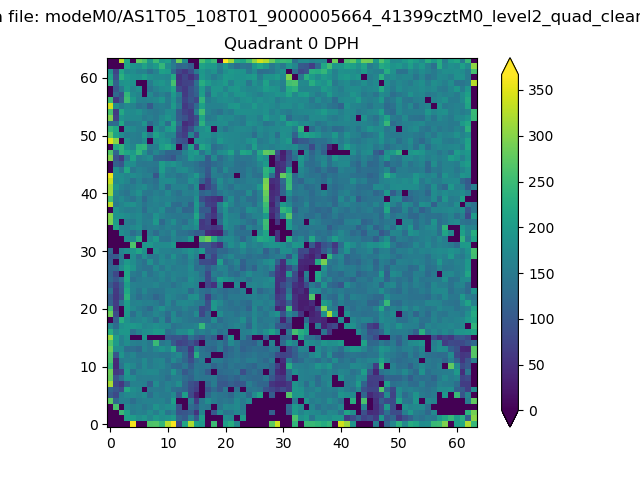 |
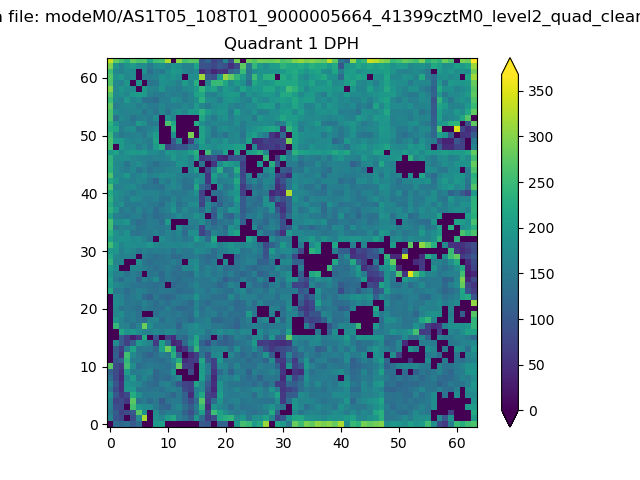 |
Quadrant B |
|---|---|---|---|
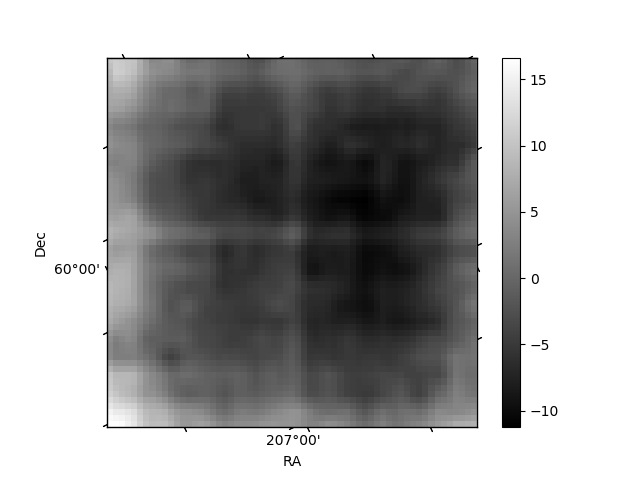
| Quadrant D | 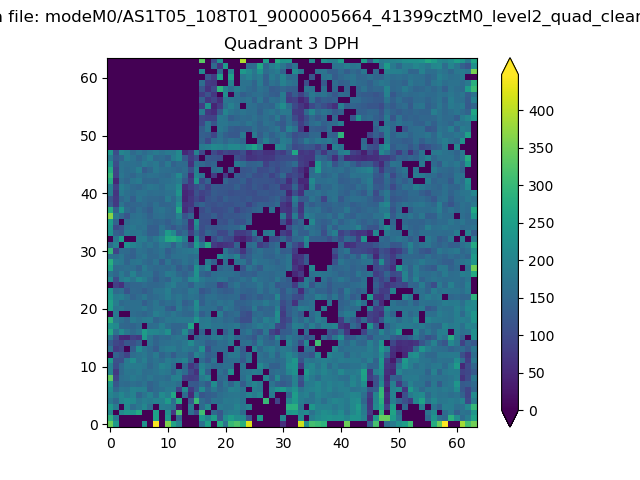 |
 |
Quadrant C |
| Plot type | Count rate plots | Images |
|---|---|---|
| Comparison with Poisson distribution Blue bars denote a histogram of data divided into 1 sec bins. Red curve is a Poisson curve with rate = median count rate of data. |
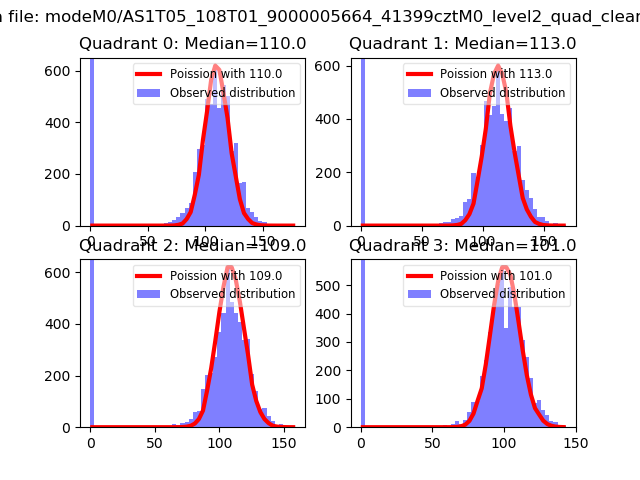 |
 |
| Quadrant-wise count rates Data is divided into 100 sec bins |
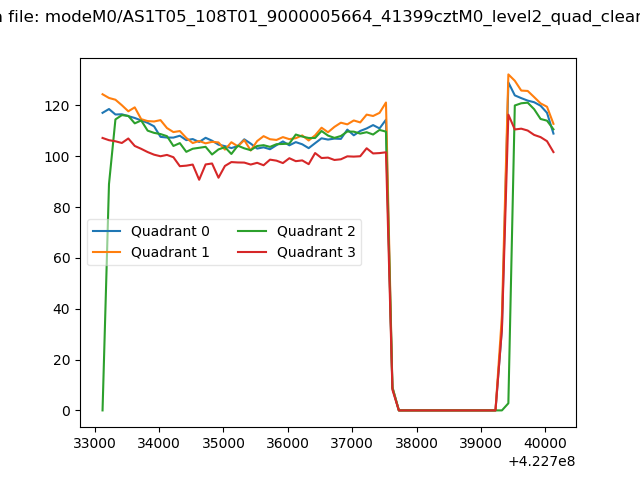 |
|
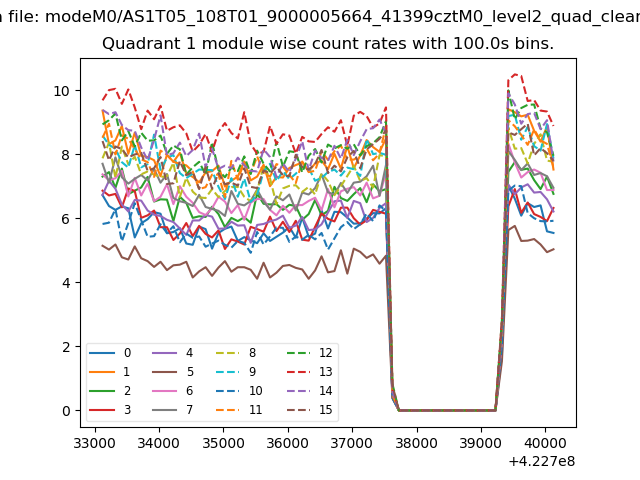
| Module-wise count rates for Quadrant A Data is divided into 100 sec bins |
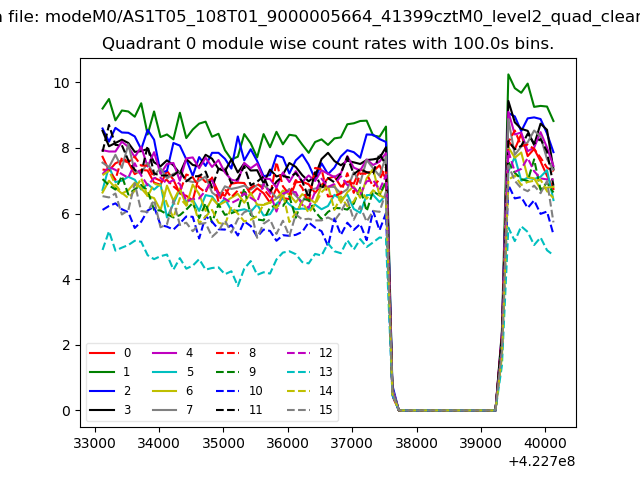 |
 |
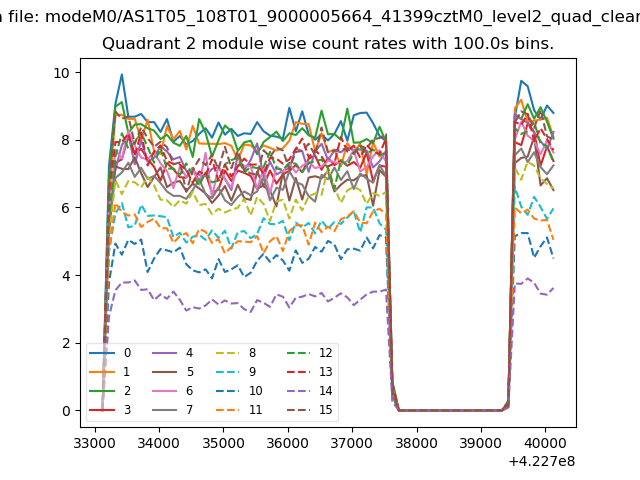
| Module-wise count rates for Quadrant B Data is divided into 100 sec bins |
 |
 |
| Module-wise count rates for Quadrant C Data is divided into 100 sec bins |
 |
 |
| Module-wise count rates for Quadrant D Data is divided into 100 sec bins |
 |
 |
| Parameter | Plot |
|---|---|
| CZT HV Monitor |  |
| D_VDD | 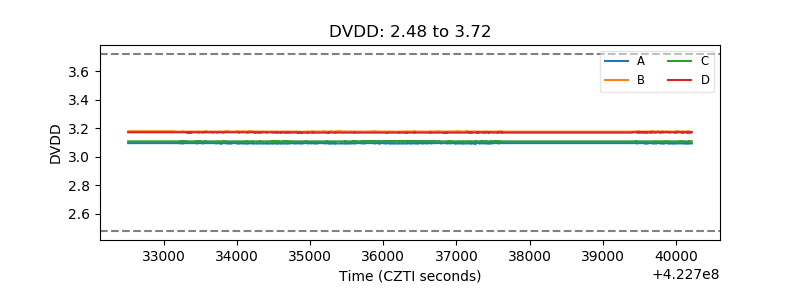 |
| Temperature 1 | 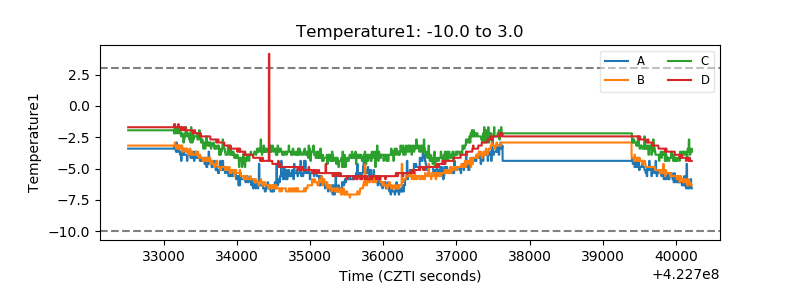 |
| Veto HV Monitor | 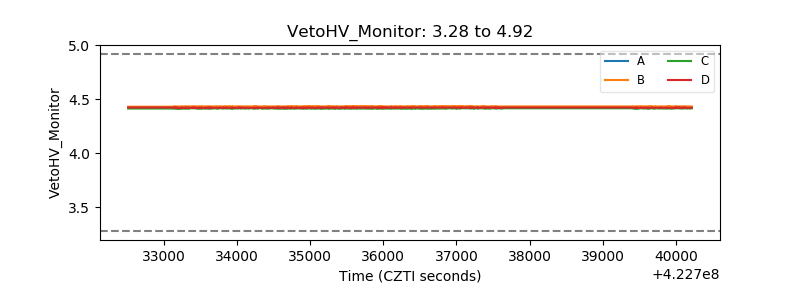 |
| Veto LLD | 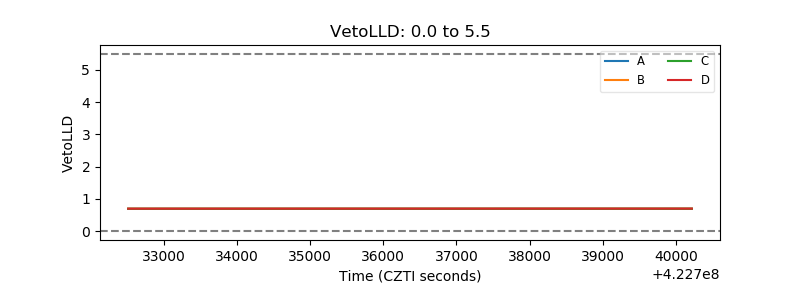 |
| Alpha Counter | 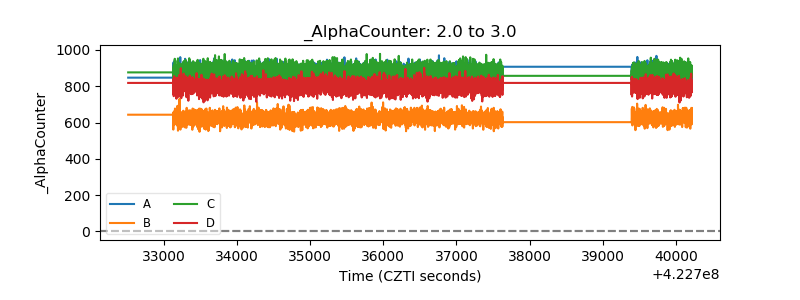 |
| _CPM_Rate | 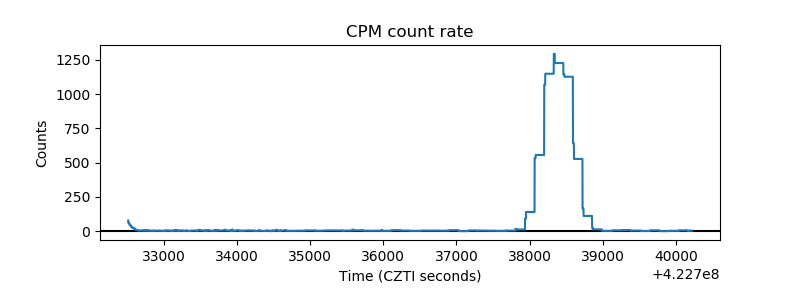 |
| CZT Counter | 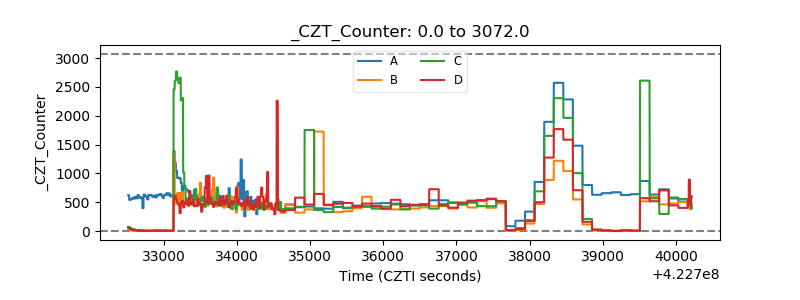 |
| +2.5 Volts monitor | 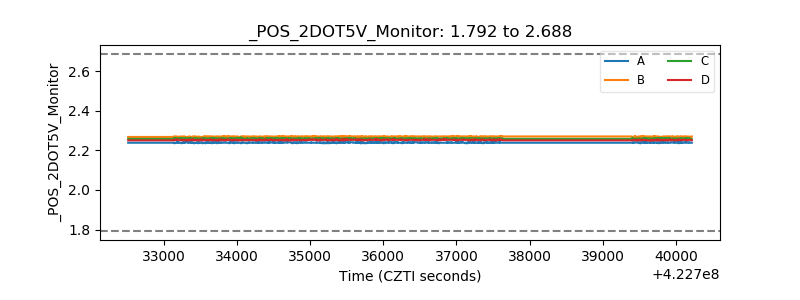 |
| +5 Volts monitor | 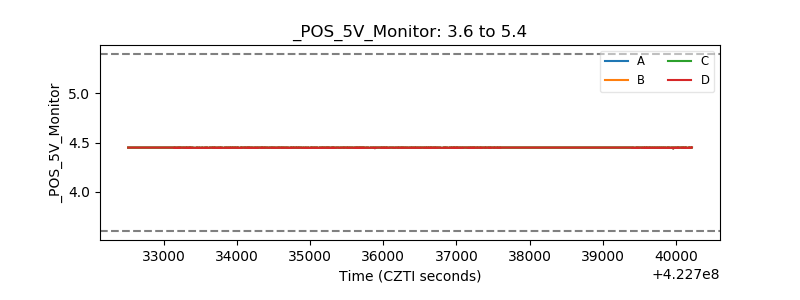 |
| _ROLL_ROT | 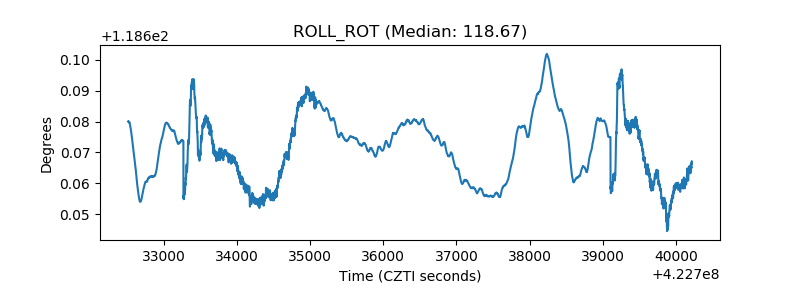 |
| _Roll_DEC | 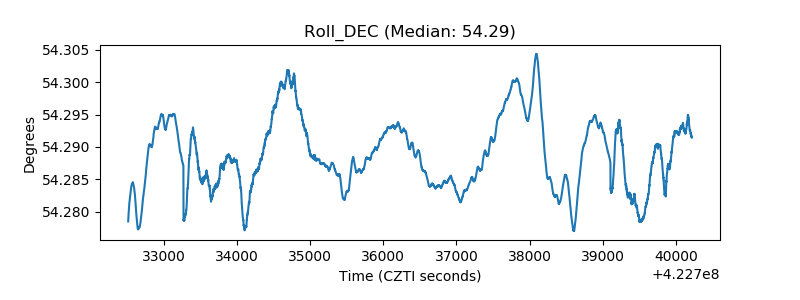 |
| _Roll_RA | 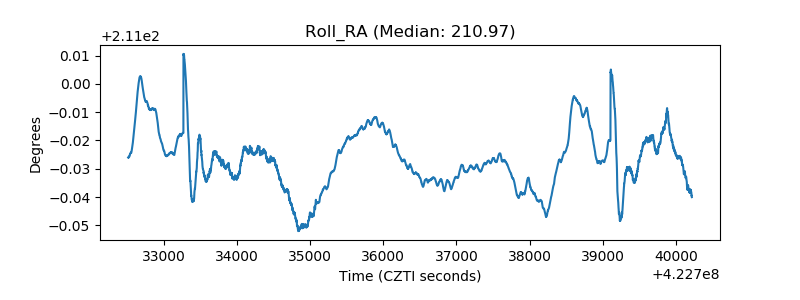 |
| Veto Counter | 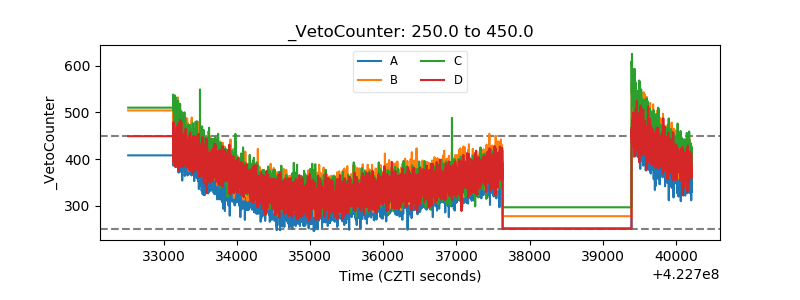 |