| Param | Original file | Final file |
|---|---|---|
| Filename | modeM0/AS1T05_100T01_9000005668_41440cztM0_level2.fits | modeM0/AS1T05_100T01_9000005668_41440cztM0_level2_quad_clean.evt |
| Size (bytes) | 78,624,000 | 14,938,560 |
| Size | 75.0 MB | 14.2 MB |
| Events in quadrant A | 809,476 | 104,682 |
| Events in quadrant B | 448,359 | 106,330 |
| Events in quadrant C | 729,147 | 87,946 |
| Events in quadrant D | 850,431 | 83,469 |
| Mode M9 | |||
|---|---|---|---|
| Quadrant | BADHDUFLAG | Total packets | Discarded packets |
| A | 0 | 5 | 0 |
| B | 0 | 5 | 0 |
| C | 0 | 5 | 0 |
| D | 0 | 5 | 0 |
| Mode SS | |||
|---|---|---|---|
| Quadrant | BADHDUFLAG | Total packets | Discarded packets |
| A | 0 | 18 | 0 |
| B | 0 | 18 | 0 |
| C | 0 | 18 | 0 |
| D | 0 | 18 | 0 |
| Mode M0 | |||
|---|---|---|---|
| Quadrant | BADHDUFLAG | Total packets | Discarded packets |
| A | 0 | 3056 | 2 |
| B | 0 | 1852 | 1 |
| C | 0 | 2681 | 1 |
| D | 0 | 3119 | 1 |
| Quadrant | Total seconds | Saturated seconds | Saturation percentage |
|---|---|---|---|
| A | 900 | 22 | 2.444444% |
| B | 900 | 3 | 0.333333% |
| C | 900 | 121 | 13.444444% |
| D | 900 | 126 | 14.000000% |
Noise dominated data is calculated using 1-second bins in cleaned event files. If a bin has >2000 counts, and if more than 50% of those come from <1% of pixels, then it is considered to be noise-dominated and hence unusable.
| Quadrant | # 1 sec bins | Bins with >0 counts | Bins with >2000 counts | High rate bins dominated by noise | Noise dominated (total time) | Noise dominated (detector-on time) | Marked lightcurve |
|---|---|---|---|---|---|---|---|
| A | 900 | 900 | 5 | 5 | 0.56% | 0.56% | 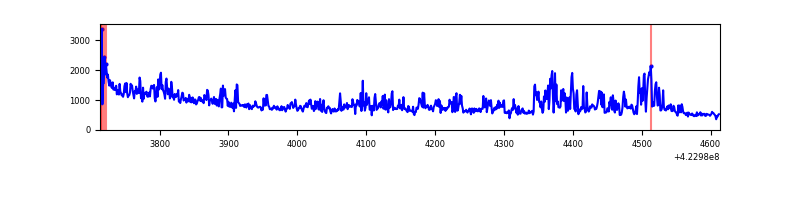 |
| B | 900 | 900 | 0 | 0 | 0.00% | 0.00% | 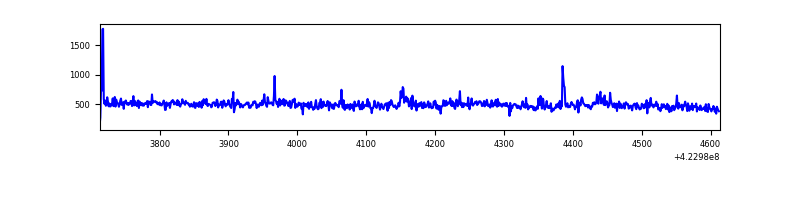 |
| C | 900 | 900 | 114 | 114 | 12.67% | 12.67% | 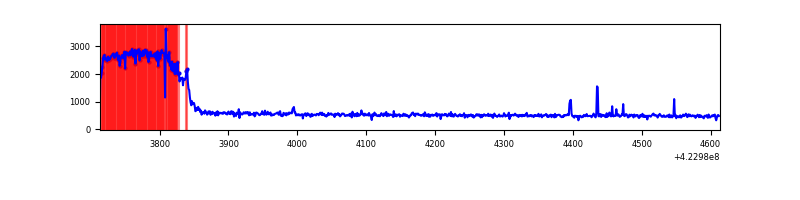 |
| D | 900 | 900 | 94 | 94 | 10.44% | 10.44% | 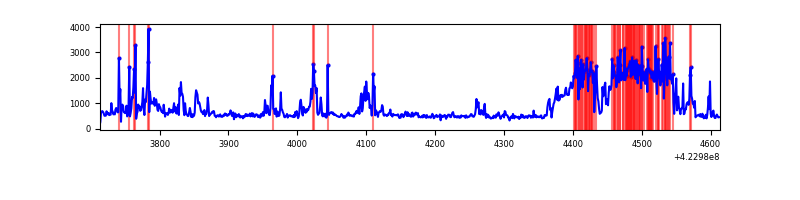 |
Top three noisy pixels from each quadrant. If the there are fewer than three noisy pixels in the level2.evt file, extra rows are filled as -1
| Pixel properties | Quadrant properties | ||||||
|---|---|---|---|---|---|---|---|
| Quadrant | DetID | PixID | Counts | Sigma | Mean | Median | Sigma |
| A | 2 | 79 | 226290 | 9533.11 | 107 | 104 | 23.7 |
| A | 10 | 83 | 162827 | 6858.32 | 107 | 104 | 23.7 |
| A | 12 | 189 | 3628 | 148.53 | 107 | 104 | 23.7 |
| B | 0 | 190 | 18976 | 847.87 | 105 | 102 | 22.3 |
| B | 4 | 81 | 6570 | 290.56 | 105 | 102 | 22.3 |
| B | 0 | 155 | 5416 | 238.72 | 105 | 102 | 22.3 |
| C | 0 | 10 | 314873 | 13166.8 | 94 | 94 | 23.9 |
| C | 15 | 214 | 37626 | 1569.91 | 94 | 94 | 23.9 |
| C | 12 | 249 | 7797 | 322.21 | 94 | 94 | 23.9 |
| D | 13 | 249 | 336018 | 12514.82 | 102 | 99 | 26.8 |
| D | 13 | 171 | 29744 | 1104.44 | 102 | 99 | 26.8 |
| D | 12 | 233 | 26699 | 991.0 | 102 | 99 | 26.8 |
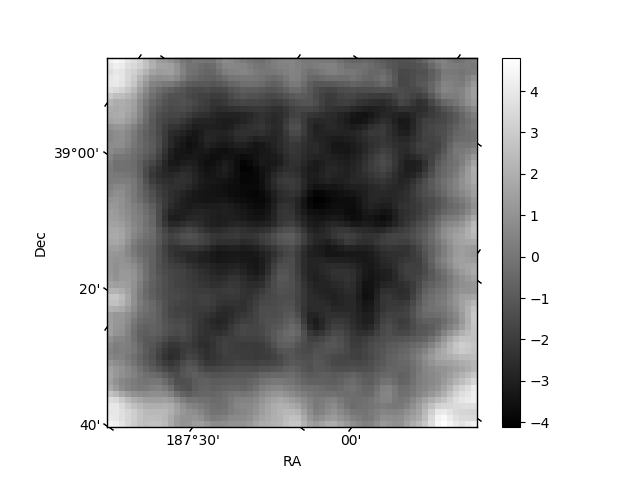
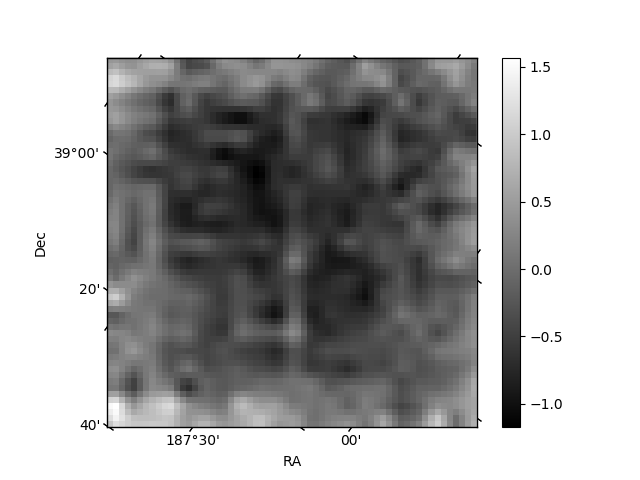
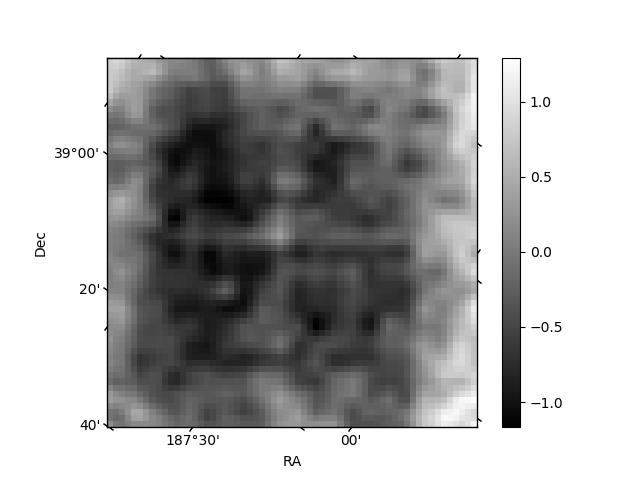
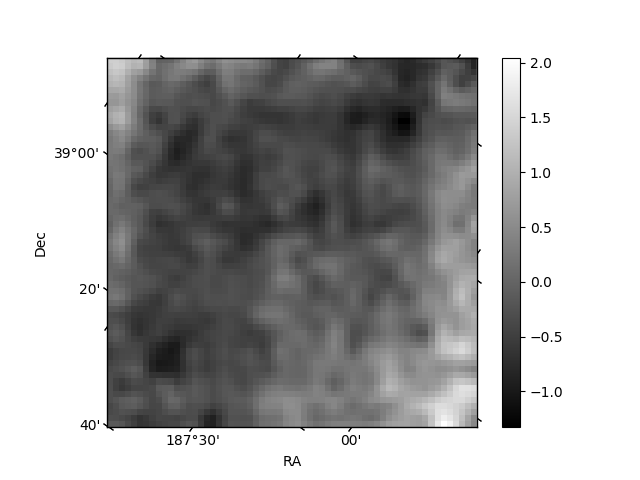
Histogram calculated using DETX and DETY for each event in the final _common_clean file
| Quadrant A | 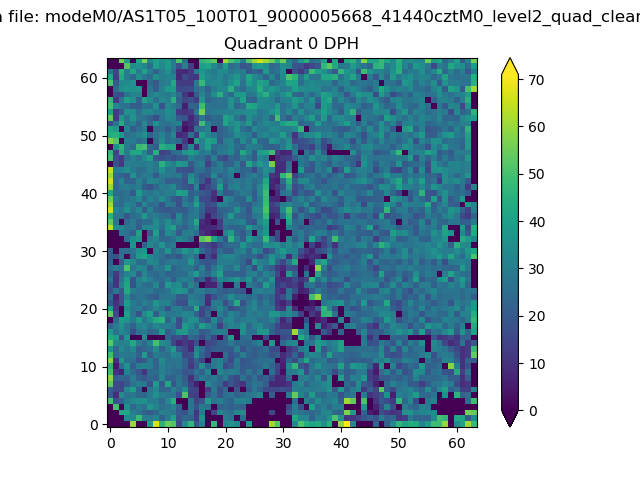 |
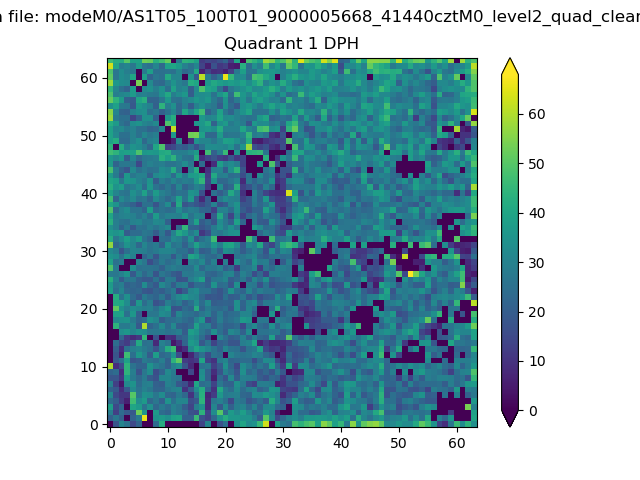 |
Quadrant B |
|---|---|---|---|
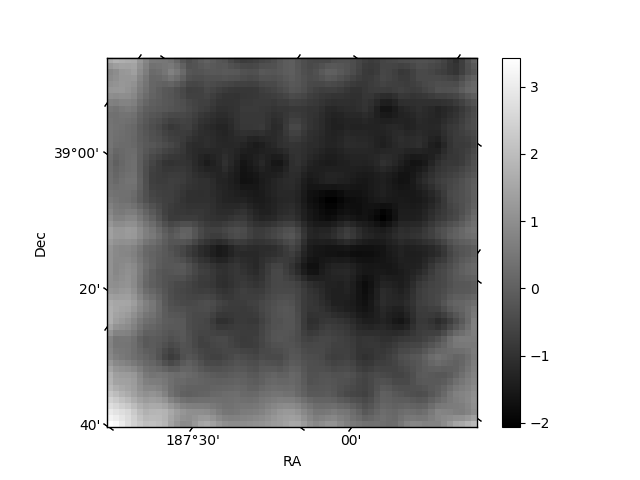
| Quadrant D | 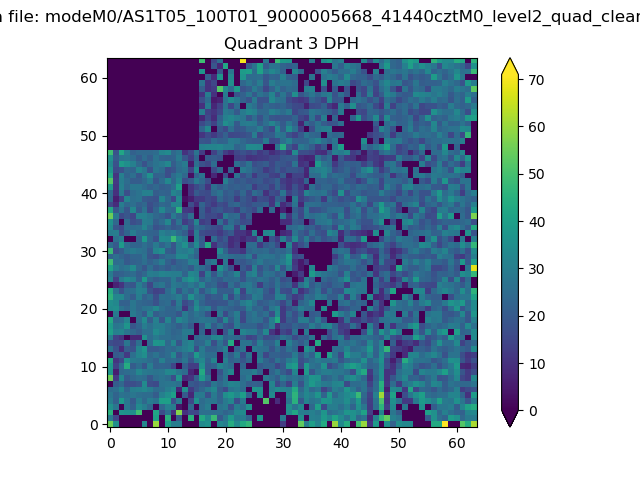 |
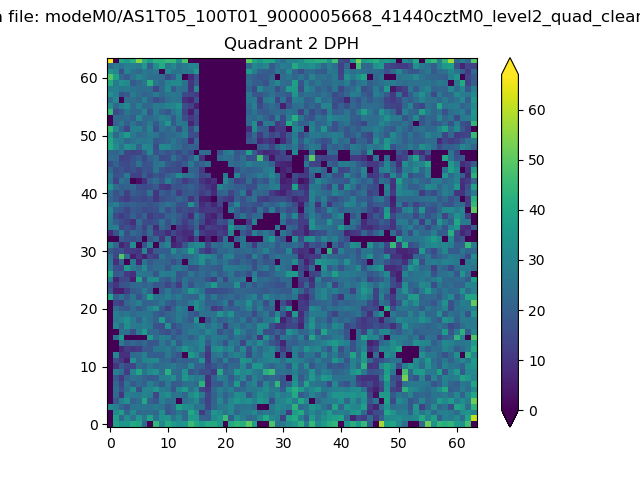 |
Quadrant C |
| Plot type | Count rate plots | Images |
|---|---|---|
| Comparison with Poisson distribution Blue bars denote a histogram of data divided into 1 sec bins. Red curve is a Poisson curve with rate = median count rate of data. |
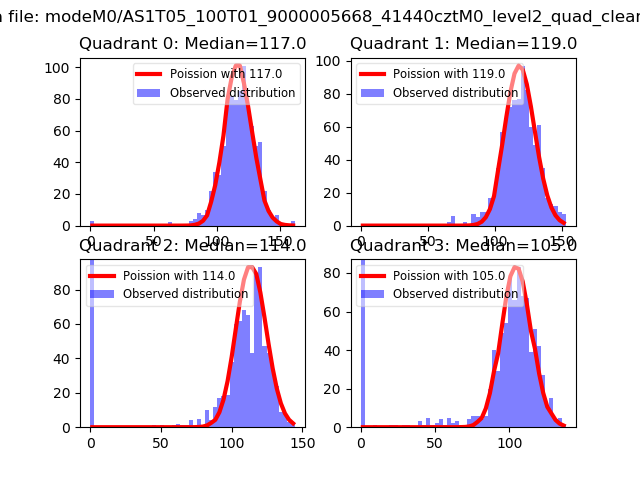 |
 |
| Quadrant-wise count rates Data is divided into 100 sec bins |
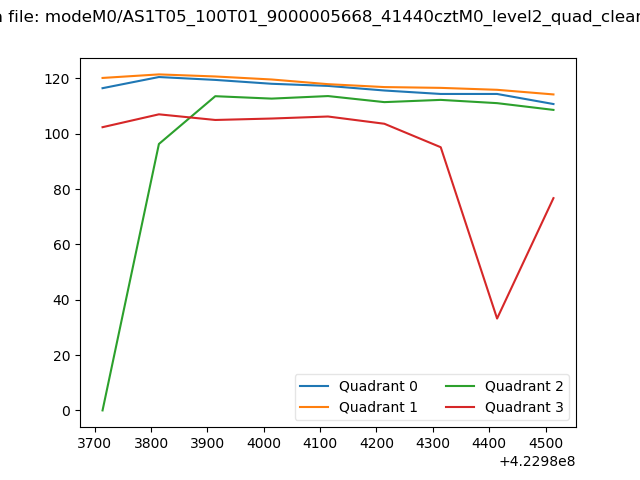 |
|
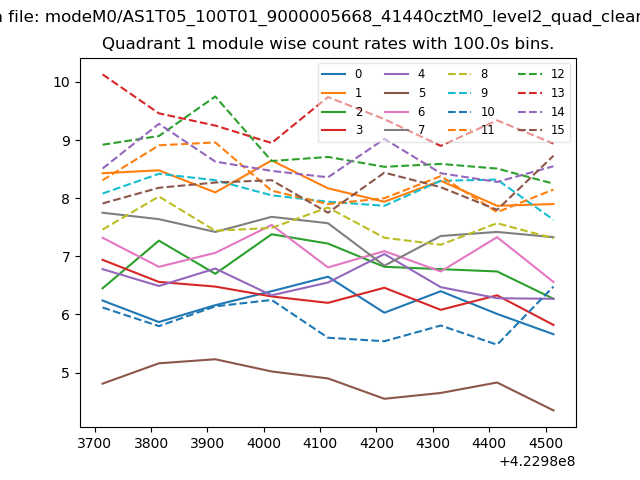
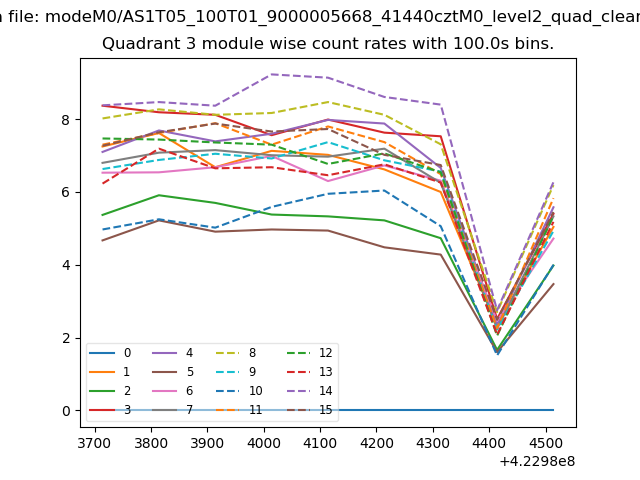
| Module-wise count rates for Quadrant A Data is divided into 100 sec bins |
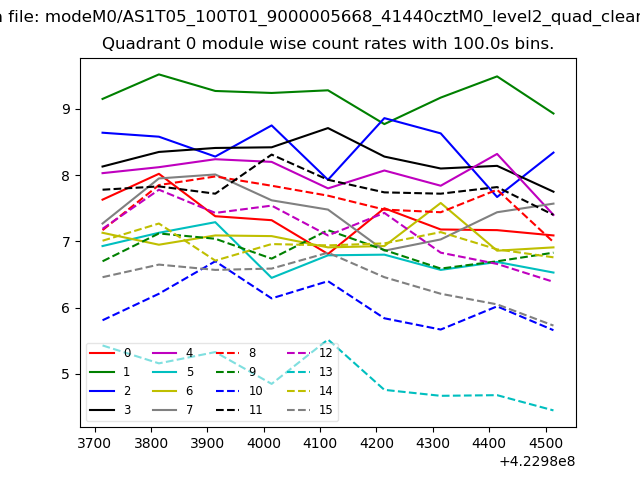 |
 |
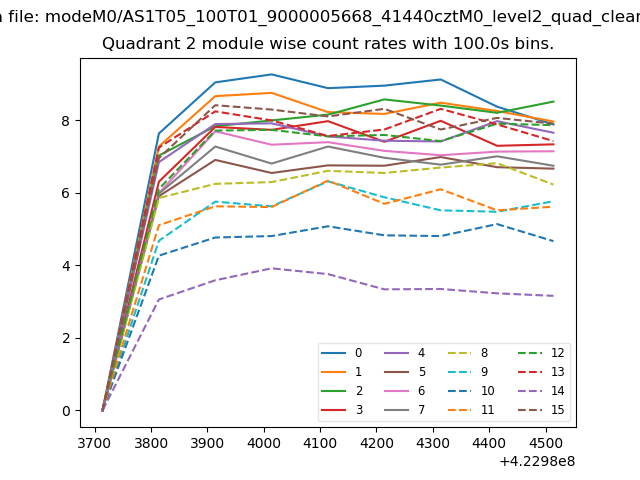
| Module-wise count rates for Quadrant B Data is divided into 100 sec bins |
 |
 |
| Module-wise count rates for Quadrant C Data is divided into 100 sec bins |
 |
 |
| Module-wise count rates for Quadrant D Data is divided into 100 sec bins |
 |
 |
| Parameter | Plot |
|---|---|
| CZT HV Monitor | 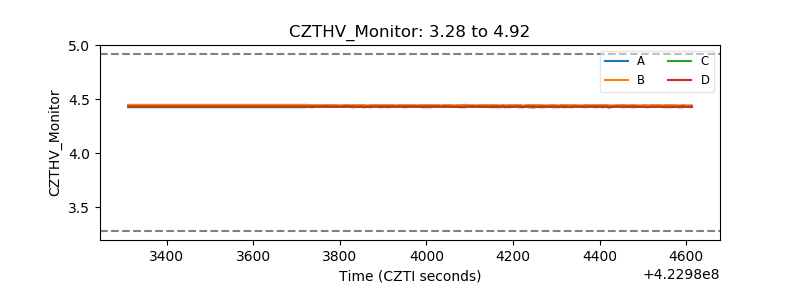 |
| D_VDD | 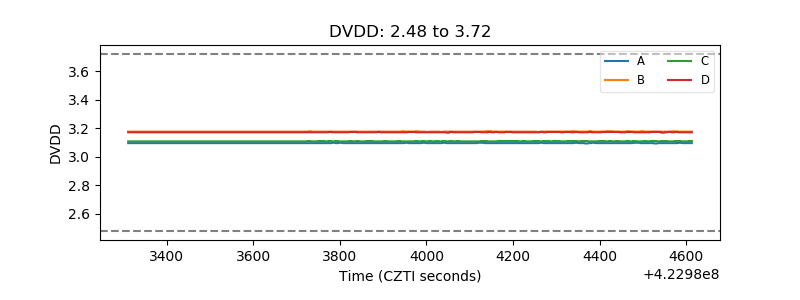 |
| Temperature 1 | 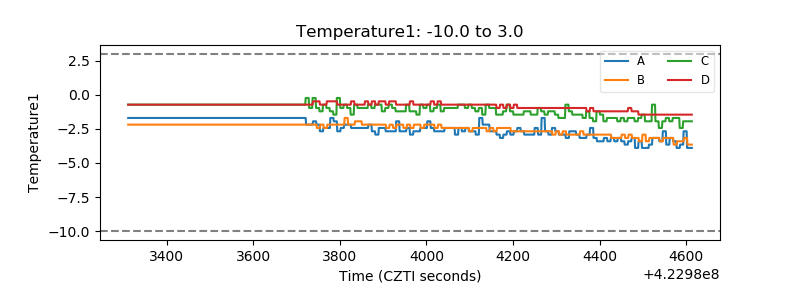 |
| Veto HV Monitor | 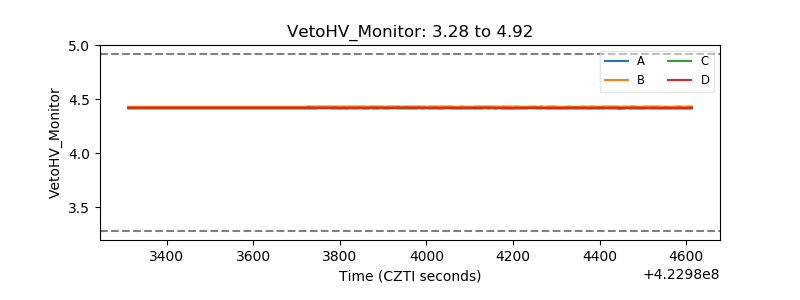 |
| Veto LLD | 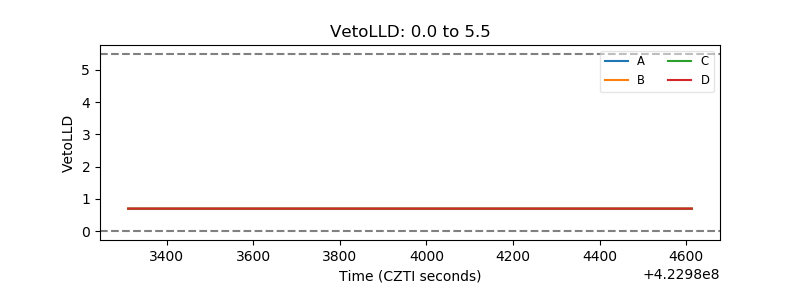 |
| Alpha Counter | 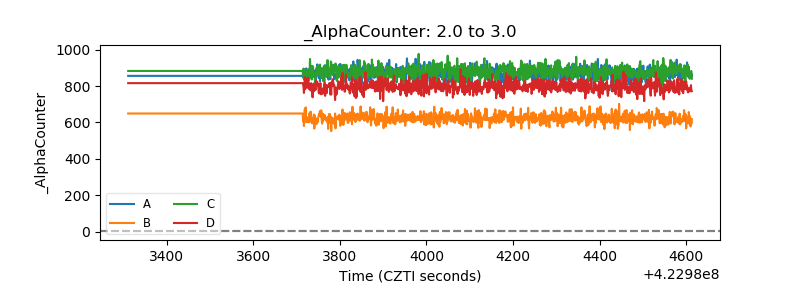 |
| _CPM_Rate | 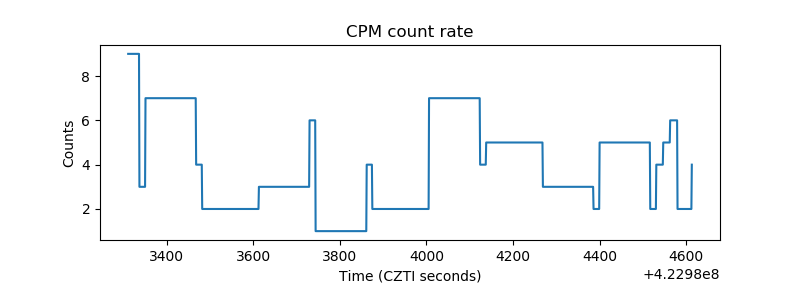 |
| CZT Counter | 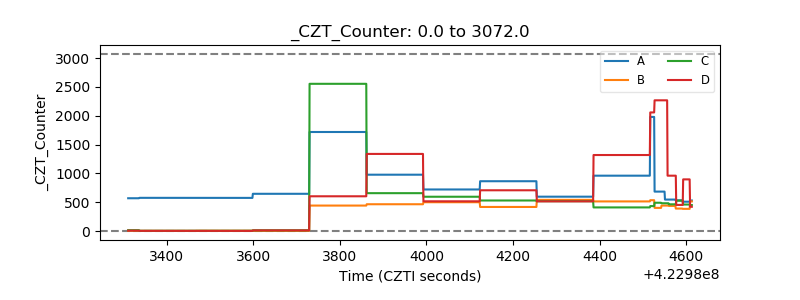 |
| +2.5 Volts monitor | 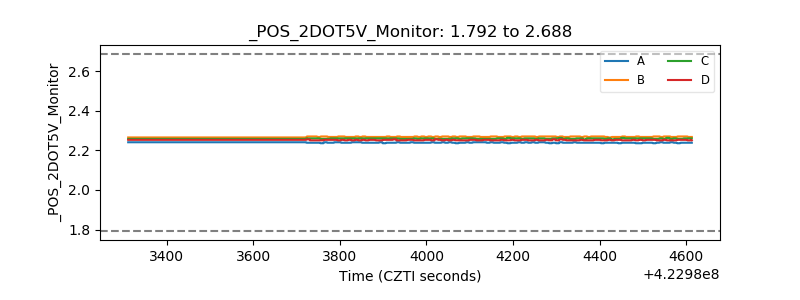 |
| +5 Volts monitor | 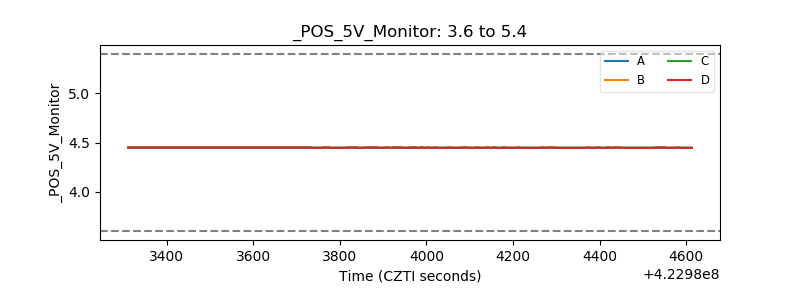 |
| _ROLL_ROT | 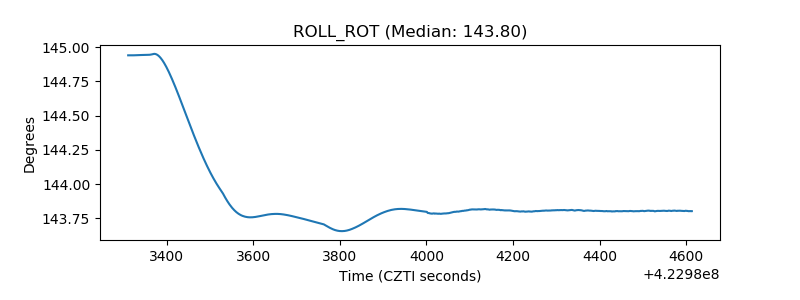 |
| _Roll_DEC | 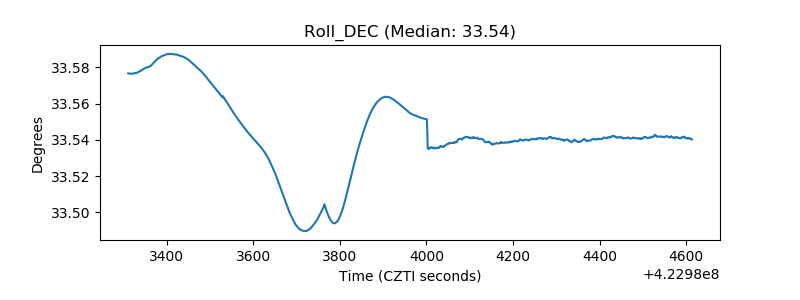 |
| _Roll_RA |  |
| Veto Counter | 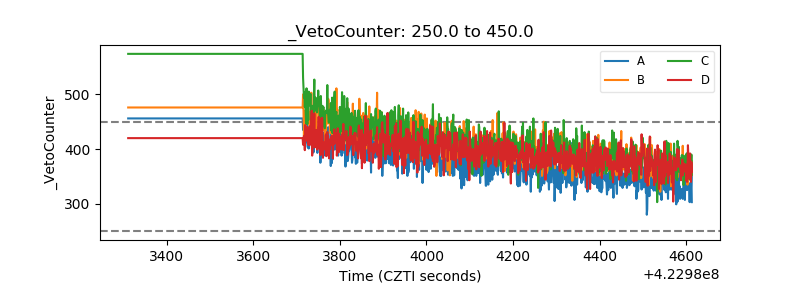 |