| Param | Original file | Final file |
|---|---|---|
| Filename | modeM0/AS1T05_100T01_9000005668_41443cztM0_level2.fits | modeM0/AS1T05_100T01_9000005668_41443cztM0_level2_quad_clean.evt |
| Size (bytes) | 316,664,640 | 88,332,480 |
| Size | 302.0 MB | 84.2 MB |
| Events in quadrant A | 2,875,010 | 599,336 |
| Events in quadrant B | 2,429,150 | 615,110 |
| Events in quadrant C | 3,321,162 | 552,107 |
| Events in quadrant D | 2,686,776 | 540,385 |
| Mode M9 | |||
|---|---|---|---|
| Quadrant | BADHDUFLAG | Total packets | Discarded packets |
| A | 0 | 31 | 0 |
| B | 0 | 31 | 0 |
| C | 0 | 31 | 0 |
| D | 0 | 32 | 0 |
| Mode SS | |||
|---|---|---|---|
| Quadrant | BADHDUFLAG | Total packets | Discarded packets |
| A | 0 | 106 | 0 |
| B | 0 | 106 | 0 |
| C | 0 | 106 | 0 |
| D | 0 | 106 | 0 |
| Mode M0 | |||
|---|---|---|---|
| Quadrant | BADHDUFLAG | Total packets | Discarded packets |
| A | 0 | 11767 | 3 |
| B | 0 | 10875 | 2 |
| C | 0 | 13246 | 2 |
| D | 0 | 11743 | 2 |
| Quadrant | Total seconds | Saturated seconds | Saturation percentage |
|---|---|---|---|
| A | 5255 | 16 | 0.304472% |
| B | 5255 | 19 | 0.361560% |
| C | 5255 | 324 | 6.165557% |
| D | 5255 | 54 | 1.027593% |
Noise dominated data is calculated using 1-second bins in cleaned event files. If a bin has >2000 counts, and if more than 50% of those come from <1% of pixels, then it is considered to be noise-dominated and hence unusable.
| Quadrant | # 1 sec bins | Bins with >0 counts | Bins with >2000 counts | High rate bins dominated by noise | Noise dominated (total time) | Noise dominated (detector-on time) | Marked lightcurve |
|---|---|---|---|---|---|---|---|
| A | 7077 | 5256 | 4 | 4 | 0.06% | 0.08% | 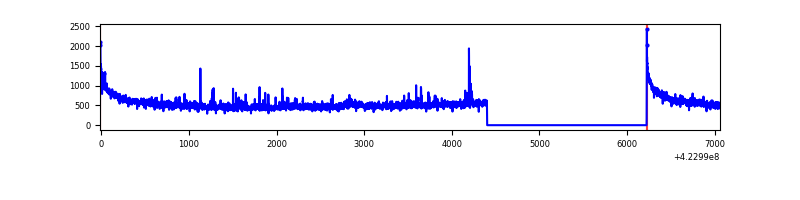 |
| B | 7077 | 5256 | 6 | 6 | 0.08% | 0.11% | 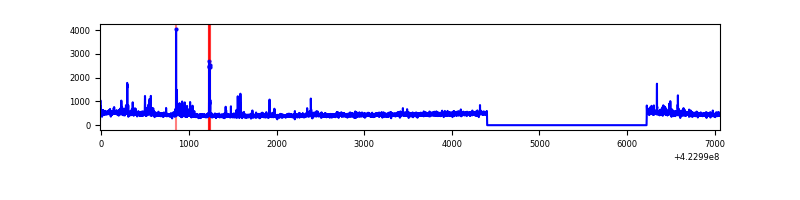 |
| C | 7077 | 5256 | 289 | 289 | 4.08% | 5.50% | 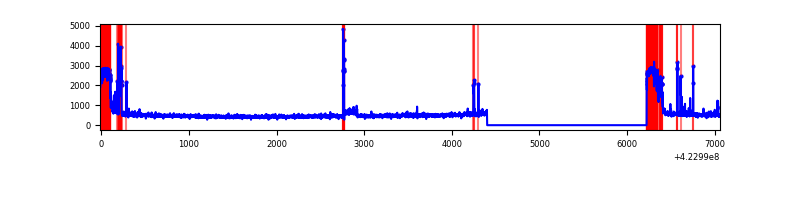 |
| D | 7077 | 5256 | 40 | 40 | 0.57% | 0.76% | 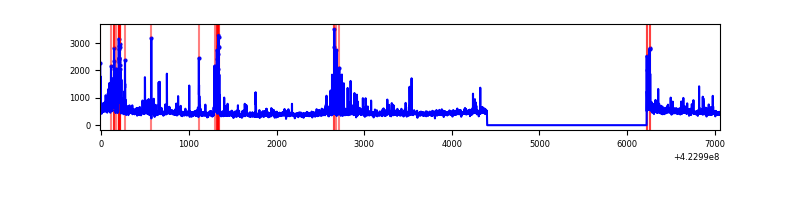 |
Top three noisy pixels from each quadrant. If the there are fewer than three noisy pixels in the level2.evt file, extra rows are filled as -1
| Pixel properties | Quadrant properties | ||||||
|---|---|---|---|---|---|---|---|
| Quadrant | DetID | PixID | Counts | Sigma | Mean | Median | Sigma |
| A | 10 | 83 | 529542 | 4442.88 | 579 | 566 | 119.1 |
| A | 2 | 79 | 49080 | 407.47 | 579 | 566 | 119.1 |
| A | 12 | 189 | 20239 | 165.23 | 579 | 566 | 119.1 |
| B | 0 | 190 | 66807 | 593.28 | 581 | 564 | 111.7 |
| B | 5 | 255 | 37985 | 335.15 | 581 | 564 | 111.7 |
| B | 0 | 186 | 15458 | 133.39 | 581 | 564 | 111.7 |
| C | 0 | 10 | 657317 | 5142.75 | 547 | 551 | 127.7 |
| C | 9 | 54 | 311099 | 2431.72 | 547 | 551 | 127.7 |
| C | 15 | 214 | 211207 | 1649.52 | 547 | 551 | 127.7 |
| D | 13 | 249 | 206624 | 1500.12 | 567 | 551 | 137.4 |
| D | 10 | 34 | 82416 | 595.94 | 567 | 551 | 137.4 |
| D | 1 | 52 | 65171 | 470.4 | 567 | 551 | 137.4 |
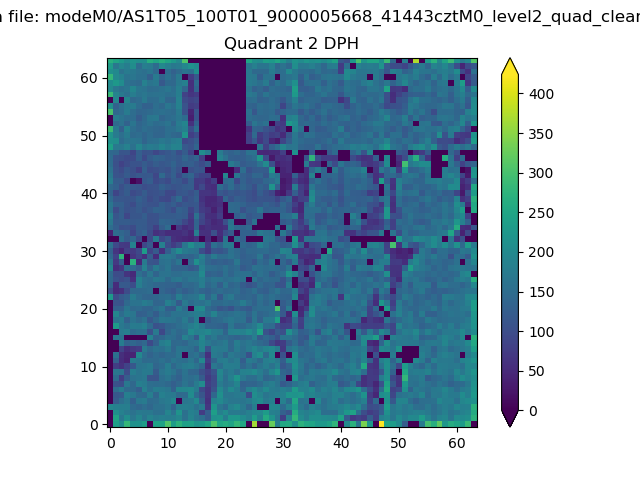
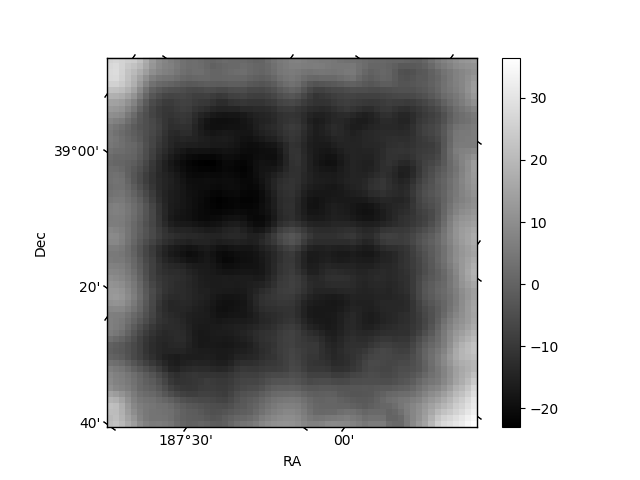
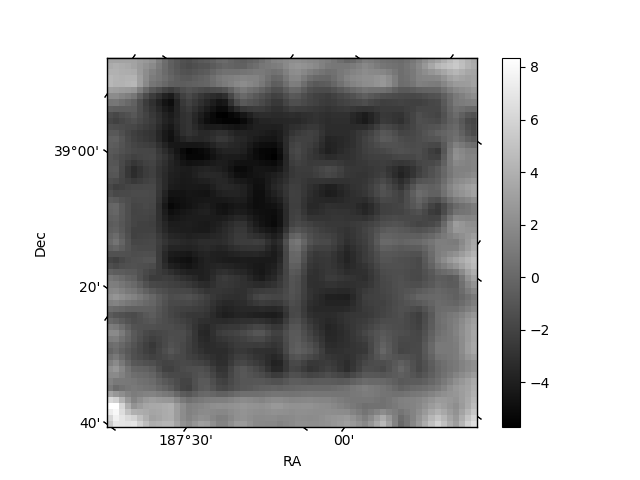
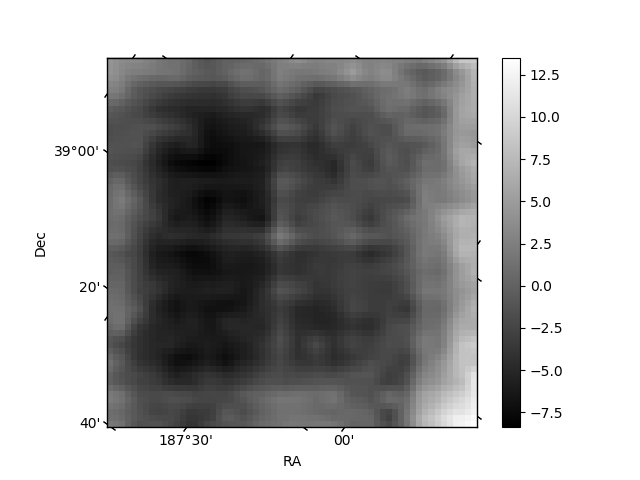
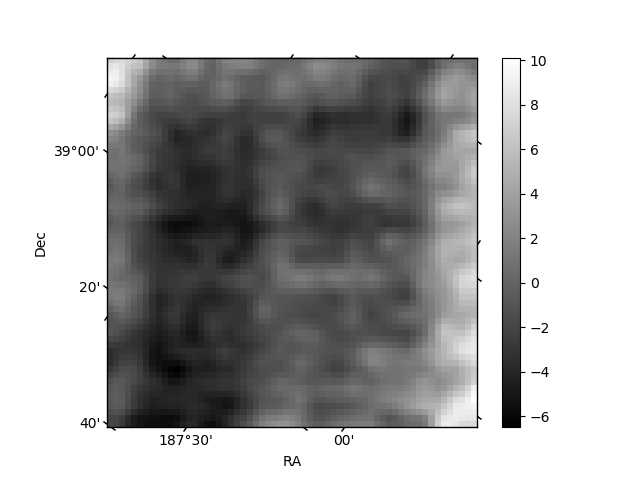
Histogram calculated using DETX and DETY for each event in the final _common_clean file
| Quadrant A | 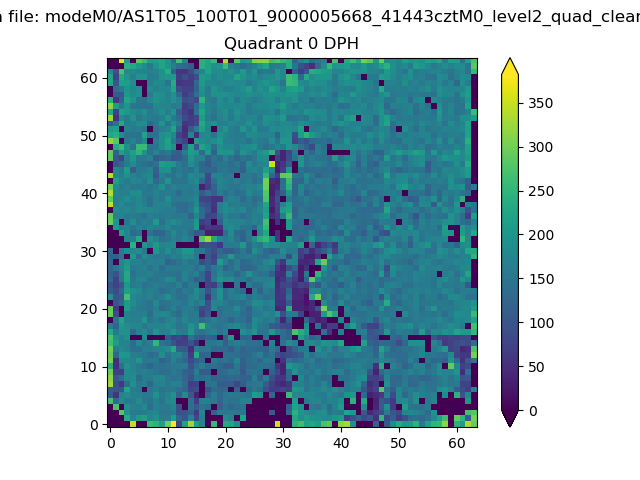 |
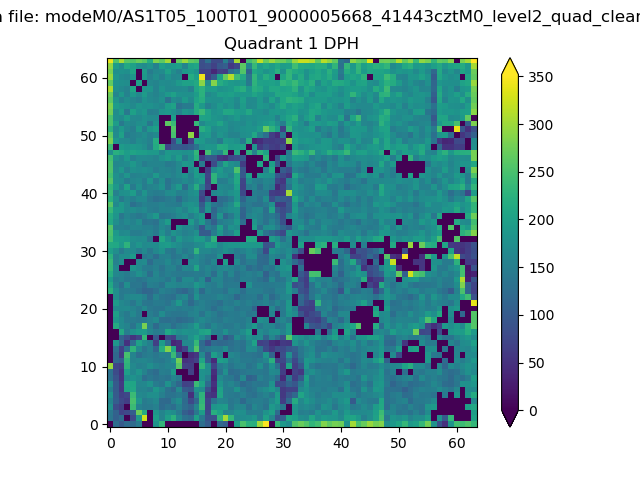 |
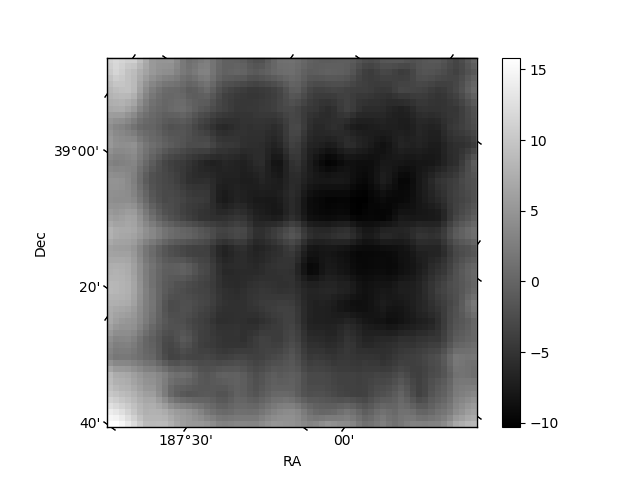
Quadrant B |
|---|---|---|---|
| Quadrant D | 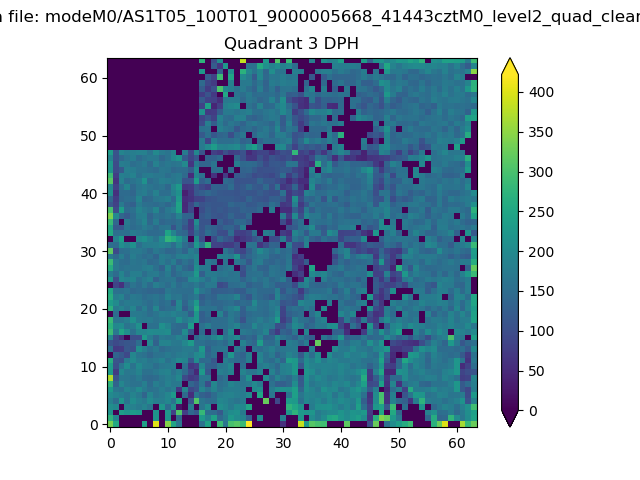 |
 |
Quadrant C |
| Plot type | Count rate plots | Images |
|---|---|---|
| Comparison with Poisson distribution Blue bars denote a histogram of data divided into 1 sec bins. Red curve is a Poisson curve with rate = median count rate of data. |
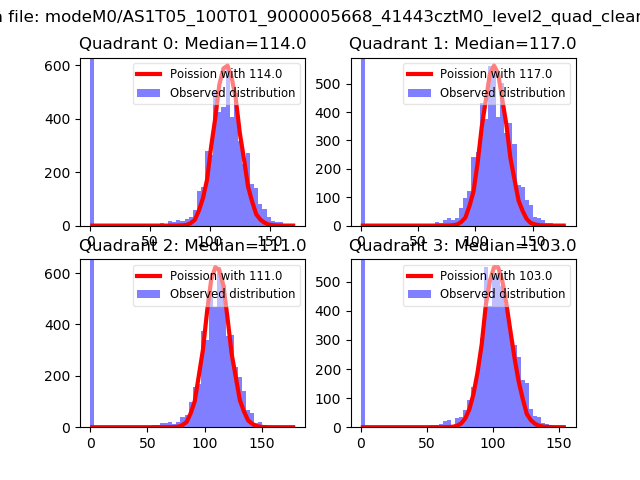 |
 |
| Quadrant-wise count rates Data is divided into 100 sec bins |
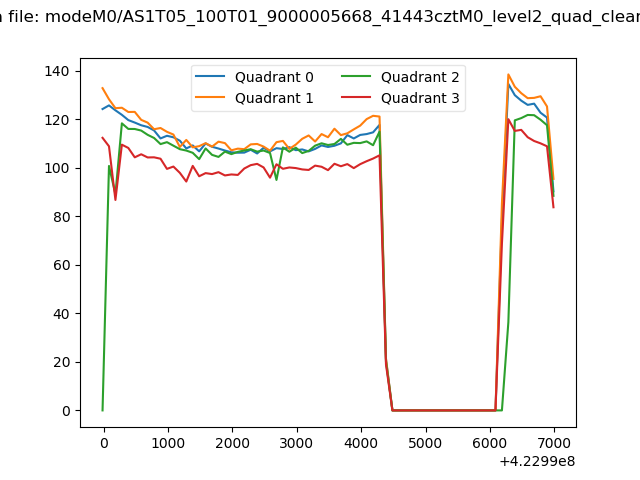 |
|
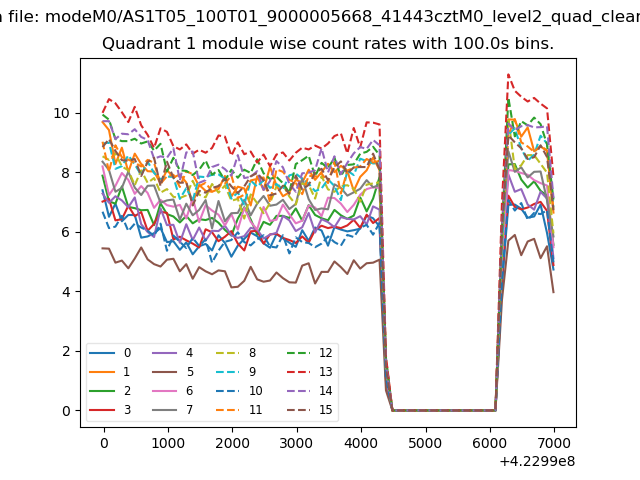
| Module-wise count rates for Quadrant A Data is divided into 100 sec bins |
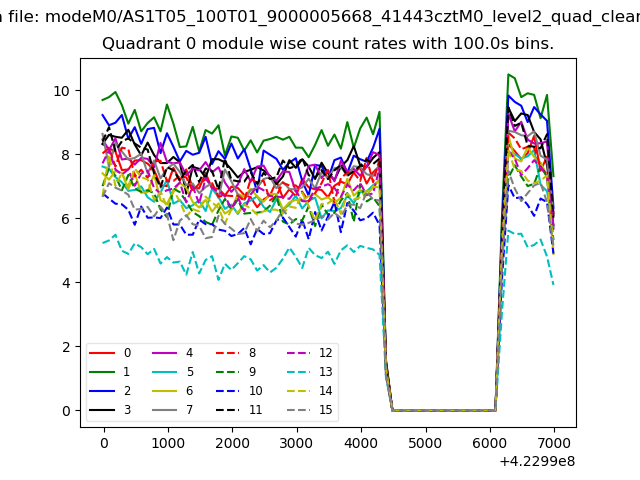 |
 |
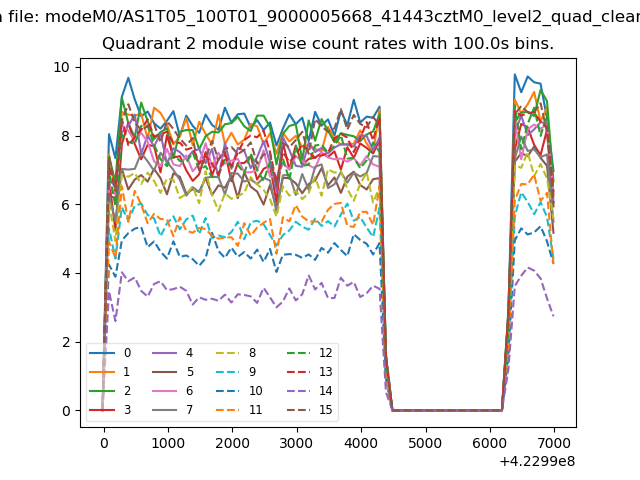
| Module-wise count rates for Quadrant B Data is divided into 100 sec bins |
 |
 |
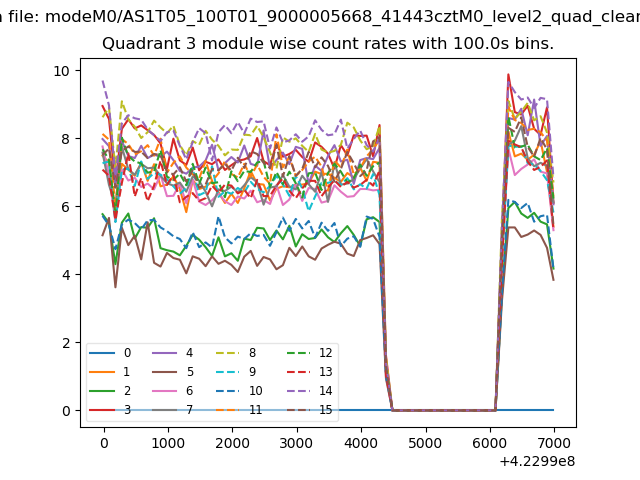
| Module-wise count rates for Quadrant C Data is divided into 100 sec bins |
 |
 |
| Module-wise count rates for Quadrant D Data is divided into 100 sec bins |
 |
 |
| Parameter | Plot |
|---|---|
| CZT HV Monitor | 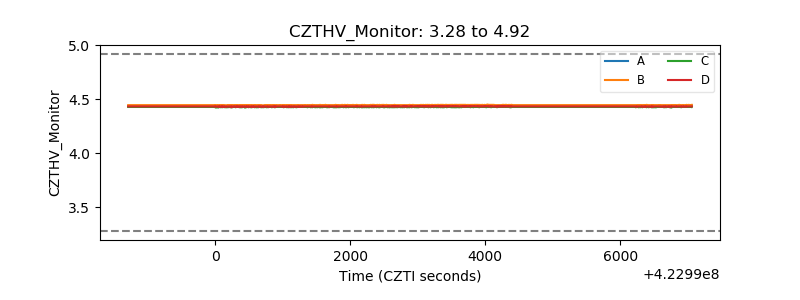 |
| D_VDD | 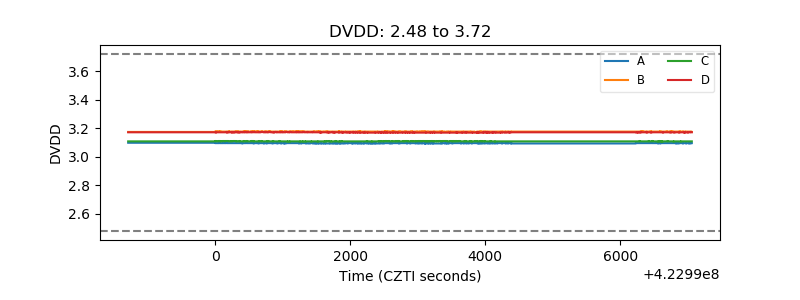 |
| Temperature 1 | 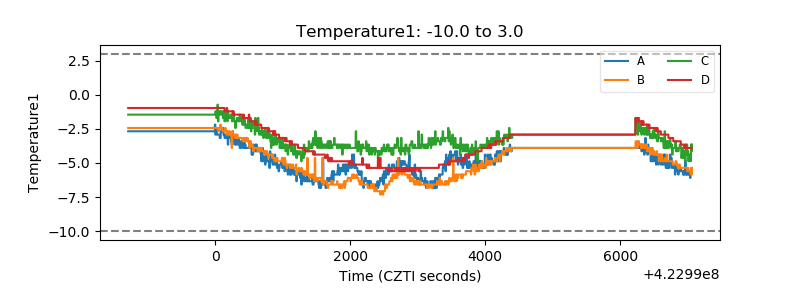 |
| Veto HV Monitor | 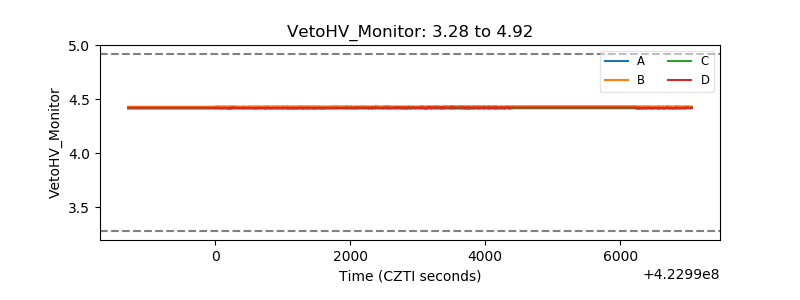 |
| Veto LLD | 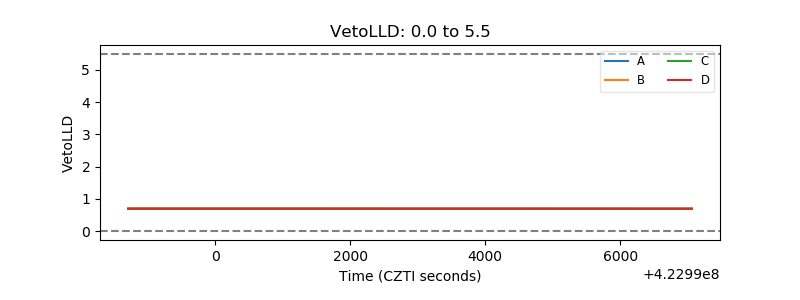 |
| Alpha Counter | 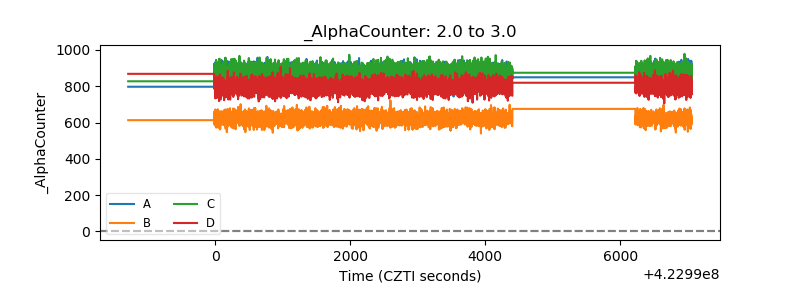 |
| _CPM_Rate | 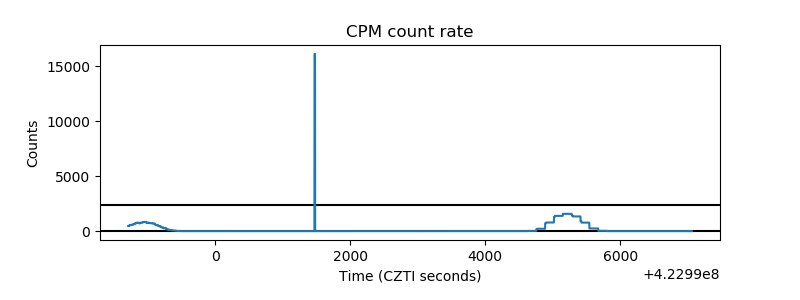 |
| CZT Counter | 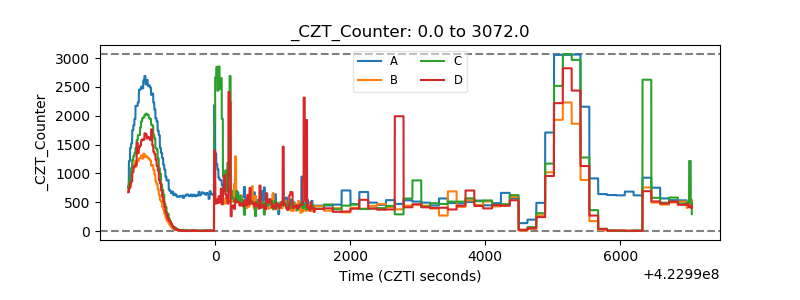 |
| +2.5 Volts monitor |  |
| +5 Volts monitor | 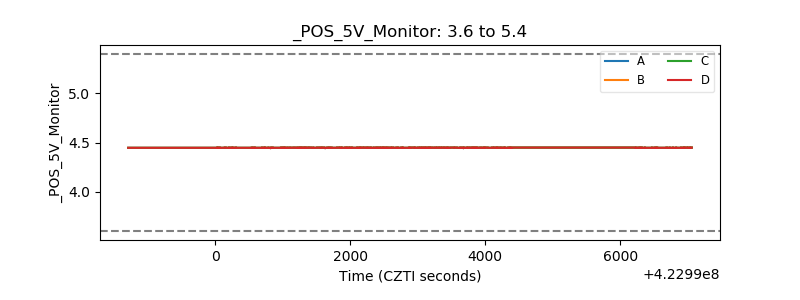 |
| _ROLL_ROT | 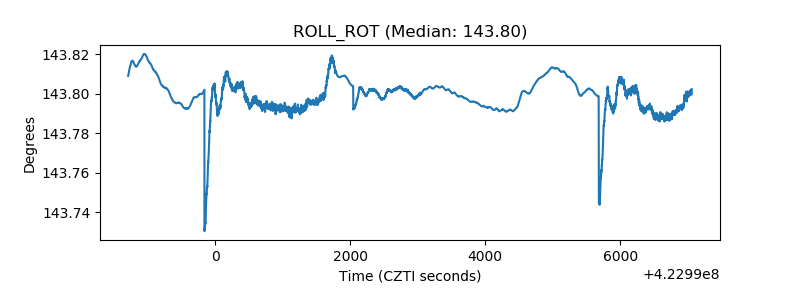 |
| _Roll_DEC | 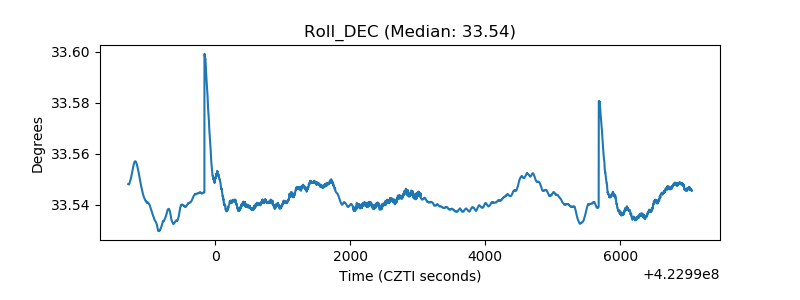 |
| _Roll_RA | 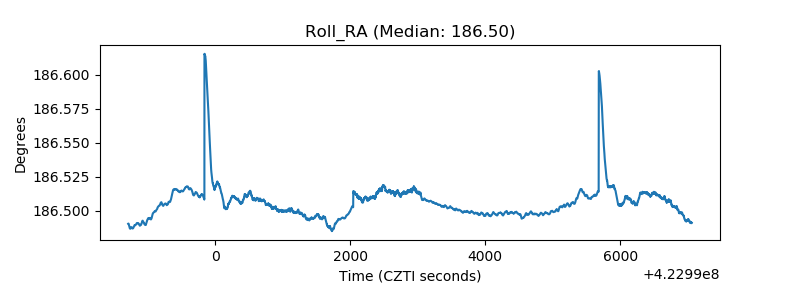 |
| Veto Counter | 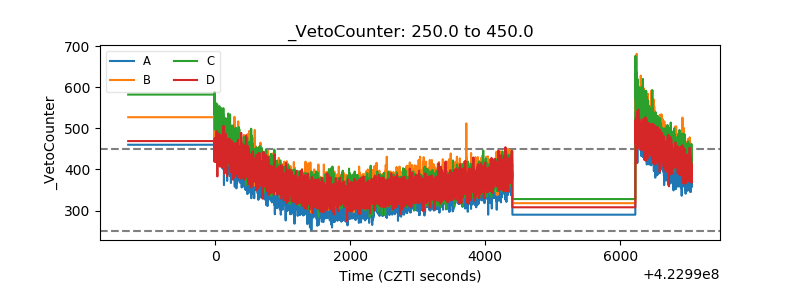 |