| Param | Original file | Final file |
|---|---|---|
| Filename | modeM0/AS1T05_100T01_9000005668_41444cztM0_level2.fits | modeM0/AS1T05_100T01_9000005668_41444cztM0_level2_quad_clean.evt |
| Size (bytes) | 320,221,440 | 89,291,520 |
| Size | 305.4 MB | 85.2 MB |
| Events in quadrant A | 2,835,665 | 606,308 |
| Events in quadrant B | 2,363,691 | 628,653 |
| Events in quadrant C | 3,573,062 | 562,458 |
| Events in quadrant D | 2,677,885 | 543,955 |
| Mode M9 | |||
|---|---|---|---|
| Quadrant | BADHDUFLAG | Total packets | Discarded packets |
| A | 0 | 30 | 0 |
| B | 0 | 30 | 0 |
| C | 0 | 30 | 0 |
| D | 0 | 31 | 0 |
| Mode SS | |||
|---|---|---|---|
| Quadrant | BADHDUFLAG | Total packets | Discarded packets |
| A | 0 | 106 | 0 |
| B | 0 | 106 | 0 |
| C | 0 | 106 | 0 |
| D | 0 | 106 | 0 |
| Mode M0 | |||
|---|---|---|---|
| Quadrant | BADHDUFLAG | Total packets | Discarded packets |
| A | 0 | 11484 | 3 |
| B | 0 | 10509 | 2 |
| C | 0 | 13692 | 2 |
| D | 0 | 11635 | 2 |
| Quadrant | Total seconds | Saturated seconds | Saturation percentage |
|---|---|---|---|
| A | 5172 | 12 | 0.232019% |
| B | 5172 | 8 | 0.154679% |
| C | 5172 | 337 | 6.515855% |
| D | 5172 | 88 | 1.701469% |
Noise dominated data is calculated using 1-second bins in cleaned event files. If a bin has >2000 counts, and if more than 50% of those come from <1% of pixels, then it is considered to be noise-dominated and hence unusable.
| Quadrant | # 1 sec bins | Bins with >0 counts | Bins with >2000 counts | High rate bins dominated by noise | Noise dominated (total time) | Noise dominated (detector-on time) | Marked lightcurve |
|---|---|---|---|---|---|---|---|
| A | 7115 | 5173 | 4 | 4 | 0.06% | 0.08% | 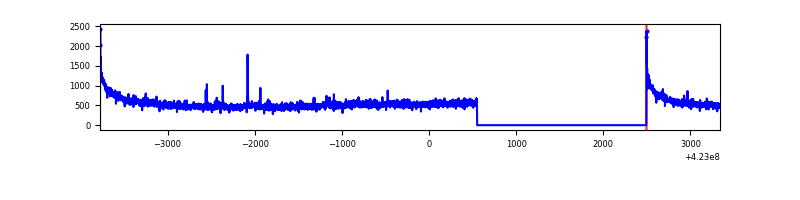 |
| B | 7115 | 5173 | 0 | 0 | 0.00% | 0.00% | 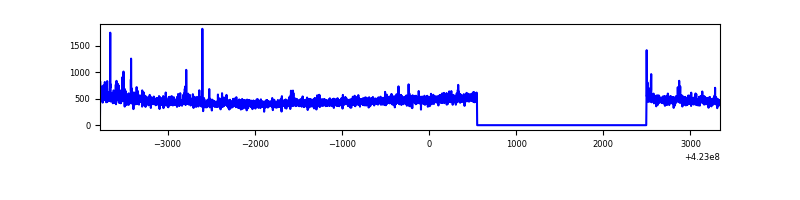 |
| C | 7115 | 5173 | 337 | 337 | 4.74% | 6.51% | 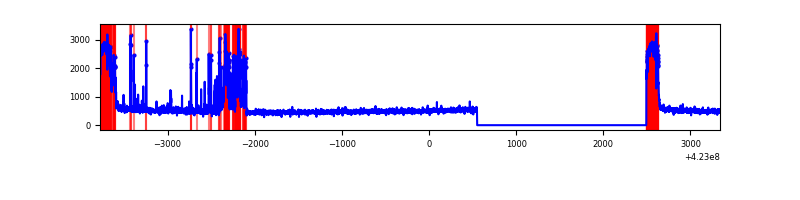 |
| D | 7115 | 5173 | 69 | 69 | 0.97% | 1.33% | 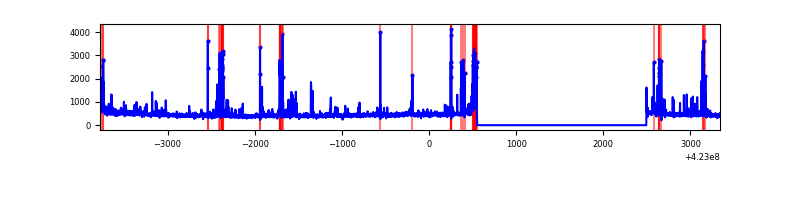 |
Top three noisy pixels from each quadrant. If the there are fewer than three noisy pixels in the level2.evt file, extra rows are filled as -1
| Pixel properties | Quadrant properties | ||||||
|---|---|---|---|---|---|---|---|
| Quadrant | DetID | PixID | Counts | Sigma | Mean | Median | Sigma |
| A | 10 | 83 | 500525 | 4180.57 | 581 | 570 | 119.6 |
| A | 12 | 189 | 55918 | 462.81 | 581 | 570 | 119.6 |
| A | 2 | 79 | 17382 | 140.58 | 581 | 570 | 119.6 |
| B | 0 | 190 | 52303 | 463.59 | 583 | 567 | 111.6 |
| B | 12 | 111 | 14018 | 120.53 | 583 | 567 | 111.6 |
| B | 11 | 111 | 12952 | 110.98 | 583 | 567 | 111.6 |
| C | 0 | 10 | 716725 | 5651.2 | 548 | 551 | 126.7 |
| C | 9 | 54 | 506509 | 3992.42 | 548 | 551 | 126.7 |
| C | 15 | 214 | 210754 | 1658.67 | 548 | 551 | 126.7 |
| D | 13 | 171 | 240744 | 1736.25 | 564 | 548 | 138.3 |
| D | 13 | 249 | 130101 | 936.47 | 564 | 548 | 138.3 |
| D | 1 | 47 | 39291 | 280.05 | 564 | 548 | 138.3 |
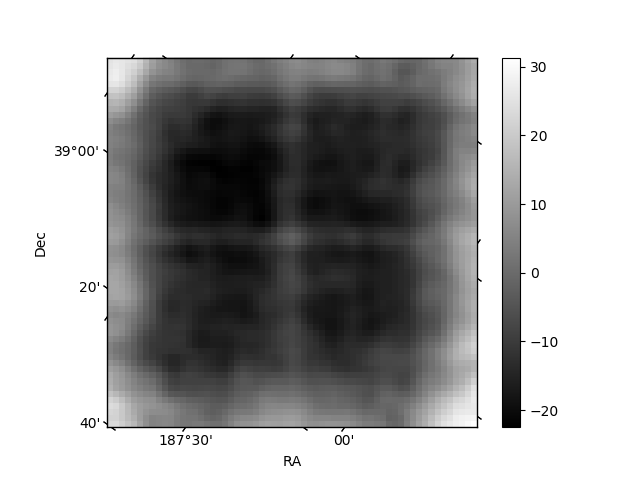
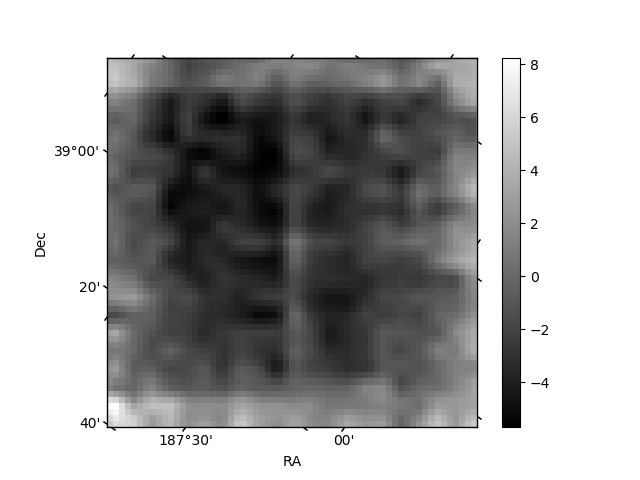
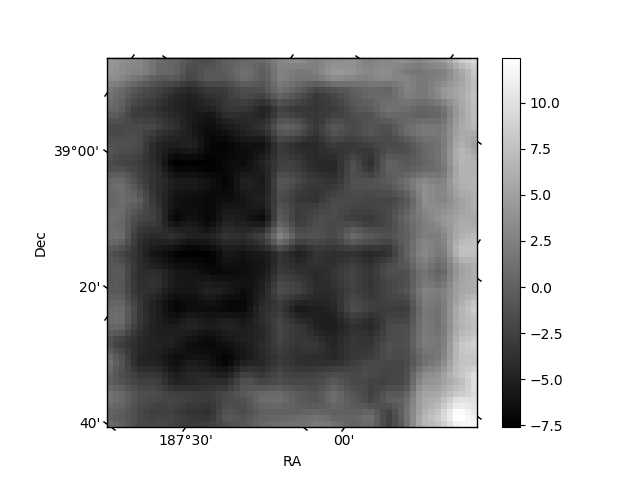
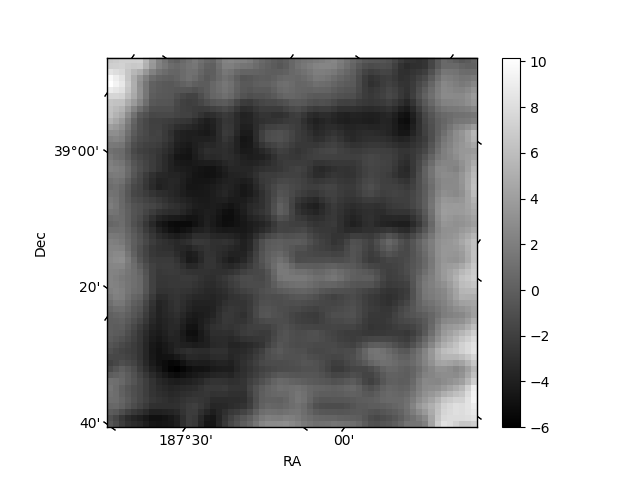
Histogram calculated using DETX and DETY for each event in the final _common_clean file
| Quadrant A | 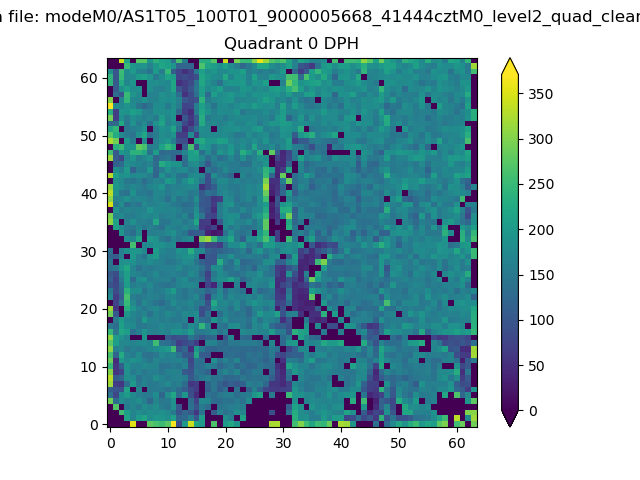 |
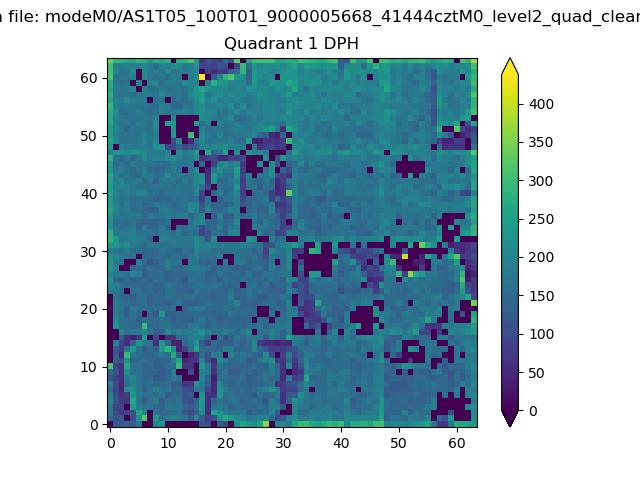 |
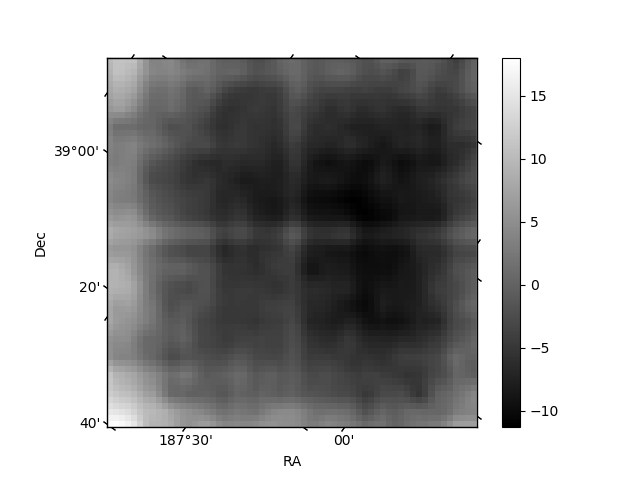
Quadrant B |
|---|---|---|---|
| Quadrant D | 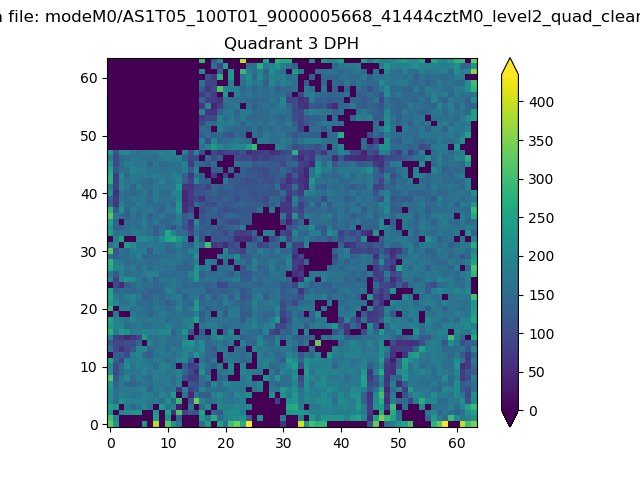 |
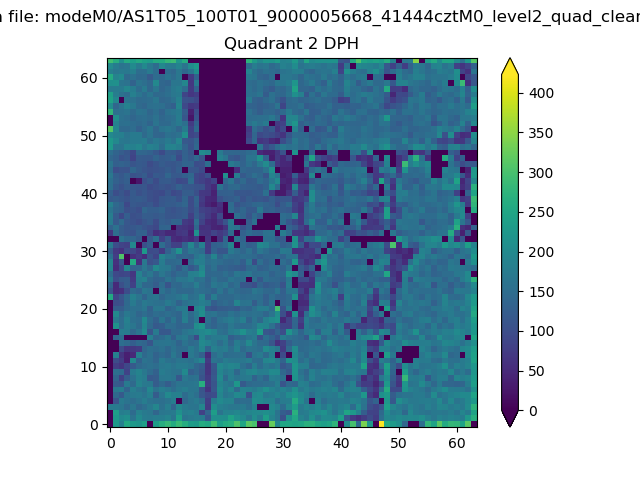 |
Quadrant C |
| Plot type | Count rate plots | Images |
|---|---|---|
| Comparison with Poisson distribution Blue bars denote a histogram of data divided into 1 sec bins. Red curve is a Poisson curve with rate = median count rate of data. |
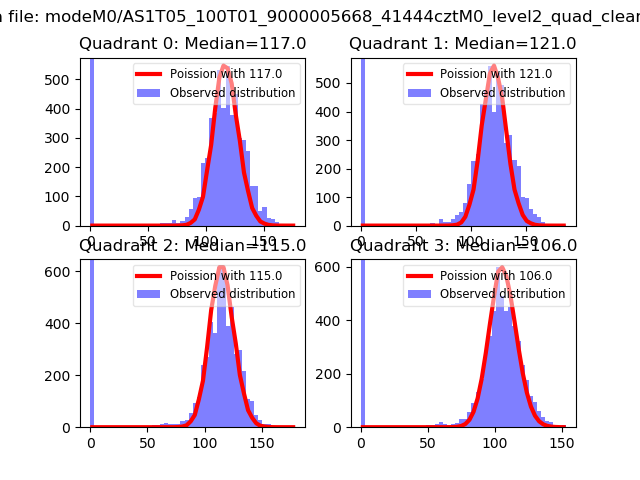 |
 |
| Quadrant-wise count rates Data is divided into 100 sec bins |
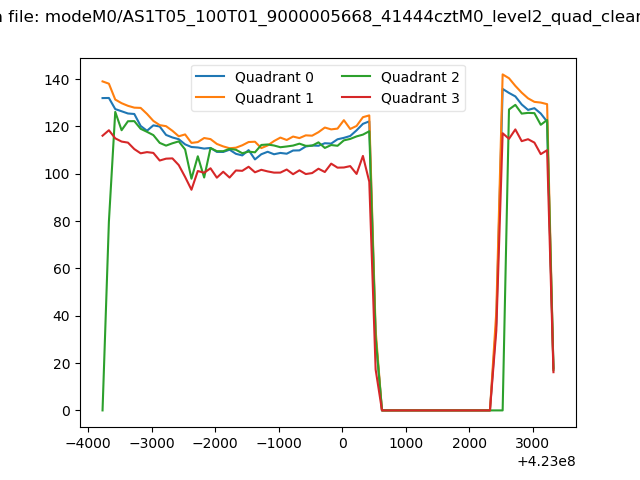 |
|
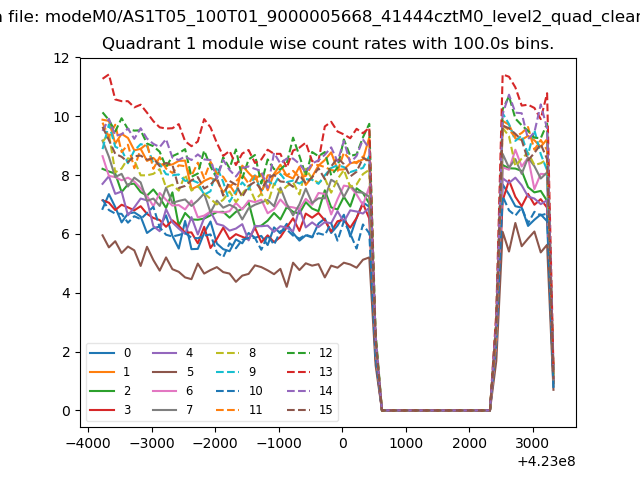
| Module-wise count rates for Quadrant A Data is divided into 100 sec bins |
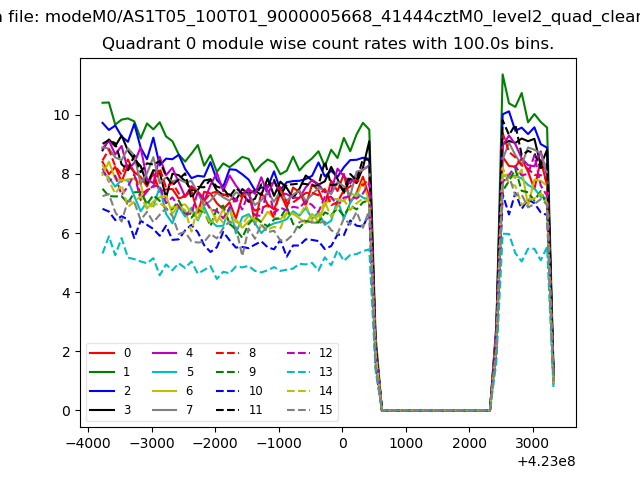 |
 |
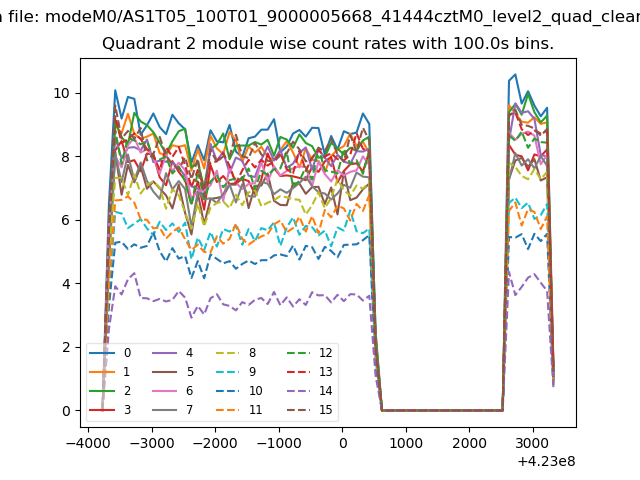
| Module-wise count rates for Quadrant B Data is divided into 100 sec bins |
 |
 |
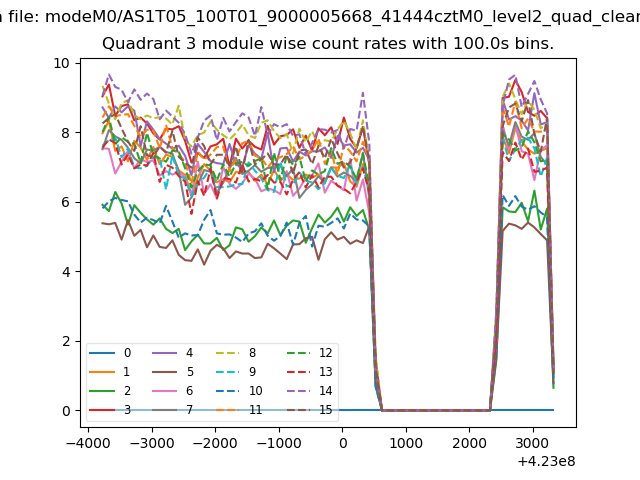
| Module-wise count rates for Quadrant C Data is divided into 100 sec bins |
 |
 |
| Module-wise count rates for Quadrant D Data is divided into 100 sec bins |
 |
 |
| Parameter | Plot |
|---|---|
| CZT HV Monitor | 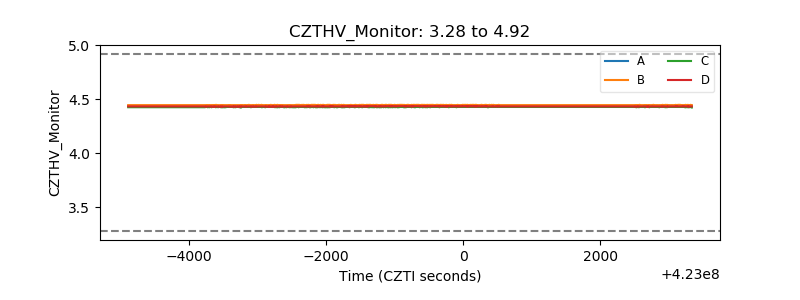 |
| D_VDD | 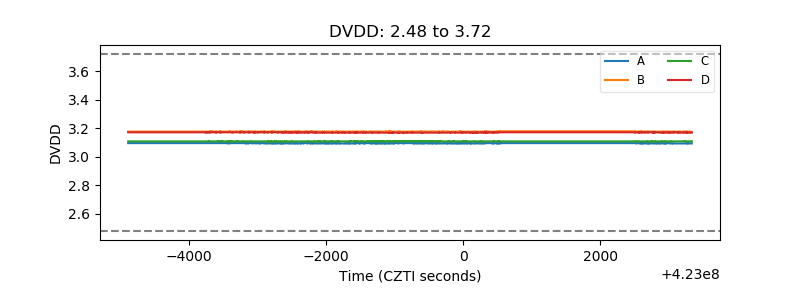 |
| Temperature 1 | 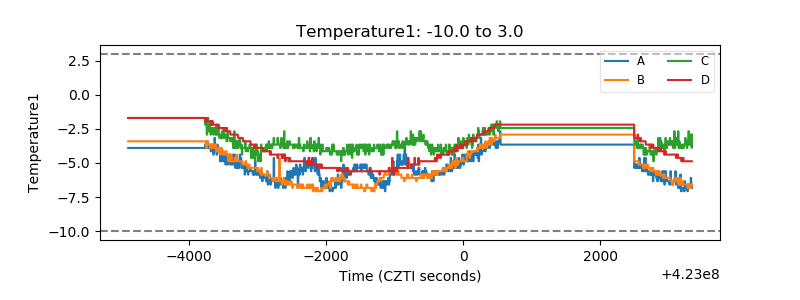 |
| Veto HV Monitor |  |
| Veto LLD | 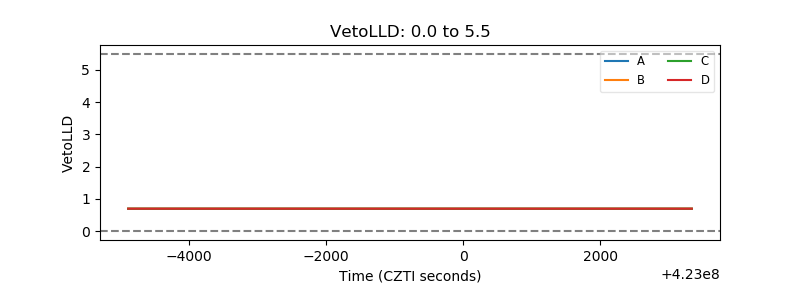 |
| Alpha Counter |  |
| _CPM_Rate | 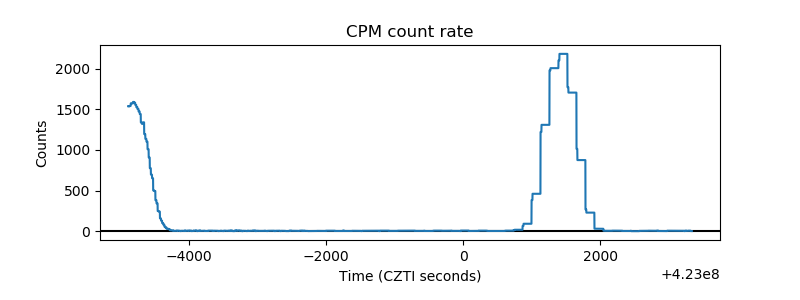 |
| CZT Counter | 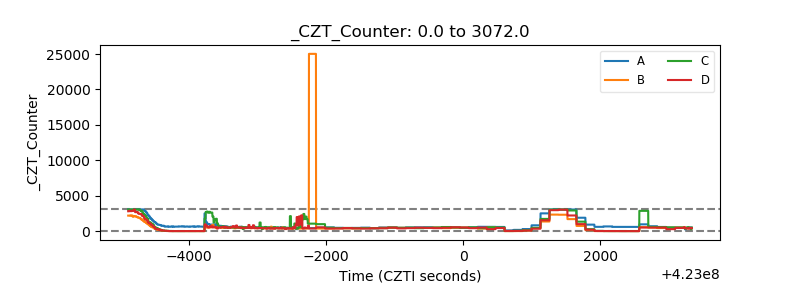 |
| +2.5 Volts monitor |  |
| +5 Volts monitor | 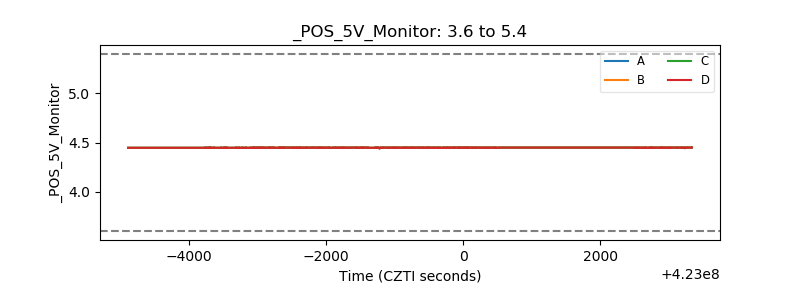 |
| _ROLL_ROT | 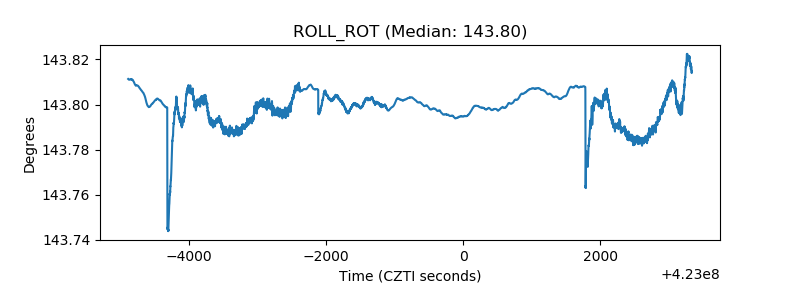 |
| _Roll_DEC | 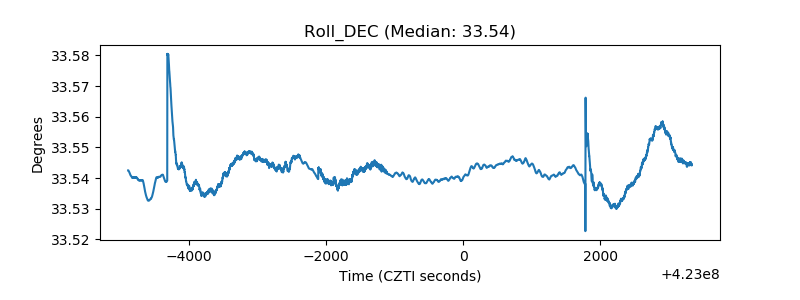 |
| _Roll_RA | 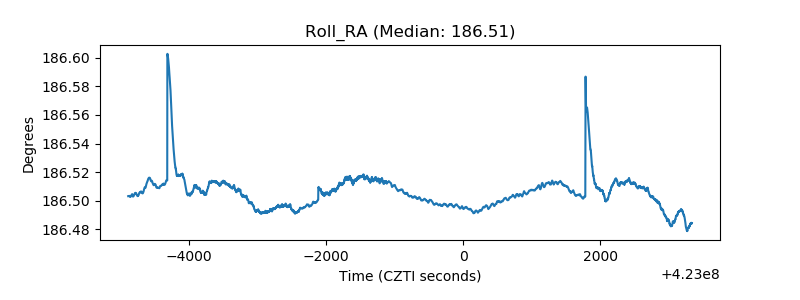 |
| Veto Counter | 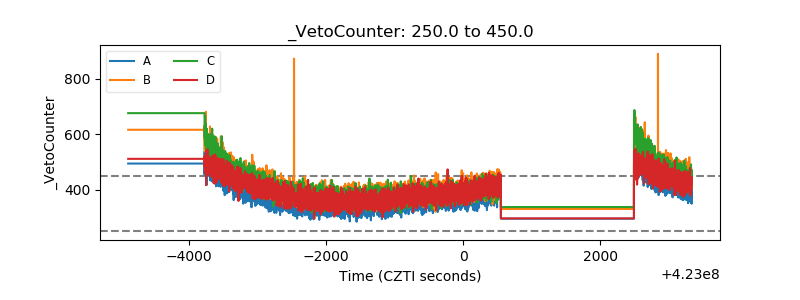 |