| Param | Original file | Final file |
|---|---|---|
| Filename | modeM0/AS1T05_100T01_9000005668_41445cztM0_level2.fits | modeM0/AS1T05_100T01_9000005668_41445cztM0_level2_quad_clean.evt |
| Size (bytes) | 302,489,280 | 88,076,160 |
| Size | 288.5 MB | 84.0 MB |
| Events in quadrant A | 2,724,126 | 601,834 |
| Events in quadrant B | 2,303,115 | 624,495 |
| Events in quadrant C | 3,045,074 | 556,369 |
| Events in quadrant D | 2,732,341 | 531,698 |
| Mode M9 | |||
|---|---|---|---|
| Quadrant | BADHDUFLAG | Total packets | Discarded packets |
| A | 0 | 30 | 0 |
| B | 0 | 30 | 0 |
| C | 0 | 30 | 0 |
| D | 0 | 31 | 0 |
| Mode SS | |||
|---|---|---|---|
| Quadrant | BADHDUFLAG | Total packets | Discarded packets |
| A | 0 | 102 | 0 |
| B | 0 | 102 | 0 |
| C | 0 | 102 | 0 |
| D | 0 | 102 | 0 |
| Mode M0 | |||
|---|---|---|---|
| Quadrant | BADHDUFLAG | Total packets | Discarded packets |
| A | 0 | 11084 | 3 |
| B | 0 | 10163 | 2 |
| C | 0 | 12048 | 2 |
| D | 0 | 11631 | 2 |
| Quadrant | Total seconds | Saturated seconds | Saturation percentage |
|---|---|---|---|
| A | 5032 | 12 | 0.238474% |
| B | 5032 | 9 | 0.178855% |
| C | 5032 | 271 | 5.385533% |
| D | 5032 | 118 | 2.344992% |
Noise dominated data is calculated using 1-second bins in cleaned event files. If a bin has >2000 counts, and if more than 50% of those come from <1% of pixels, then it is considered to be noise-dominated and hence unusable.
| Quadrant | # 1 sec bins | Bins with >0 counts | Bins with >2000 counts | High rate bins dominated by noise | Noise dominated (total time) | Noise dominated (detector-on time) | Marked lightcurve |
|---|---|---|---|---|---|---|---|
| A | 7095 | 5033 | 5 | 5 | 0.07% | 0.10% | 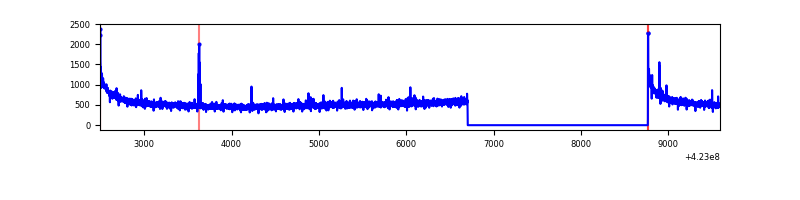 |
| B | 7095 | 5033 | 1 | 1 | 0.01% | 0.02% | 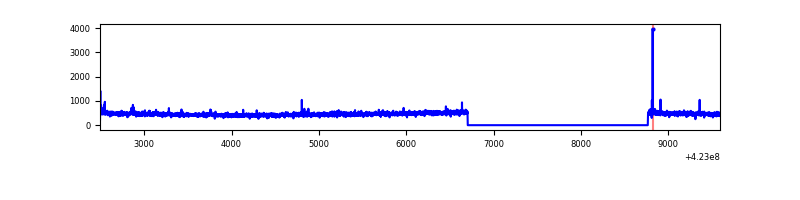 |
| C | 7095 | 5033 | 256 | 256 | 3.61% | 5.09% | 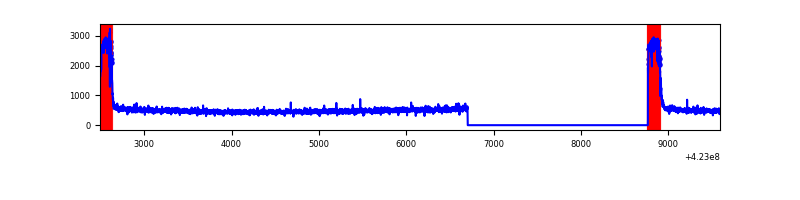 |
| D | 7095 | 5033 | 102 | 102 | 1.44% | 2.03% | 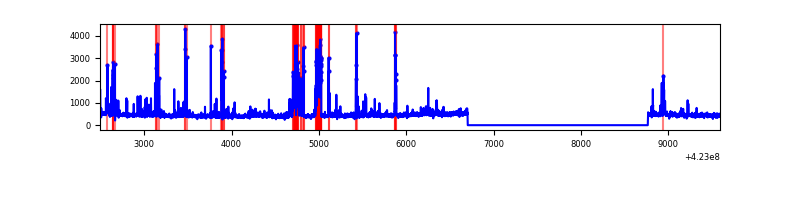 |
Top three noisy pixels from each quadrant. If the there are fewer than three noisy pixels in the level2.evt file, extra rows are filled as -1
| Pixel properties | Quadrant properties | ||||||
|---|---|---|---|---|---|---|---|
| Quadrant | DetID | PixID | Counts | Sigma | Mean | Median | Sigma |
| A | 10 | 83 | 477300 | 4041.93 | 573 | 563 | 117.9 |
| A | 13 | 248 | 15260 | 124.61 | 573 | 563 | 117.9 |
| A | 2 | 79 | 11395 | 91.84 | 573 | 563 | 117.9 |
| B | 0 | 190 | 24425 | 218.31 | 575 | 561 | 109.3 |
| B | 12 | 111 | 13658 | 119.81 | 575 | 561 | 109.3 |
| B | 11 | 111 | 12841 | 112.34 | 575 | 561 | 109.3 |
| C | 0 | 10 | 730957 | 5805.65 | 540 | 545 | 125.8 |
| C | 15 | 214 | 204554 | 1621.56 | 540 | 545 | 125.8 |
| C | 13 | 61 | 3657 | 24.74 | 540 | 545 | 125.8 |
| D | 13 | 249 | 334918 | 2477.89 | 552 | 536 | 134.9 |
| D | 13 | 171 | 124082 | 915.52 | 552 | 536 | 134.9 |
| D | 1 | 47 | 107961 | 796.06 | 552 | 536 | 134.9 |
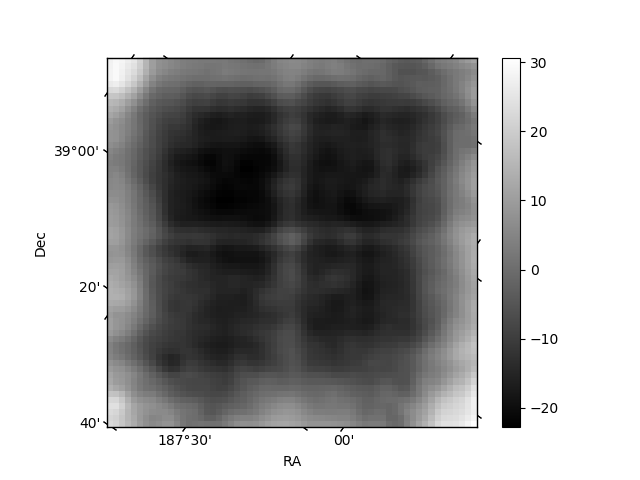
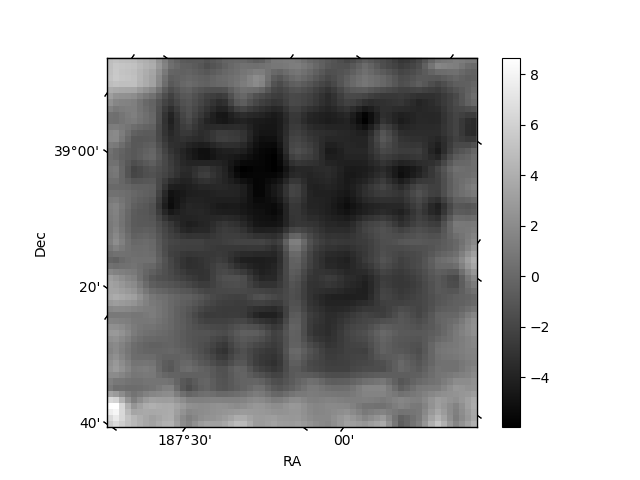
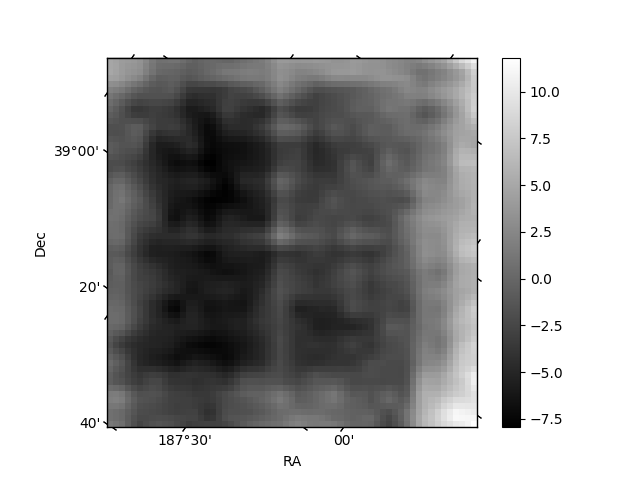
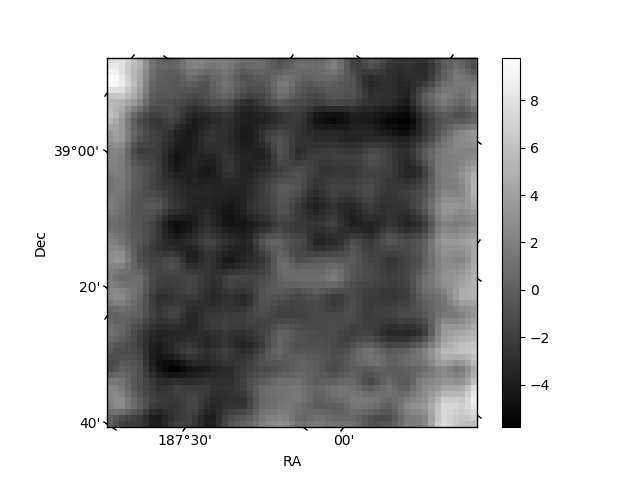
Histogram calculated using DETX and DETY for each event in the final _common_clean file
| Quadrant A | 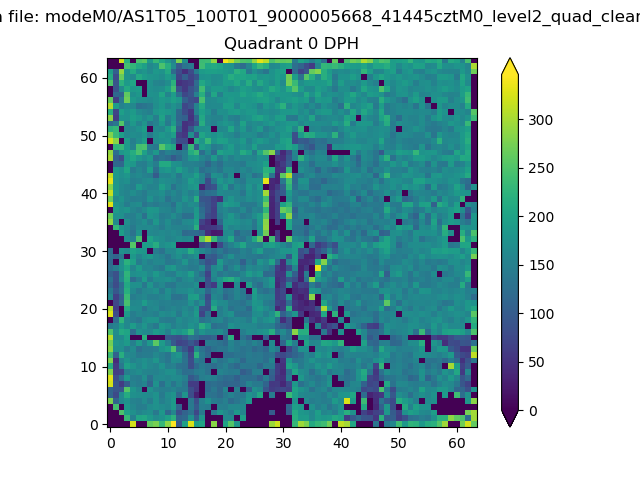 |
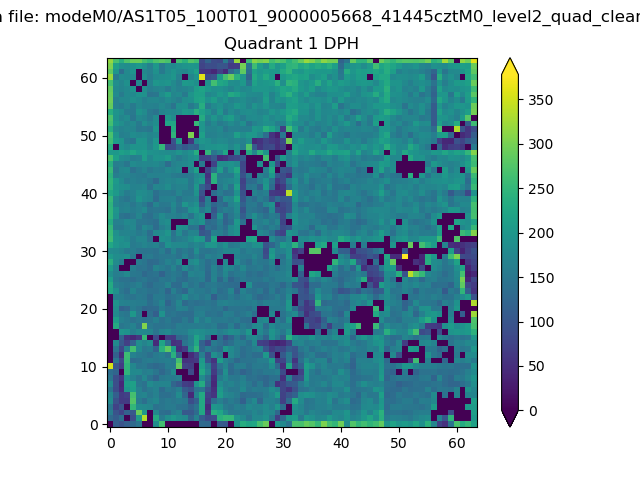 |
Quadrant B |
|---|---|---|---|
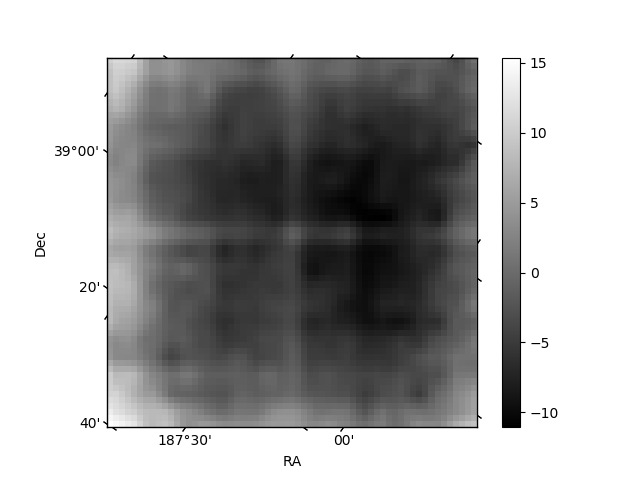
| Quadrant D | 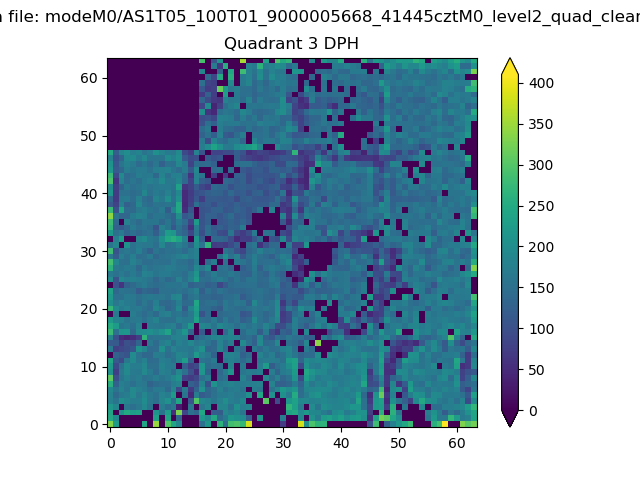 |
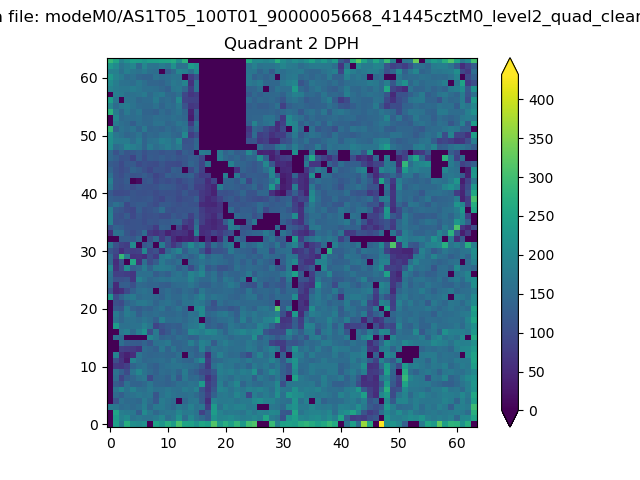 |
Quadrant C |
| Plot type | Count rate plots | Images |
|---|---|---|
| Comparison with Poisson distribution Blue bars denote a histogram of data divided into 1 sec bins. Red curve is a Poisson curve with rate = median count rate of data. |
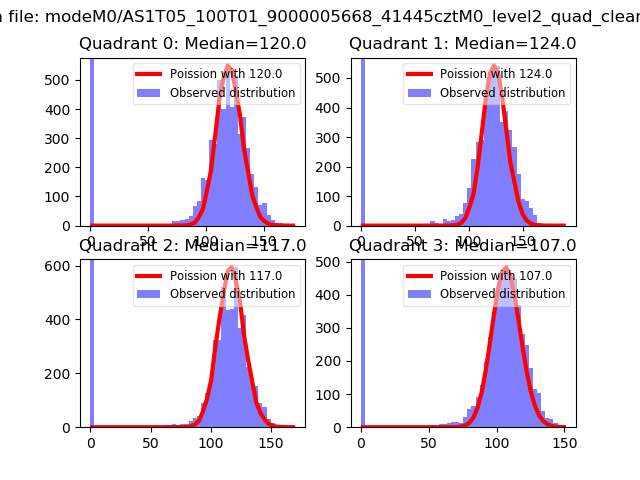 |
 |
| Quadrant-wise count rates Data is divided into 100 sec bins |
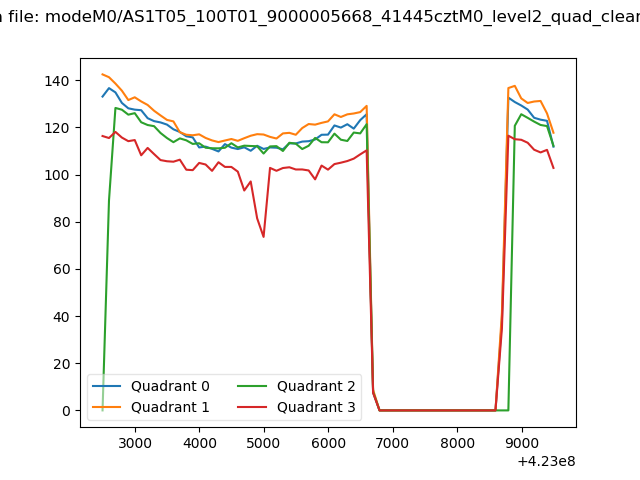 |
|
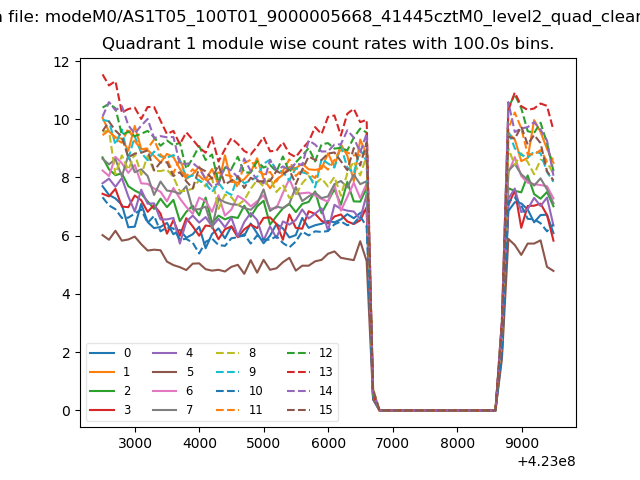
| Module-wise count rates for Quadrant A Data is divided into 100 sec bins |
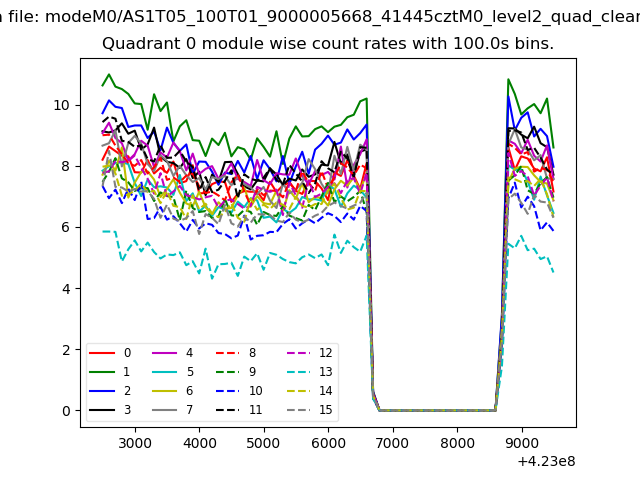 |
 |
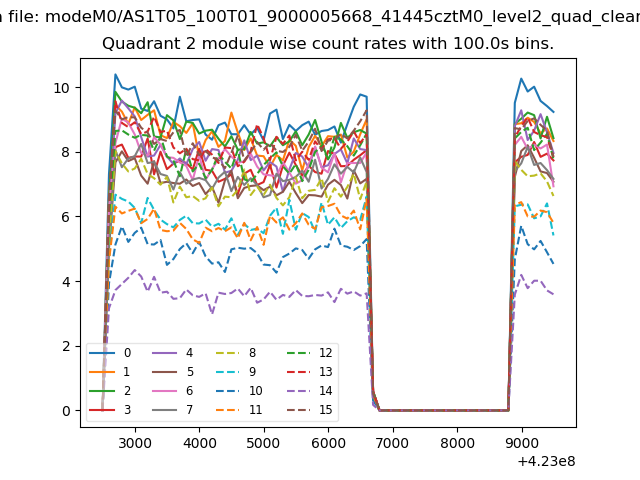
| Module-wise count rates for Quadrant B Data is divided into 100 sec bins |
 |
 |
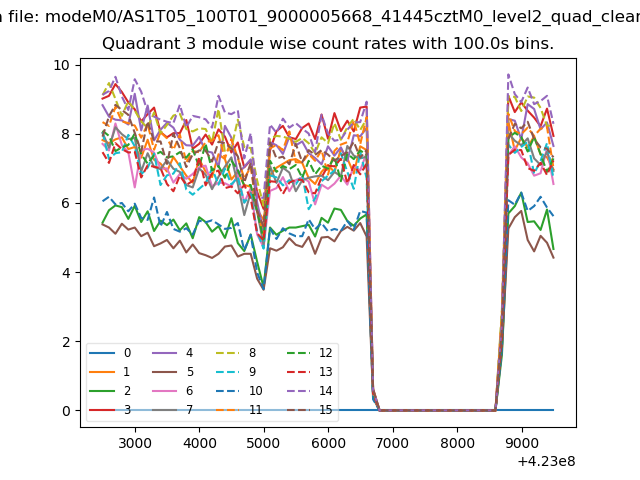
| Module-wise count rates for Quadrant C Data is divided into 100 sec bins |
 |
 |
| Module-wise count rates for Quadrant D Data is divided into 100 sec bins |
 |
 |
| Parameter | Plot |
|---|---|
| CZT HV Monitor |  |
| D_VDD | 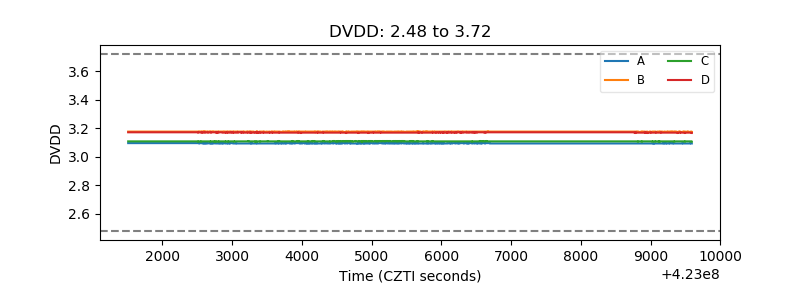 |
| Temperature 1 | 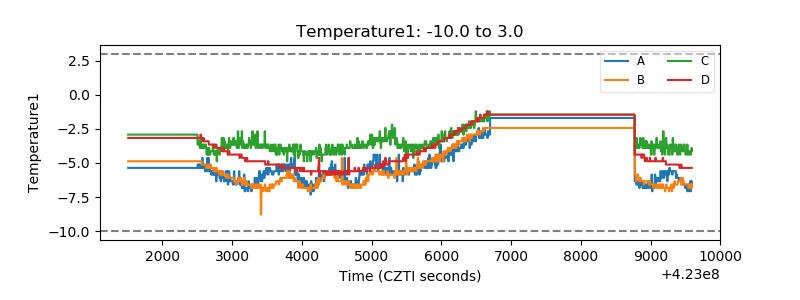 |
| Veto HV Monitor | 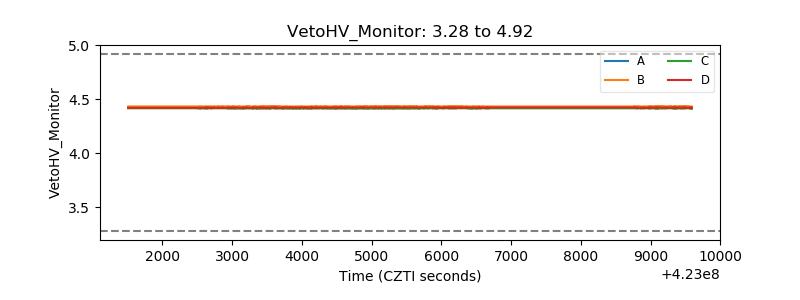 |
| Veto LLD | 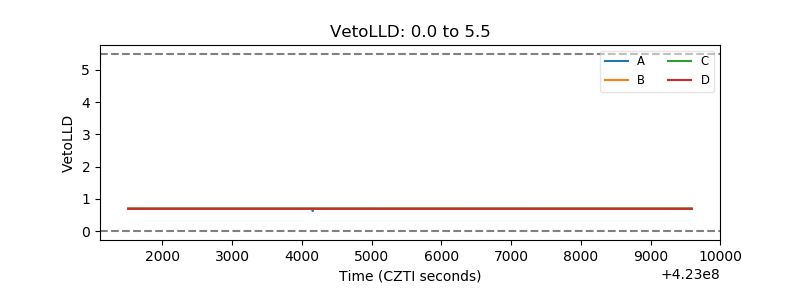 |
| Alpha Counter | 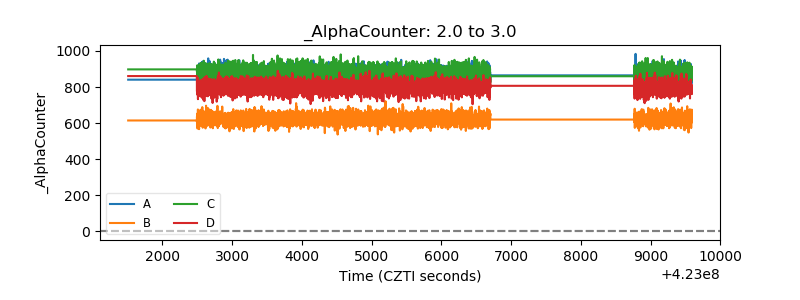 |
| _CPM_Rate | 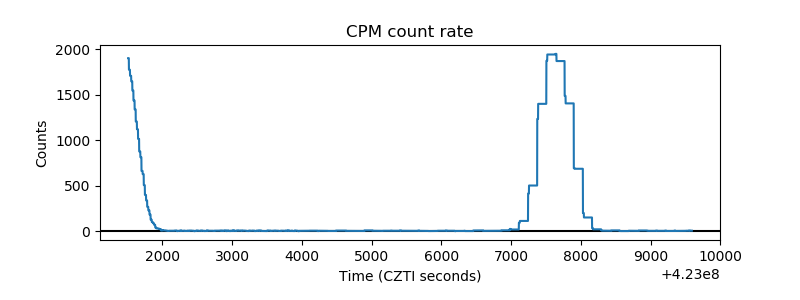 |
| CZT Counter | 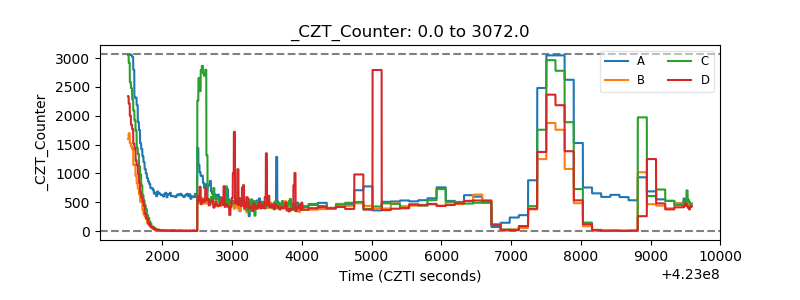 |
| +2.5 Volts monitor | 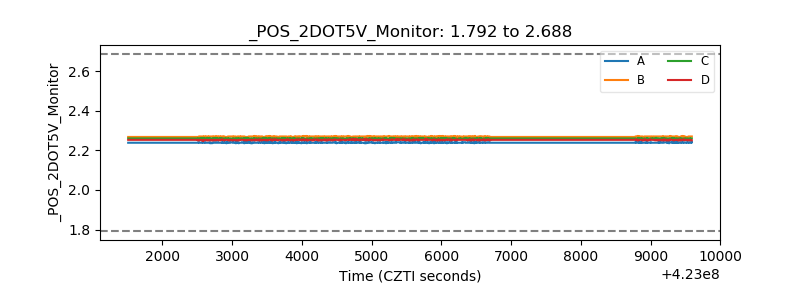 |
| +5 Volts monitor |  |
| _ROLL_ROT | 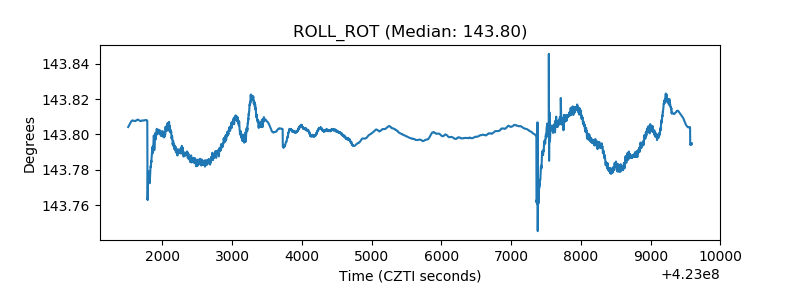 |
| _Roll_DEC | 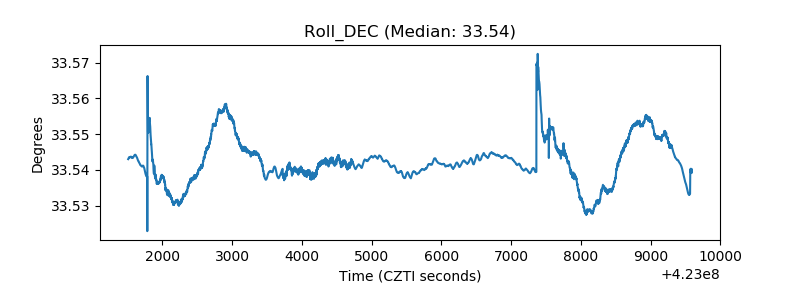 |
| _Roll_RA | 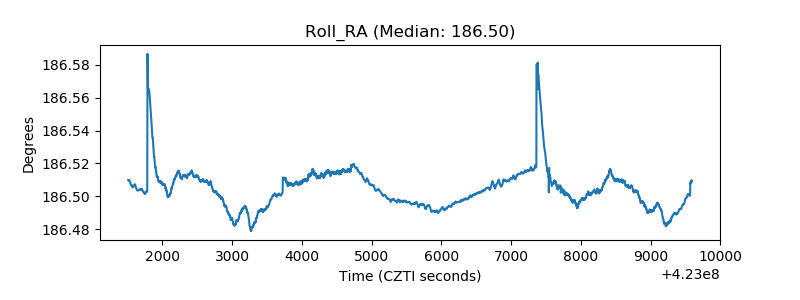 |
| Veto Counter | 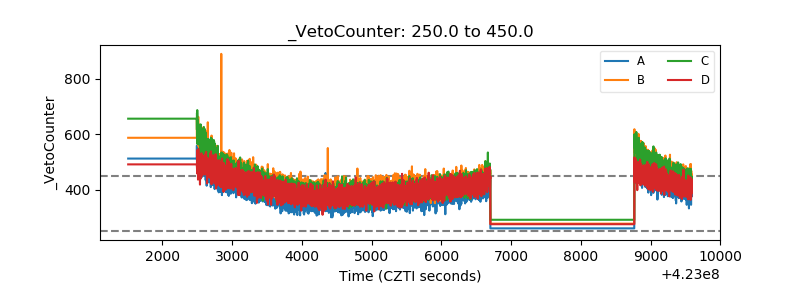 |