| Param | Original file | Final file |
|---|---|---|
| Filename | modeM0/AS1T05_100T01_9000005668_41446cztM0_level2.fits | modeM0/AS1T05_100T01_9000005668_41446cztM0_level2_quad_clean.evt |
| Size (bytes) | 301,602,240 | 83,980,800 |
| Size | 287.6 MB | 80.1 MB |
| Events in quadrant A | 2,956,246 | 569,033 |
| Events in quadrant B | 2,287,997 | 592,271 |
| Events in quadrant C | 3,014,213 | 530,966 |
| Events in quadrant D | 2,526,677 | 509,449 |
| Mode M9 | |||
|---|---|---|---|
| Quadrant | BADHDUFLAG | Total packets | Discarded packets |
| A | 0 | 39 | 0 |
| B | 0 | 39 | 0 |
| C | 0 | 39 | 0 |
| D | 0 | 40 | 0 |
| Mode SS | |||
|---|---|---|---|
| Quadrant | BADHDUFLAG | Total packets | Discarded packets |
| A | 0 | 100 | 0 |
| B | 0 | 100 | 0 |
| C | 0 | 100 | 0 |
| D | 0 | 100 | 0 |
| Mode M0 | |||
|---|---|---|---|
| Quadrant | BADHDUFLAG | Total packets | Discarded packets |
| A | 0 | 11820 | 3 |
| B | 0 | 10037 | 2 |
| C | 0 | 11842 | 2 |
| D | 0 | 10934 | 2 |
| Quadrant | Total seconds | Saturated seconds | Saturation percentage |
|---|---|---|---|
| A | 4862 | 47 | 0.966680% |
| B | 4862 | 39 | 0.802139% |
| C | 4862 | 277 | 5.697244% |
| D | 4862 | 45 | 0.925545% |
Noise dominated data is calculated using 1-second bins in cleaned event files. If a bin has >2000 counts, and if more than 50% of those come from <1% of pixels, then it is considered to be noise-dominated and hence unusable.
| Quadrant | # 1 sec bins | Bins with >0 counts | Bins with >2000 counts | High rate bins dominated by noise | Noise dominated (total time) | Noise dominated (detector-on time) | Marked lightcurve |
|---|---|---|---|---|---|---|---|
| A | 6984 | 4863 | 25 | 25 | 0.36% | 0.51% | 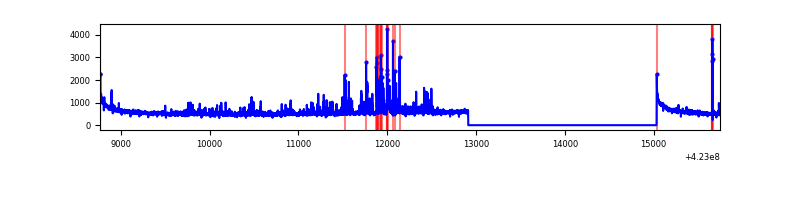 |
| B | 6984 | 4863 | 19 | 19 | 0.27% | 0.39% | 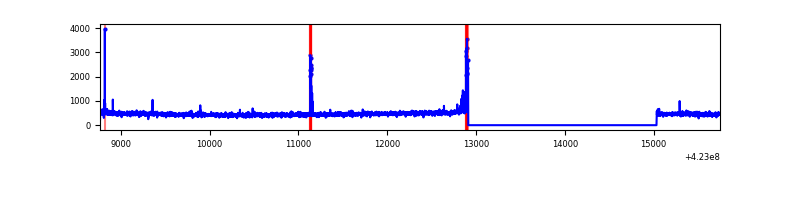 |
| C | 6984 | 4863 | 278 | 278 | 3.98% | 5.72% | 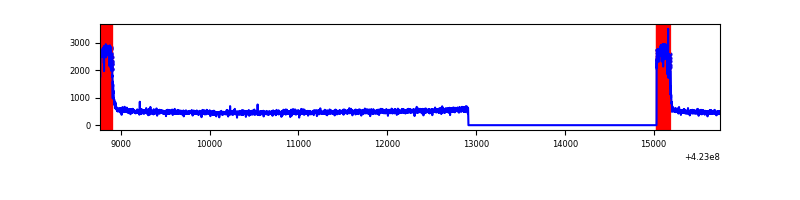 |
| D | 6984 | 4863 | 47 | 47 | 0.67% | 0.97% | 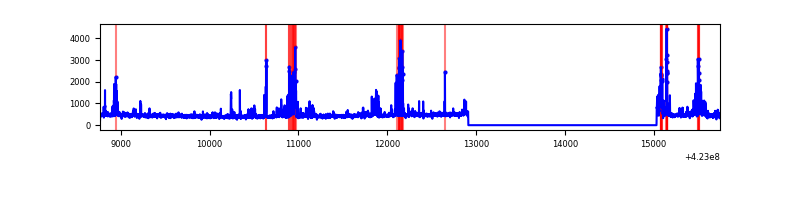 |
Top three noisy pixels from each quadrant. If the there are fewer than three noisy pixels in the level2.evt file, extra rows are filled as -1
| Pixel properties | Quadrant properties | ||||||
|---|---|---|---|---|---|---|---|
| Quadrant | DetID | PixID | Counts | Sigma | Mean | Median | Sigma |
| A | 10 | 83 | 470926 | 4137.19 | 552 | 540 | 113.7 |
| A | 13 | 248 | 234282 | 2055.83 | 552 | 540 | 113.7 |
| A | 2 | 79 | 104507 | 914.42 | 552 | 540 | 113.7 |
| B | 0 | 190 | 68087 | 634.66 | 551 | 537 | 106.4 |
| B | 0 | 186 | 38551 | 357.15 | 551 | 537 | 106.4 |
| B | 12 | 111 | 13130 | 118.32 | 551 | 537 | 106.4 |
| C | 0 | 10 | 799953 | 6569.75 | 518 | 522 | 121.7 |
| C | 15 | 214 | 198170 | 1624.28 | 518 | 522 | 121.7 |
| C | 13 | 61 | 3473 | 24.25 | 518 | 522 | 121.7 |
| D | 13 | 249 | 202786 | 1557.16 | 529 | 515 | 129.9 |
| D | 13 | 171 | 110960 | 850.25 | 529 | 515 | 129.9 |
| D | 1 | 47 | 86844 | 664.6 | 529 | 515 | 129.9 |
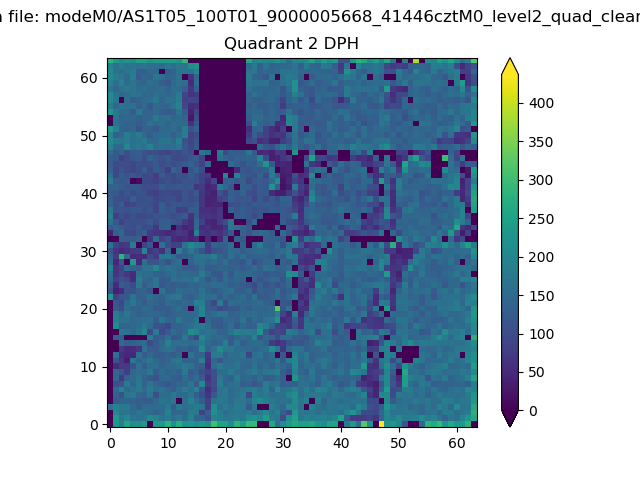
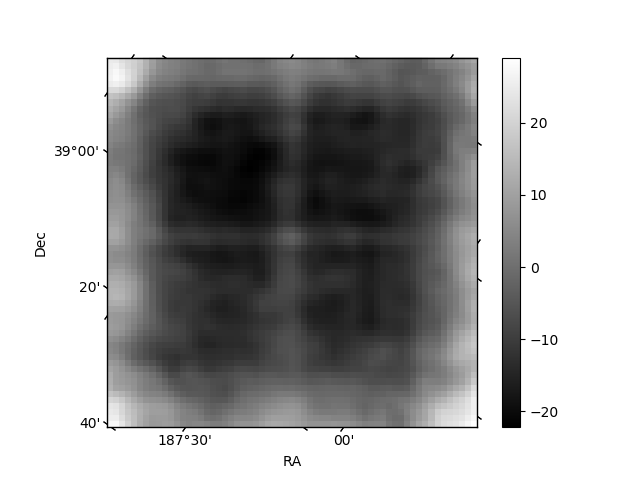
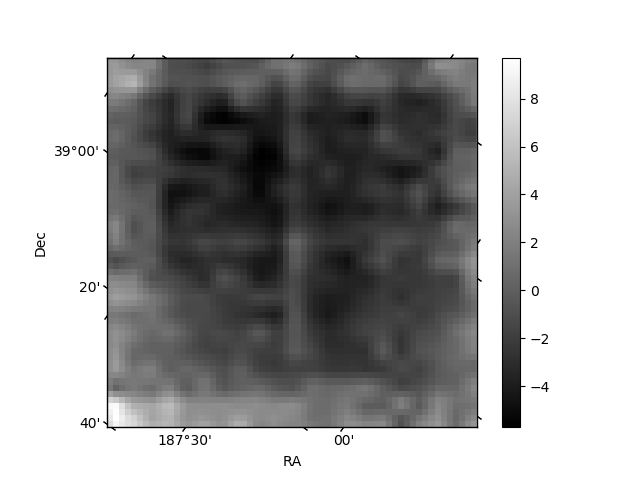
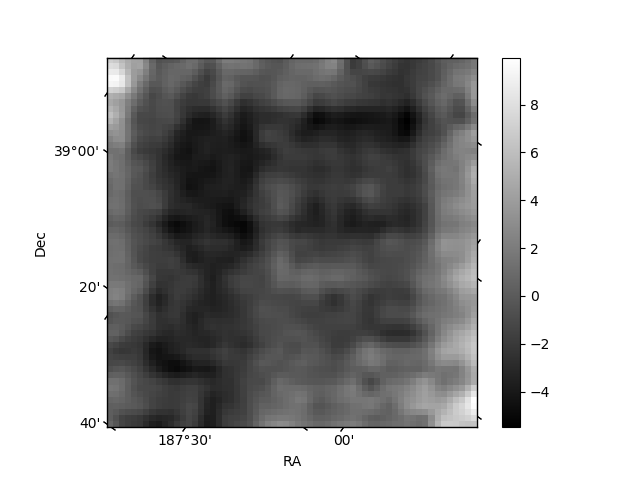
Histogram calculated using DETX and DETY for each event in the final _common_clean file
| Quadrant A | 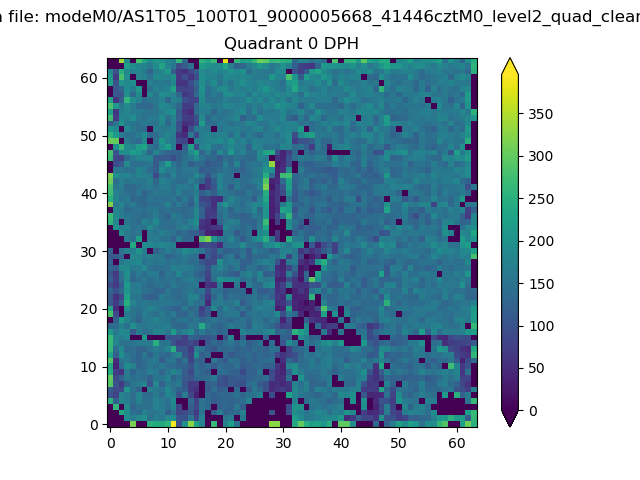 |
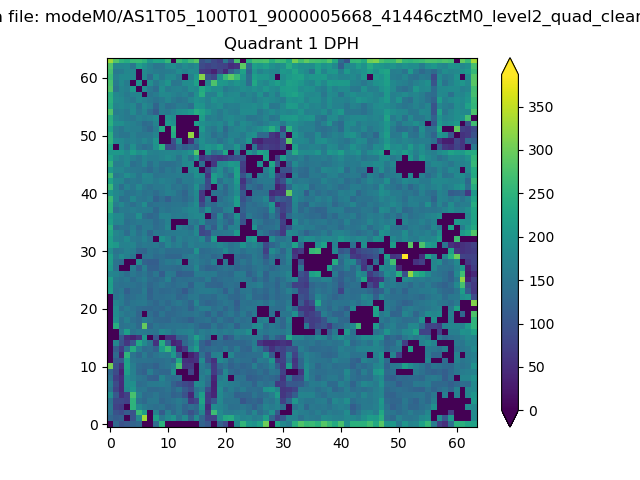 |
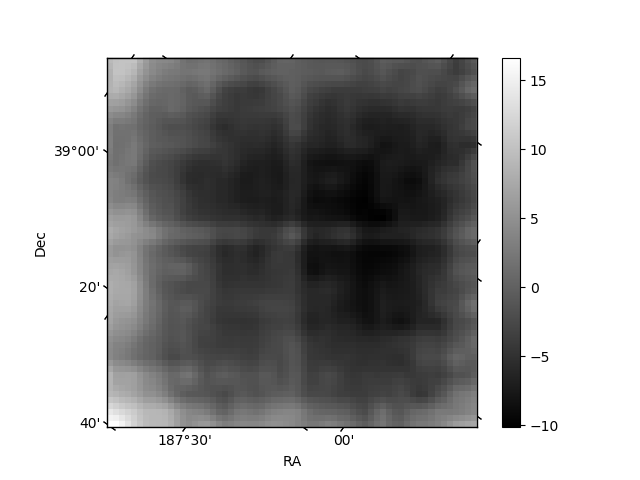
Quadrant B |
|---|---|---|---|
| Quadrant D | 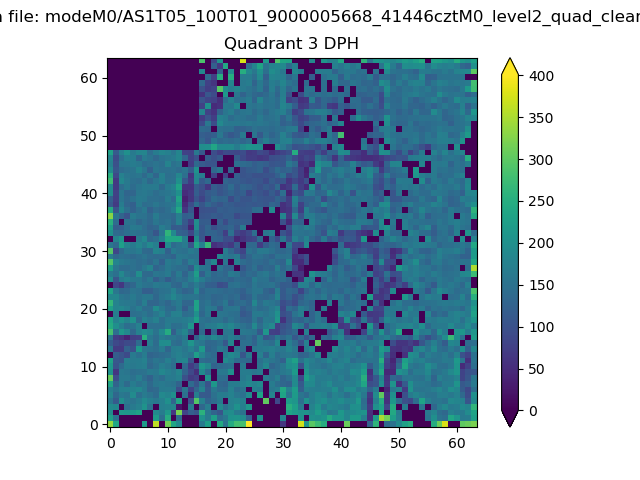 |
 |
Quadrant C |
| Plot type | Count rate plots | Images |
|---|---|---|
| Comparison with Poisson distribution Blue bars denote a histogram of data divided into 1 sec bins. Red curve is a Poisson curve with rate = median count rate of data. |
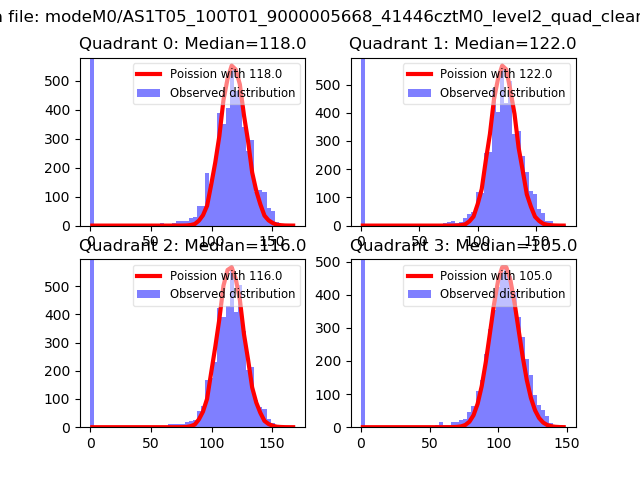 |
 |
| Quadrant-wise count rates Data is divided into 100 sec bins |
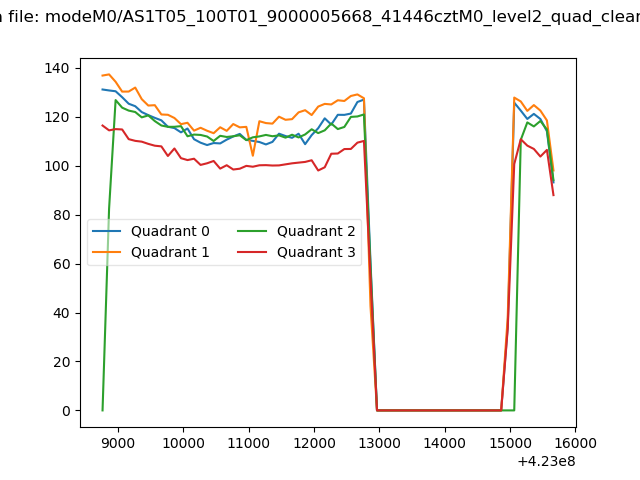 |
|
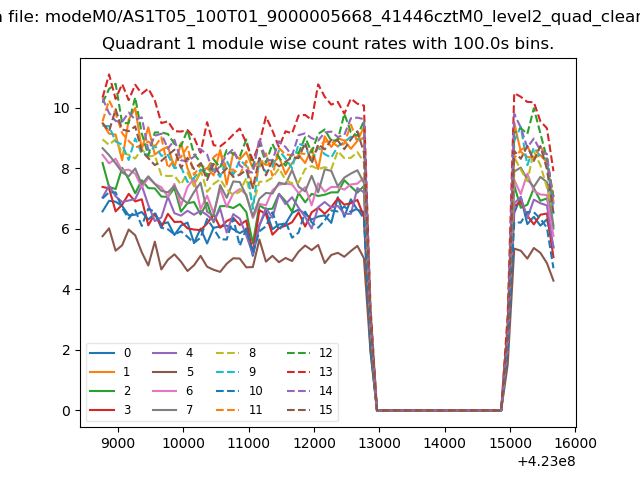
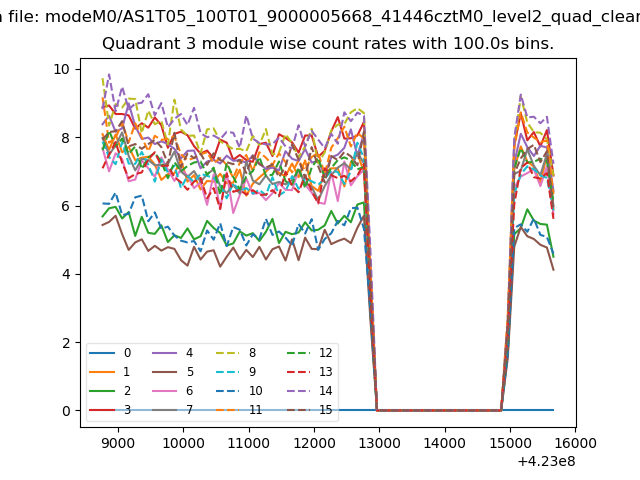
| Module-wise count rates for Quadrant A Data is divided into 100 sec bins |
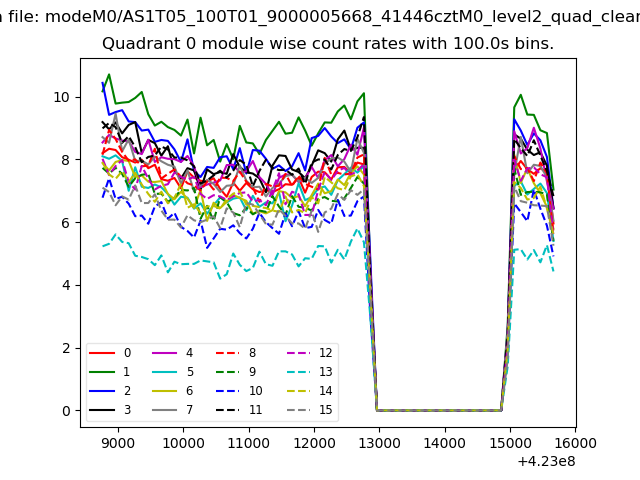 |
 |
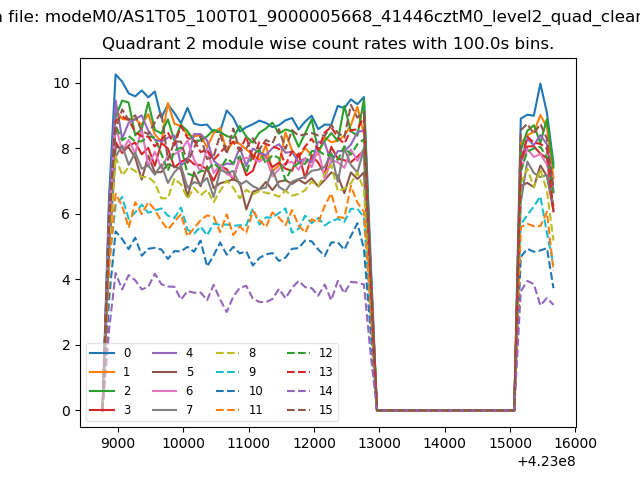
| Module-wise count rates for Quadrant B Data is divided into 100 sec bins |
 |
 |
| Module-wise count rates for Quadrant C Data is divided into 100 sec bins |
 |
 |
| Module-wise count rates for Quadrant D Data is divided into 100 sec bins |
 |
 |
| Parameter | Plot |
|---|---|
| CZT HV Monitor | 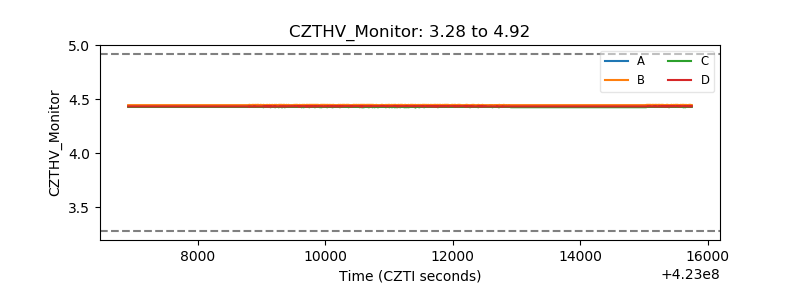 |
| D_VDD | 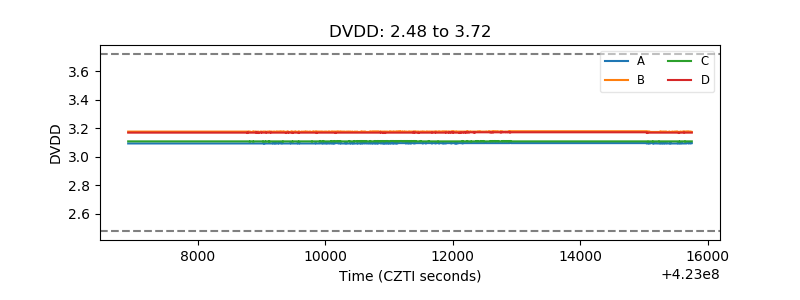 |
| Temperature 1 | 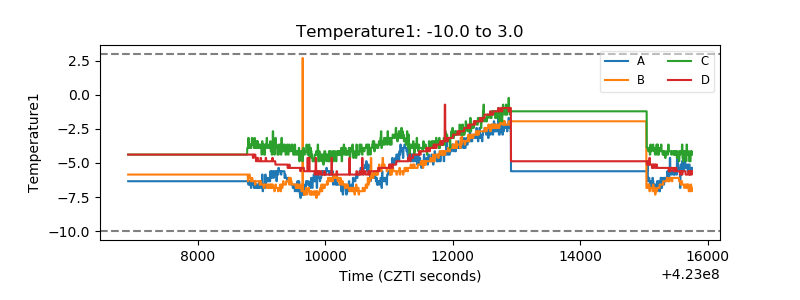 |
| Veto HV Monitor | 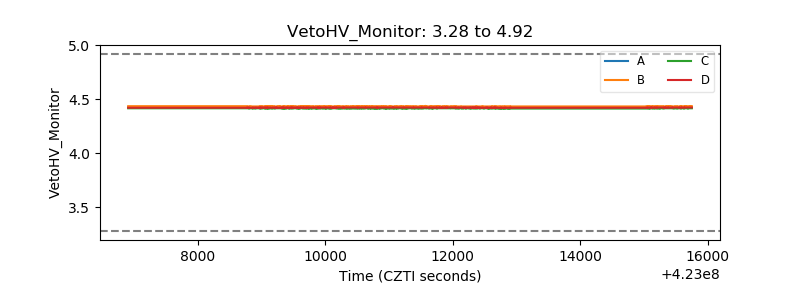 |
| Veto LLD | 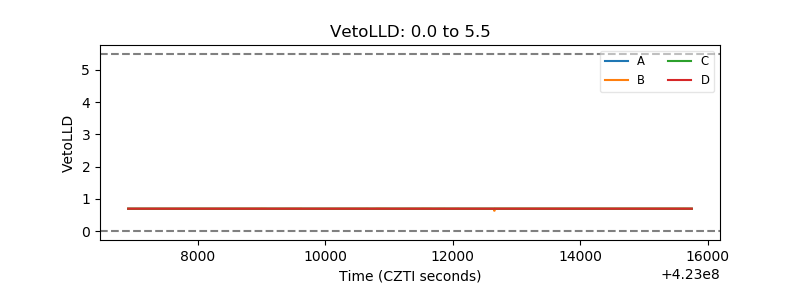 |
| Alpha Counter | 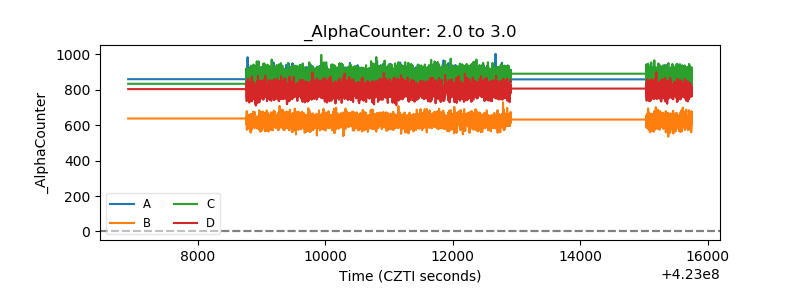 |
| _CPM_Rate | 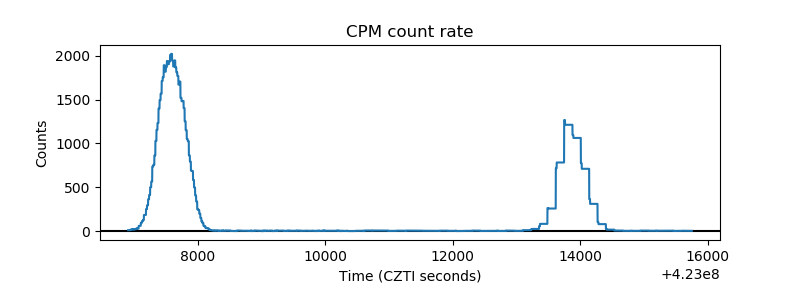 |
| CZT Counter | 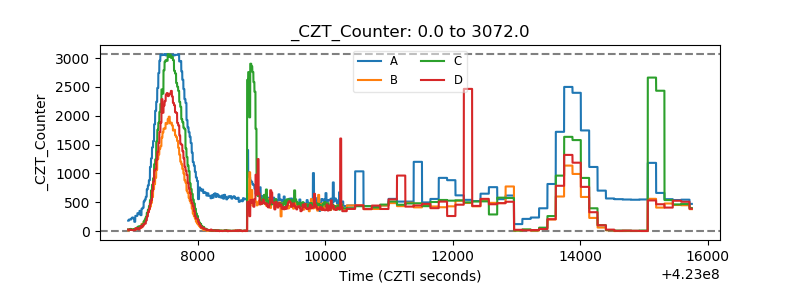 |
| +2.5 Volts monitor | 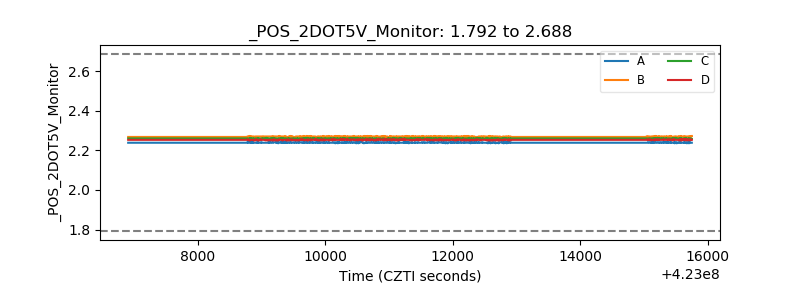 |
| +5 Volts monitor | 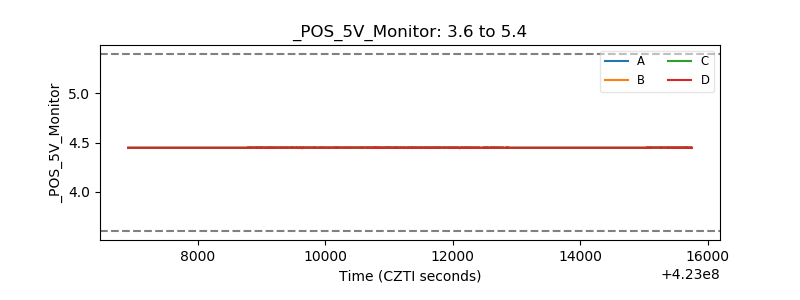 |
| _ROLL_ROT | 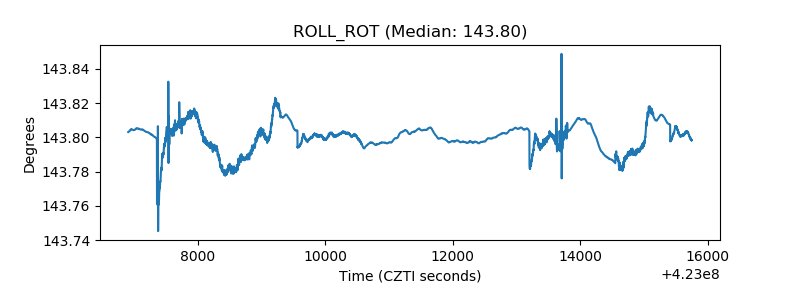 |
| _Roll_DEC | 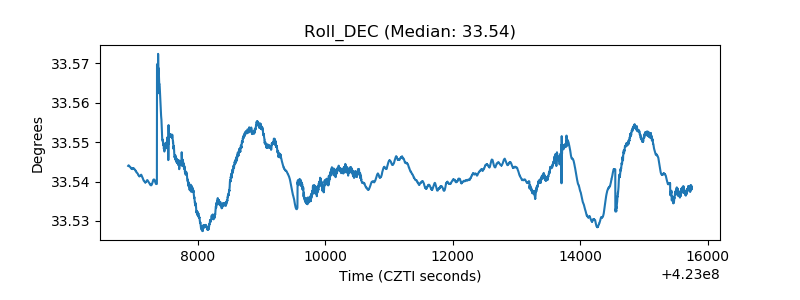 |
| _Roll_RA | 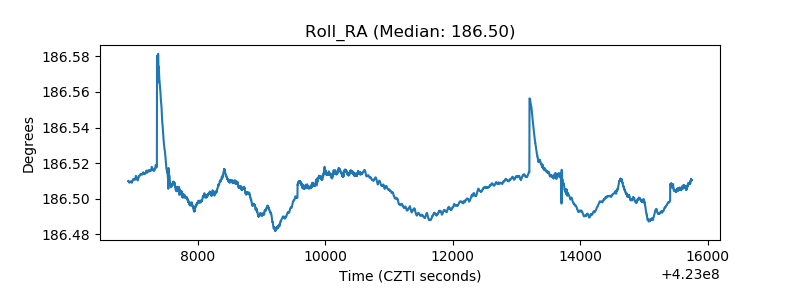 |
| Veto Counter | 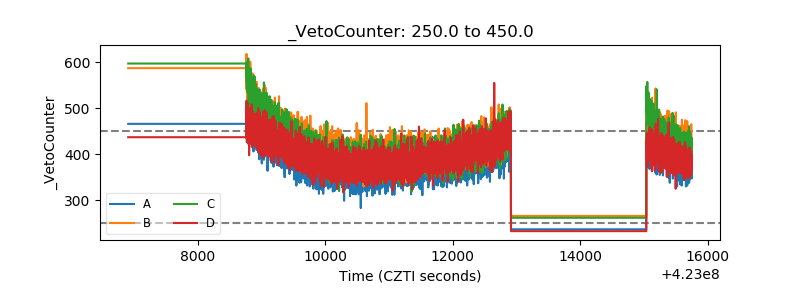 |