| Param | Original file | Final file |
|---|---|---|
| Filename | modeM0/AS1T05_100T01_9000005668_41447cztM0_level2.fits | modeM0/AS1T05_100T01_9000005668_41447cztM0_level2_quad_clean.evt |
| Size (bytes) | 310,423,680 | 82,134,720 |
| Size | 296.0 MB | 78.3 MB |
| Events in quadrant A | 2,700,311 | 559,168 |
| Events in quadrant B | 2,584,313 | 560,893 |
| Events in quadrant C | 3,039,474 | 520,212 |
| Events in quadrant D | 2,782,099 | 501,208 |
| Mode M9 | |||
|---|---|---|---|
| Quadrant | BADHDUFLAG | Total packets | Discarded packets |
| A | 0 | 39 | 0 |
| B | 0 | 39 | 0 |
| C | 0 | 39 | 0 |
| D | 0 | 40 | 0 |
| Mode SS | |||
|---|---|---|---|
| Quadrant | BADHDUFLAG | Total packets | Discarded packets |
| A | 0 | 100 | 0 |
| B | 0 | 100 | 0 |
| C | 0 | 100 | 0 |
| D | 0 | 100 | 0 |
| Mode M0 | |||
|---|---|---|---|
| Quadrant | BADHDUFLAG | Total packets | Discarded packets |
| A | 0 | 10920 | 3 |
| B | 0 | 11047 | 2 |
| C | 0 | 12051 | 2 |
| D | 0 | 11690 | 2 |
| Quadrant | Total seconds | Saturated seconds | Saturation percentage |
|---|---|---|---|
| A | 4930 | 18 | 0.365112% |
| B | 4930 | 156 | 3.164300% |
| C | 4930 | 282 | 5.720081% |
| D | 4930 | 66 | 1.338742% |
Noise dominated data is calculated using 1-second bins in cleaned event files. If a bin has >2000 counts, and if more than 50% of those come from <1% of pixels, then it is considered to be noise-dominated and hence unusable.
| Quadrant | # 1 sec bins | Bins with >0 counts | Bins with >2000 counts | High rate bins dominated by noise | Noise dominated (total time) | Noise dominated (detector-on time) | Marked lightcurve |
|---|---|---|---|---|---|---|---|
| A | 7052 | 4931 | 7 | 7 | 0.10% | 0.14% | 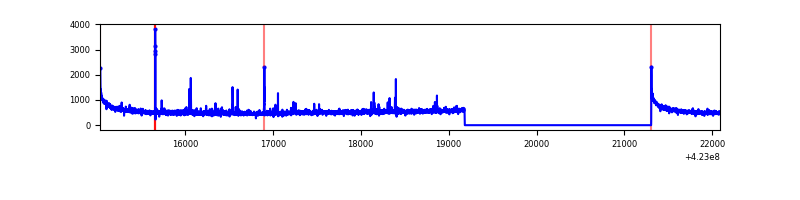 |
| B | 7052 | 4931 | 127 | 127 | 1.80% | 2.58% | 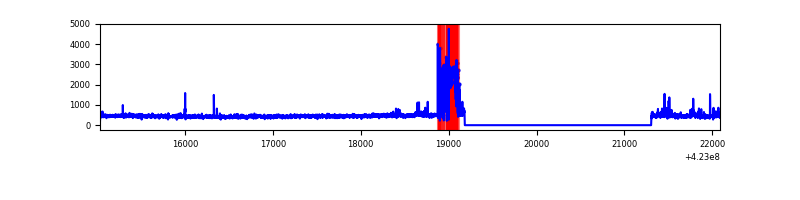 |
| C | 7052 | 4931 | 283 | 283 | 4.01% | 5.74% | 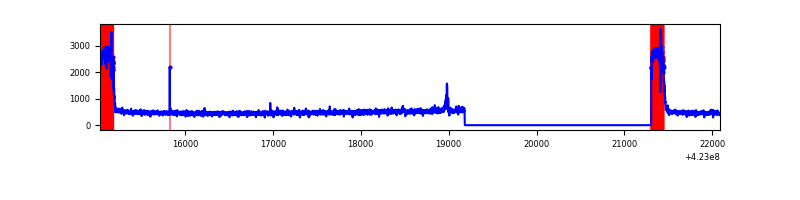 |
| D | 7052 | 4931 | 59 | 59 | 0.84% | 1.20% | 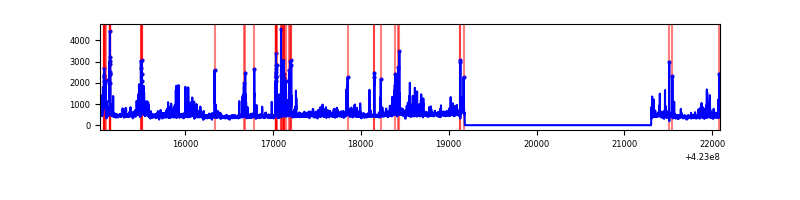 |
Top three noisy pixels from each quadrant. If the there are fewer than three noisy pixels in the level2.evt file, extra rows are filled as -1
| Pixel properties | Quadrant properties | ||||||
|---|---|---|---|---|---|---|---|
| Quadrant | DetID | PixID | Counts | Sigma | Mean | Median | Sigma |
| A | 10 | 83 | 490570 | 4298.73 | 552 | 541 | 114.0 |
| A | 13 | 248 | 59529 | 517.47 | 552 | 541 | 114.0 |
| A | 2 | 79 | 14694 | 124.16 | 552 | 541 | 114.0 |
| B | 0 | 186 | 370327 | 3537.28 | 538 | 524 | 104.5 |
| B | 0 | 190 | 71755 | 681.35 | 538 | 524 | 104.5 |
| B | 12 | 111 | 13323 | 122.43 | 538 | 524 | 104.5 |
| C | 0 | 10 | 797034 | 6618.71 | 516 | 520 | 120.3 |
| C | 15 | 214 | 200001 | 1657.61 | 516 | 520 | 120.3 |
| C | 3 | 233 | 25815 | 210.19 | 516 | 520 | 120.3 |
| D | 13 | 249 | 267669 | 2059.13 | 530 | 513 | 129.7 |
| D | 5 | 222 | 232915 | 1791.26 | 530 | 513 | 129.7 |
| D | 1 | 47 | 128978 | 990.16 | 530 | 513 | 129.7 |
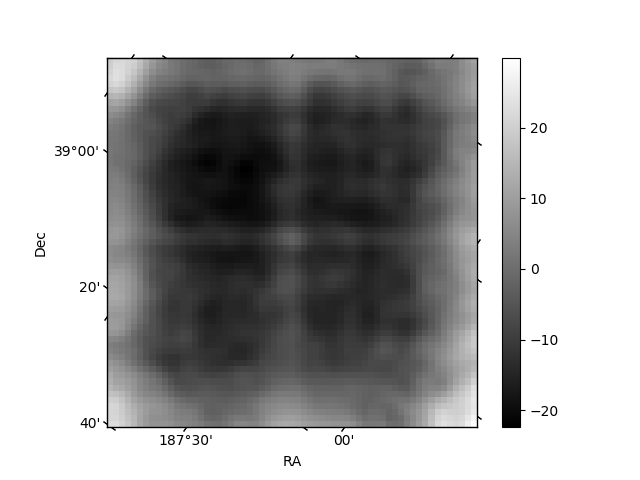
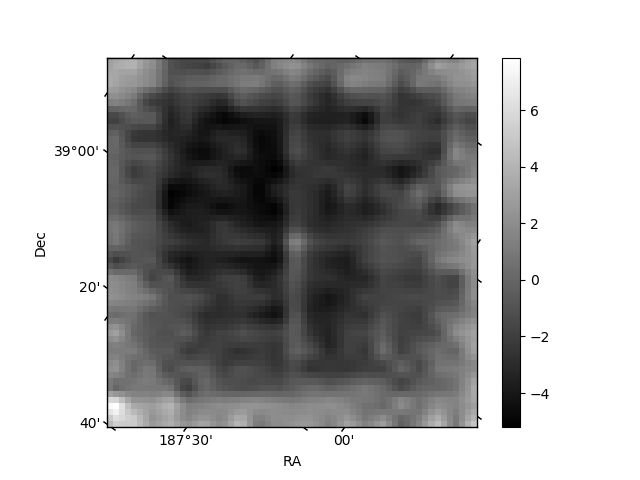
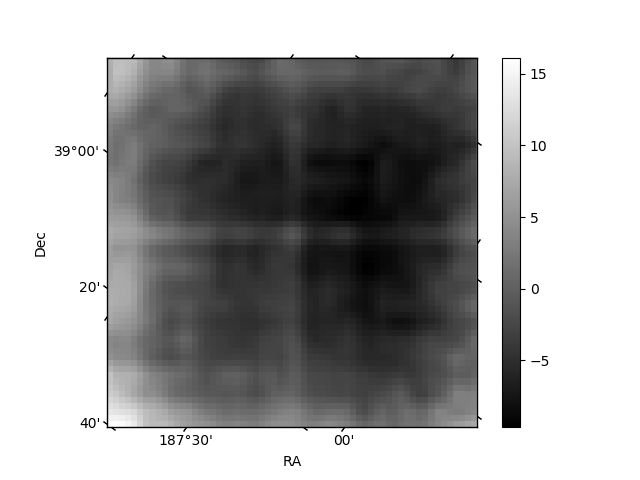
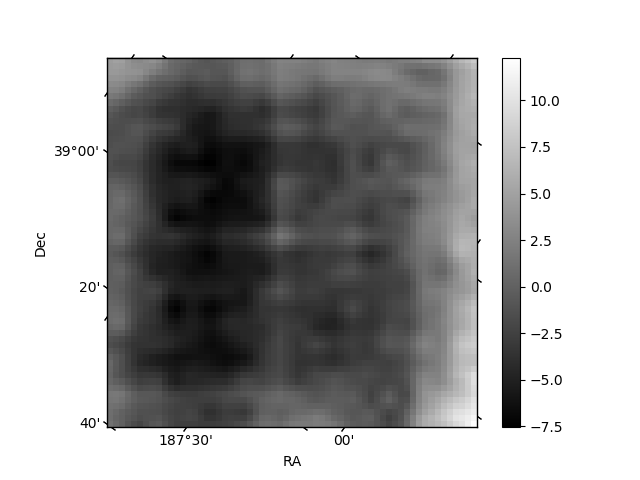
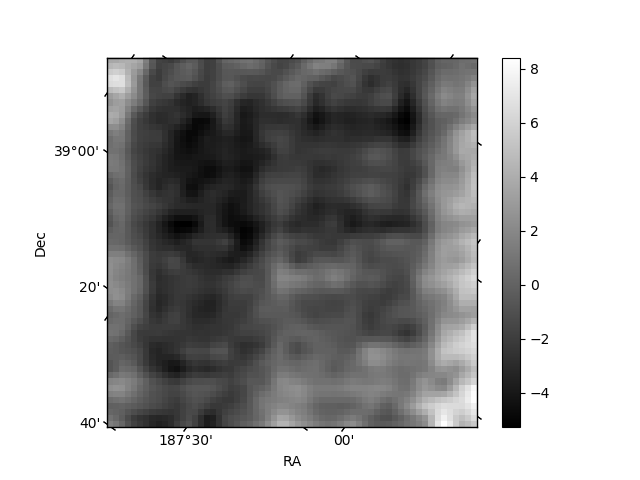
Histogram calculated using DETX and DETY for each event in the final _common_clean file
| Quadrant A | 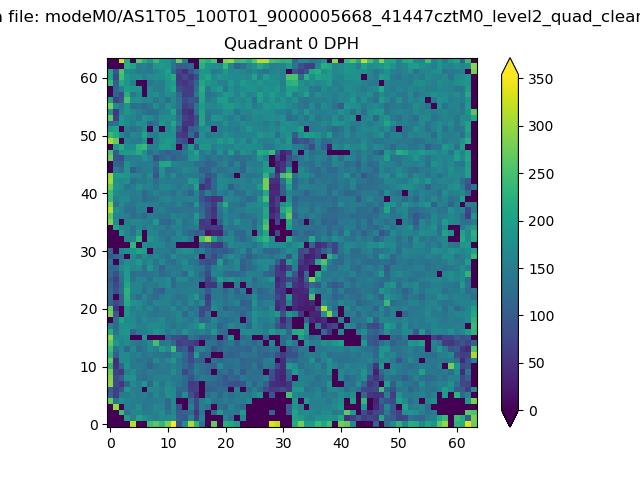 |
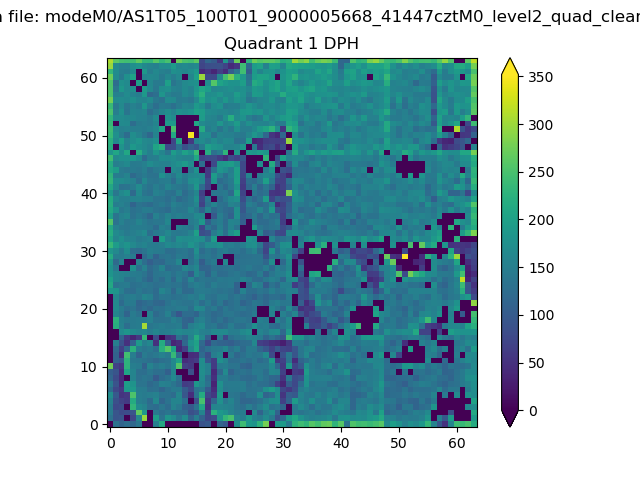 |
Quadrant B |
|---|---|---|---|
| Quadrant D | 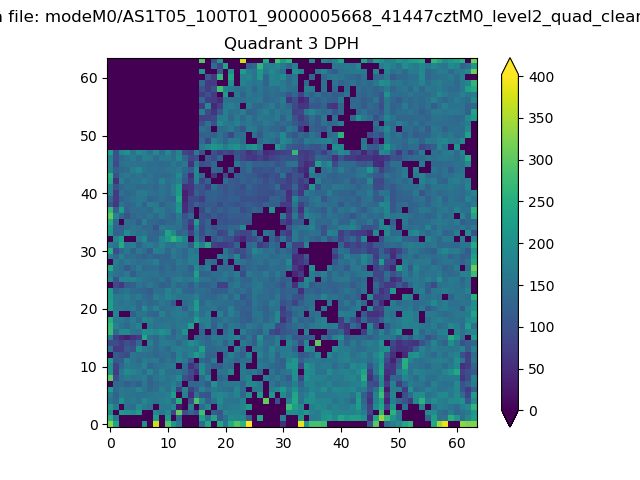 |
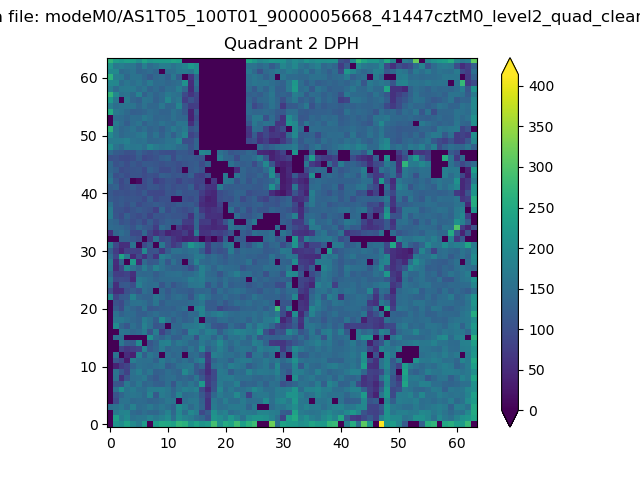 |
Quadrant C |
| Plot type | Count rate plots | Images |
|---|---|---|
| Comparison with Poisson distribution Blue bars denote a histogram of data divided into 1 sec bins. Red curve is a Poisson curve with rate = median count rate of data. |
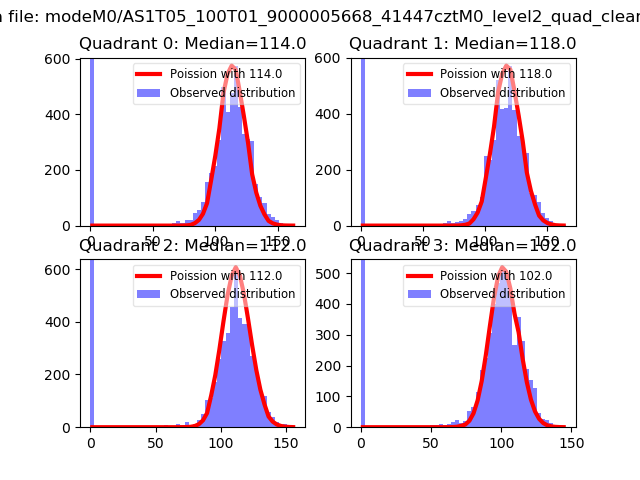 |
 |
| Quadrant-wise count rates Data is divided into 100 sec bins |
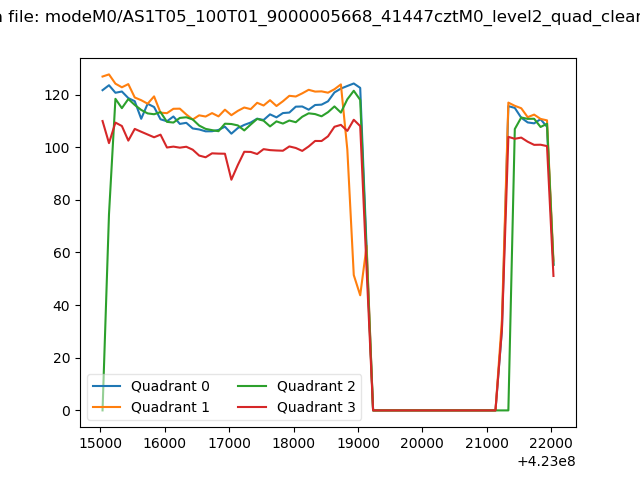 |
|
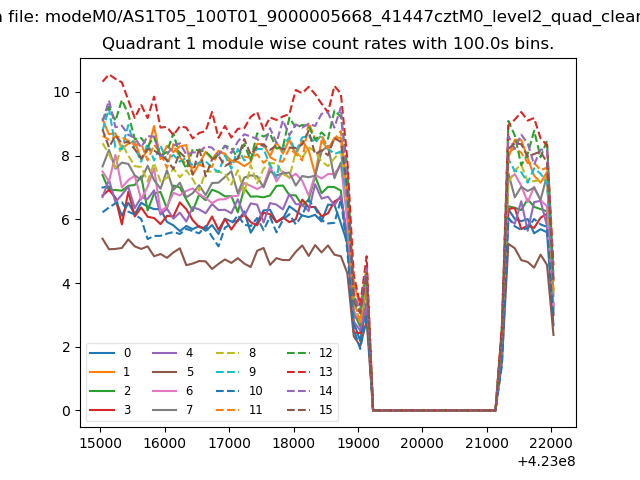
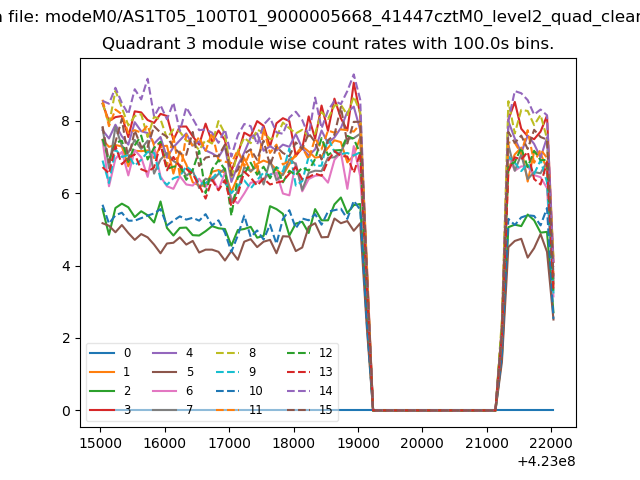
| Module-wise count rates for Quadrant A Data is divided into 100 sec bins |
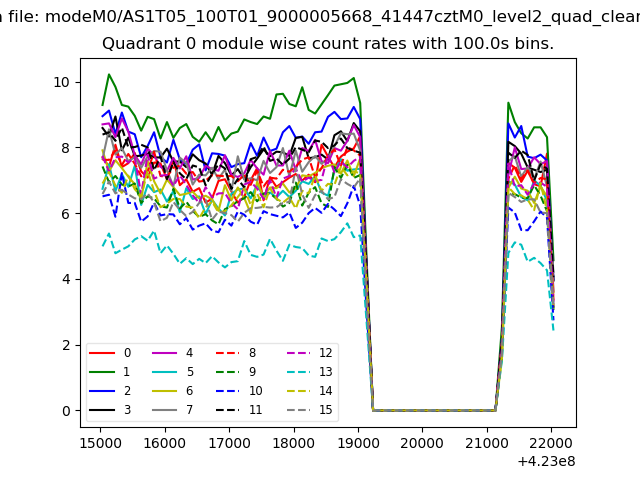 |
 |
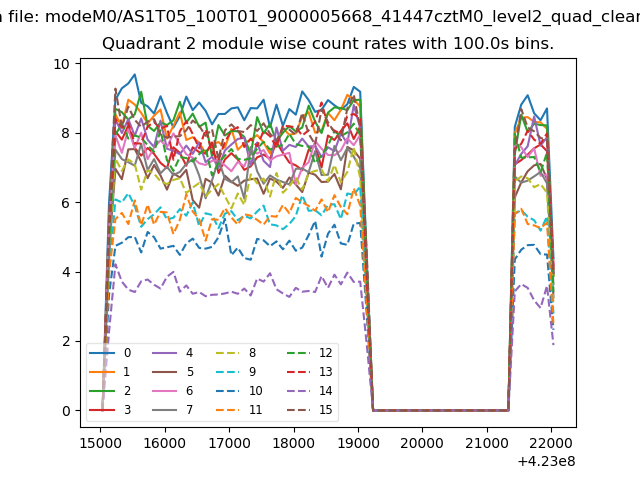
| Module-wise count rates for Quadrant B Data is divided into 100 sec bins |
 |
 |
| Module-wise count rates for Quadrant C Data is divided into 100 sec bins |
 |
 |
| Module-wise count rates for Quadrant D Data is divided into 100 sec bins |
 |
 |
| Parameter | Plot |
|---|---|
| CZT HV Monitor | 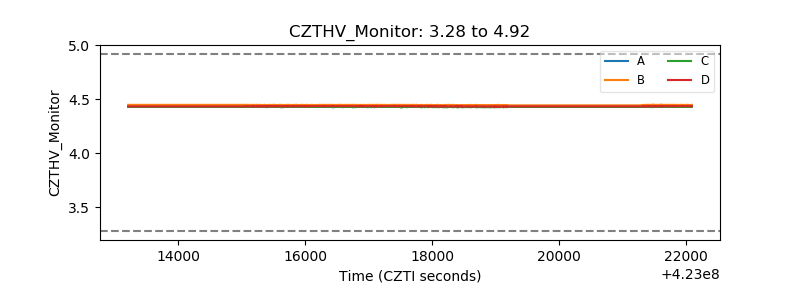 |
| D_VDD | 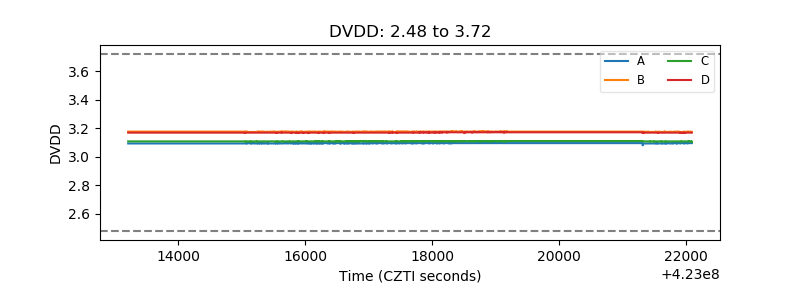 |
| Temperature 1 | 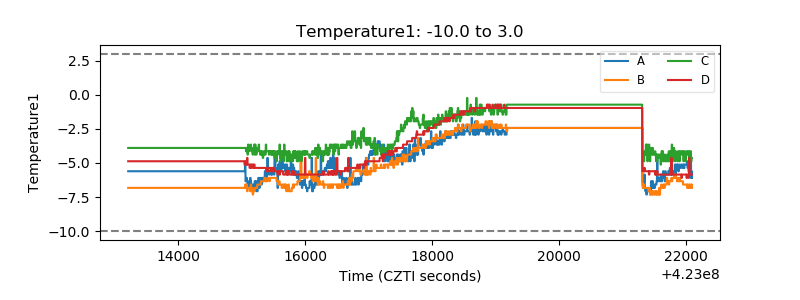 |
| Veto HV Monitor | 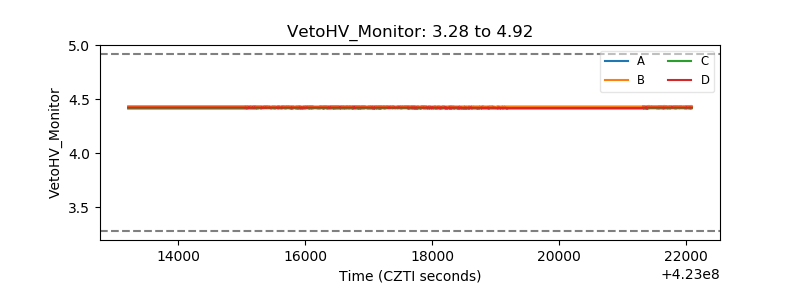 |
| Veto LLD | 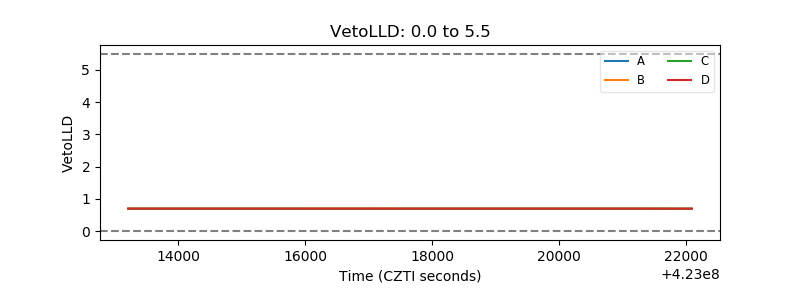 |
| Alpha Counter | 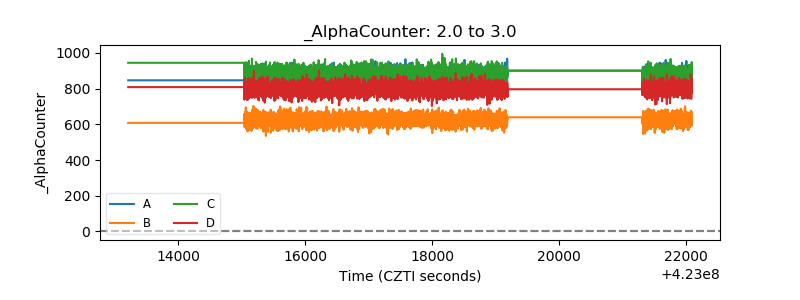 |
| _CPM_Rate | 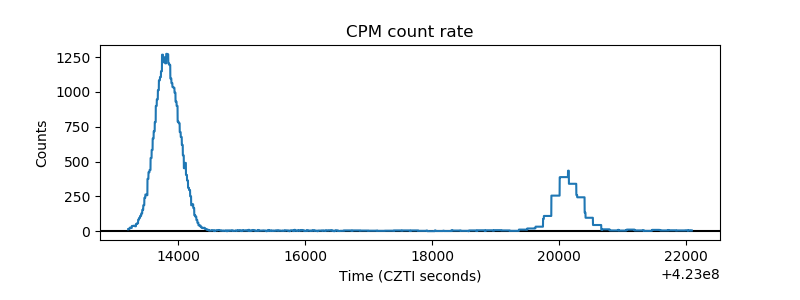 |
| CZT Counter | 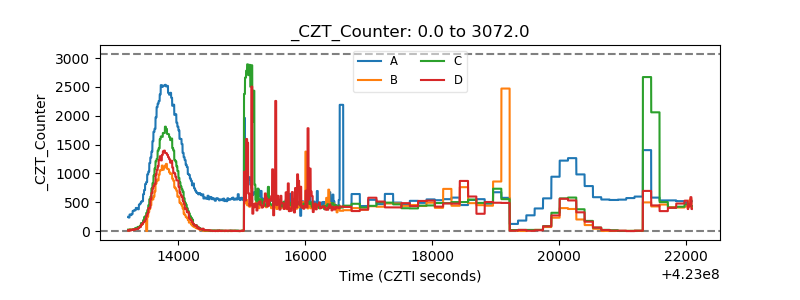 |
| +2.5 Volts monitor | 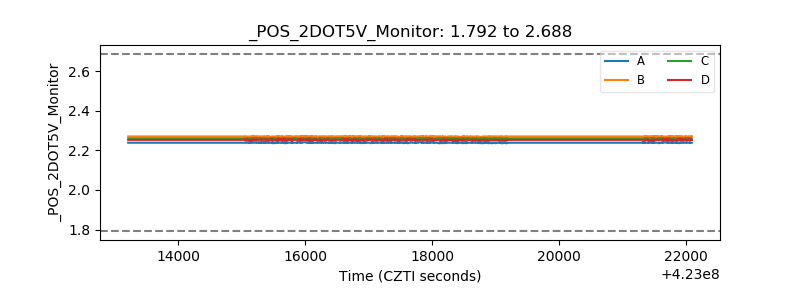 |
| +5 Volts monitor | 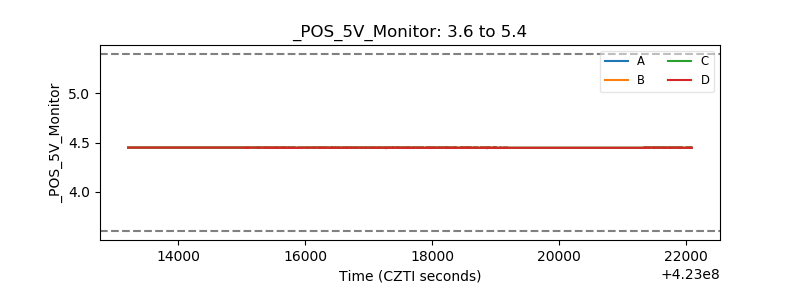 |
| _ROLL_ROT | 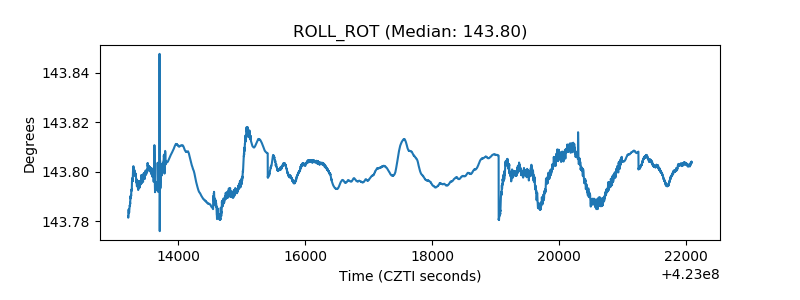 |
| _Roll_DEC | 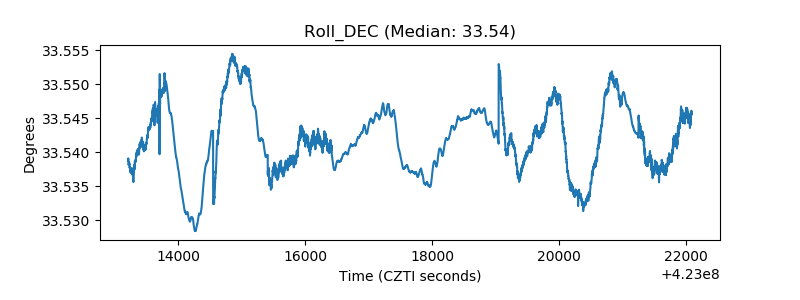 |
| _Roll_RA | 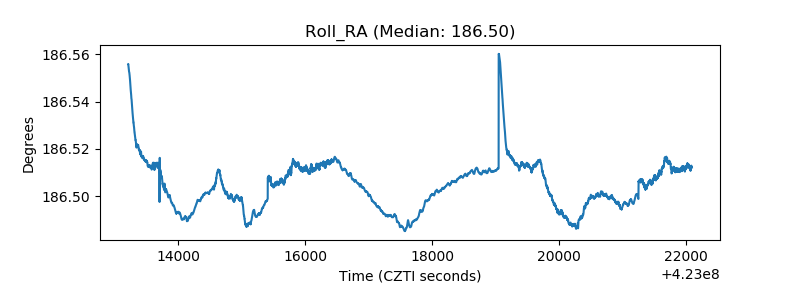 |
| Veto Counter |  |