| Param | Original file | Final file |
|---|---|---|
| Filename | modeM0/AS1T05_100T01_9000005668_41448cztM0_level2.fits | modeM0/AS1T05_100T01_9000005668_41448cztM0_level2_quad_clean.evt |
| Size (bytes) | 306,820,800 | 79,467,840 |
| Size | 292.6 MB | 75.8 MB |
| Events in quadrant A | 2,603,813 | 537,339 |
| Events in quadrant B | 2,244,829 | 554,696 |
| Events in quadrant C | 2,946,536 | 500,243 |
| Events in quadrant D | 3,181,403 | 471,273 |
| Mode M9 | |||
|---|---|---|---|
| Quadrant | BADHDUFLAG | Total packets | Discarded packets |
| A | 0 | 38 | 0 |
| B | 0 | 38 | 0 |
| C | 0 | 38 | 0 |
| D | 0 | 39 | 0 |
| Mode SS | |||
|---|---|---|---|
| Quadrant | BADHDUFLAG | Total packets | Discarded packets |
| A | 0 | 100 | 0 |
| B | 0 | 100 | 0 |
| C | 0 | 100 | 0 |
| D | 0 | 100 | 0 |
| Mode M0 | |||
|---|---|---|---|
| Quadrant | BADHDUFLAG | Total packets | Discarded packets |
| A | 0 | 10567 | 3 |
| B | 0 | 10043 | 2 |
| C | 0 | 11754 | 2 |
| D | 0 | 12963 | 2 |
| Quadrant | Total seconds | Saturated seconds | Saturation percentage |
|---|---|---|---|
| A | 4883 | 8 | 0.163834% |
| B | 4883 | 10 | 0.204792% |
| C | 4883 | 273 | 5.590825% |
| D | 4883 | 229 | 4.689740% |
Noise dominated data is calculated using 1-second bins in cleaned event files. If a bin has >2000 counts, and if more than 50% of those come from <1% of pixels, then it is considered to be noise-dominated and hence unusable.
| Quadrant | # 1 sec bins | Bins with >0 counts | Bins with >2000 counts | High rate bins dominated by noise | Noise dominated (total time) | Noise dominated (detector-on time) | Marked lightcurve |
|---|---|---|---|---|---|---|---|
| A | 6885 | 4884 | 2 | 2 | 0.03% | 0.04% | 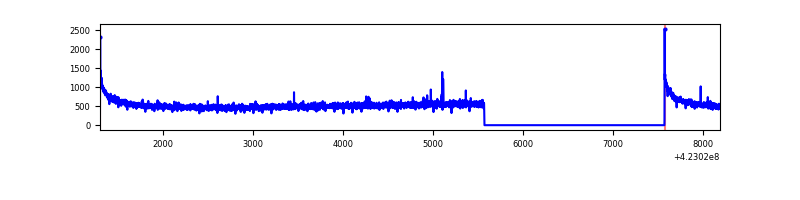 |
| B | 6885 | 4884 | 0 | 0 | 0.00% | 0.00% | 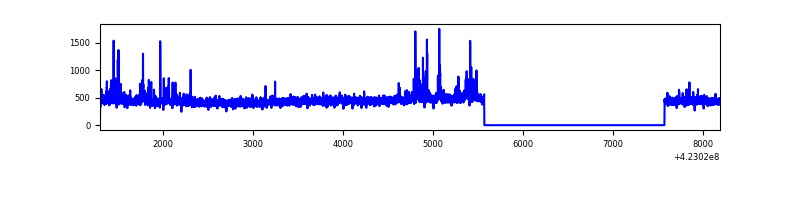 |
| C | 6885 | 4884 | 268 | 268 | 3.89% | 5.49% | 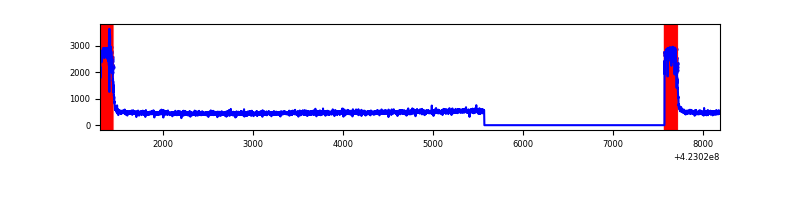 |
| D | 6885 | 4884 | 185 | 185 | 2.69% | 3.79% | 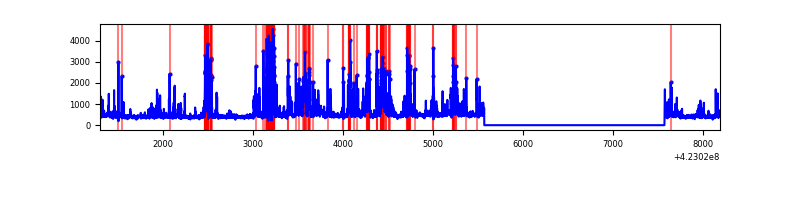 |
Top three noisy pixels from each quadrant. If the there are fewer than three noisy pixels in the level2.evt file, extra rows are filled as -1
| Pixel properties | Quadrant properties | ||||||
|---|---|---|---|---|---|---|---|
| Quadrant | DetID | PixID | Counts | Sigma | Mean | Median | Sigma |
| A | 10 | 83 | 486466 | 4351.61 | 541 | 530 | 111.7 |
| A | 13 | 248 | 12956 | 111.28 | 541 | 530 | 111.7 |
| A | 13 | 254 | 7661 | 63.86 | 541 | 530 | 111.7 |
| B | 0 | 190 | 89200 | 844.13 | 539 | 523 | 105.1 |
| B | 12 | 111 | 13485 | 123.39 | 539 | 523 | 105.1 |
| B | 11 | 111 | 12482 | 113.84 | 539 | 523 | 105.1 |
| C | 0 | 10 | 765235 | 6479.82 | 507 | 509 | 118.0 |
| C | 15 | 214 | 199759 | 1688.32 | 507 | 509 | 118.0 |
| C | 13 | 61 | 3378 | 24.31 | 507 | 509 | 118.0 |
| D | 13 | 249 | 706401 | 5599.63 | 513 | 497 | 126.1 |
| D | 1 | 47 | 375897 | 2977.88 | 513 | 497 | 126.1 |
| D | 5 | 222 | 71499 | 563.23 | 513 | 497 | 126.1 |
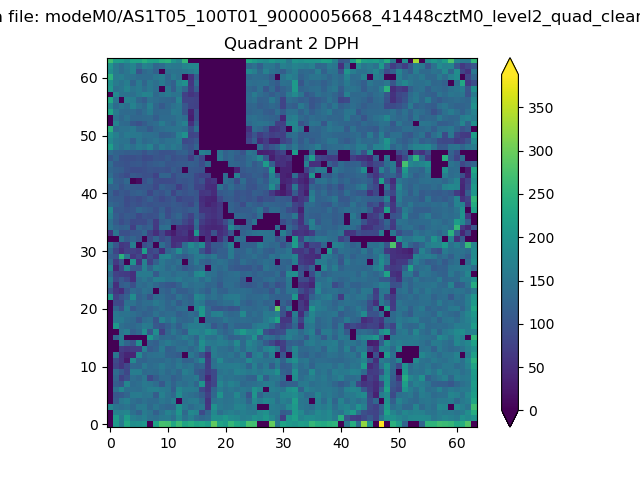
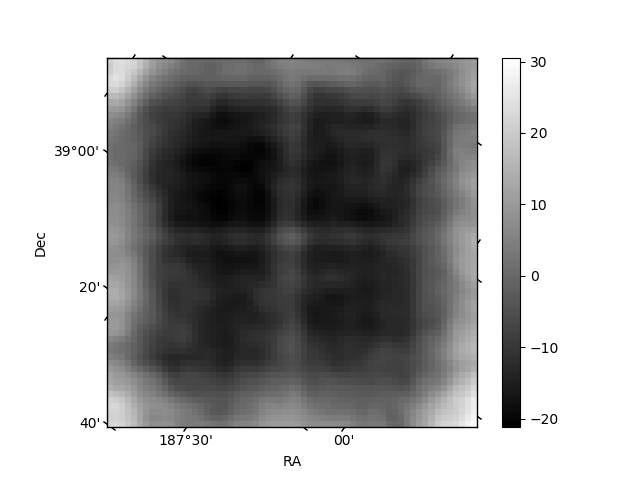
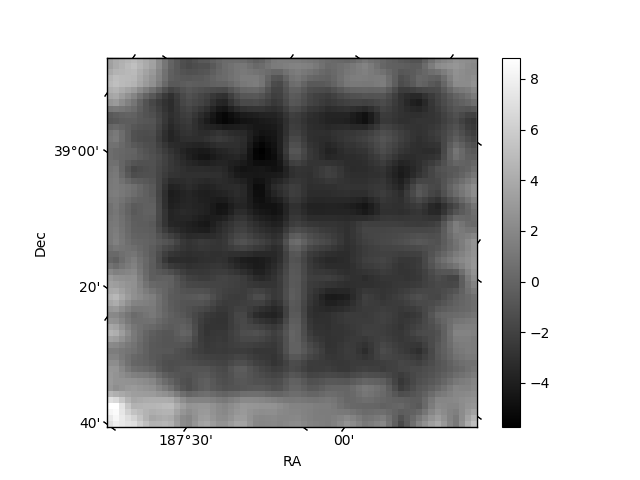
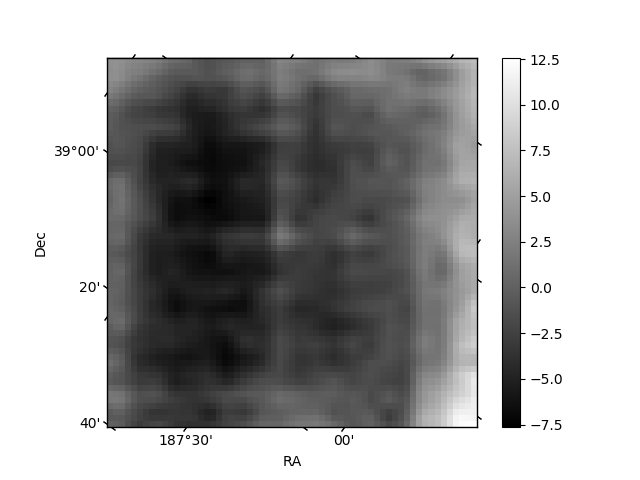
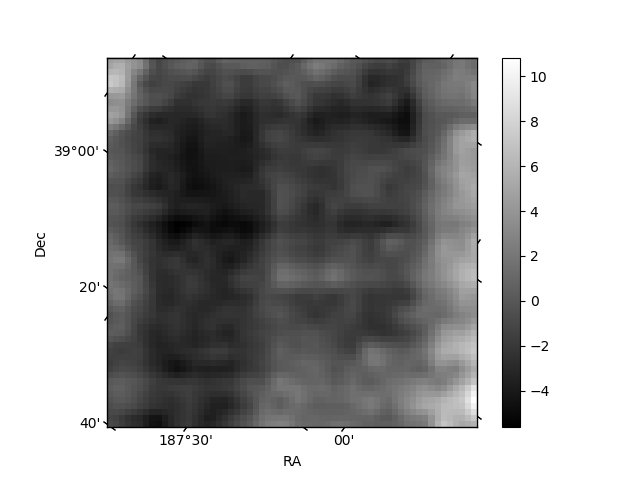
Histogram calculated using DETX and DETY for each event in the final _common_clean file
| Quadrant A | 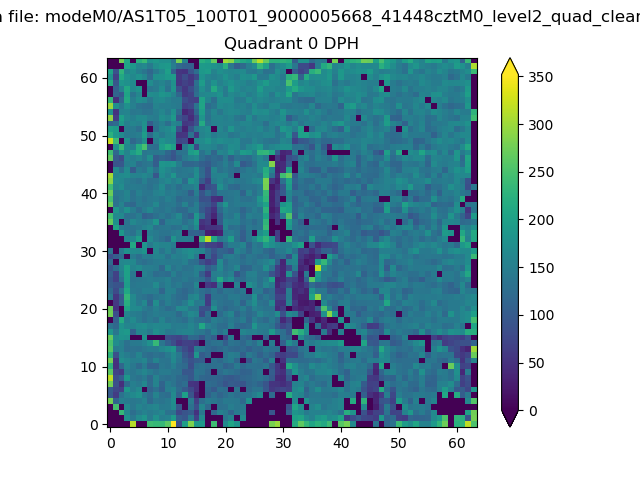 |
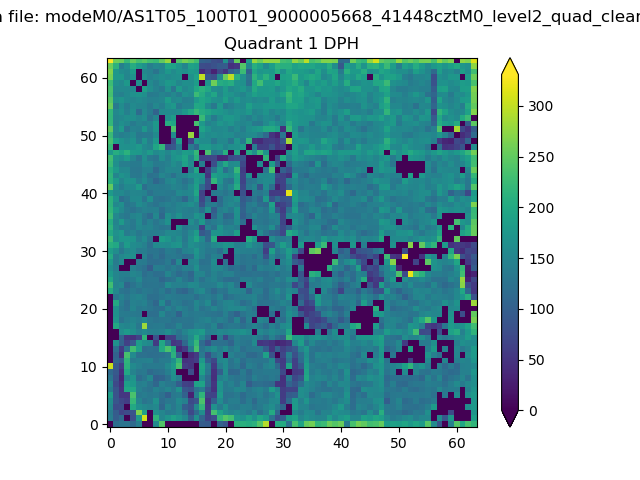 |
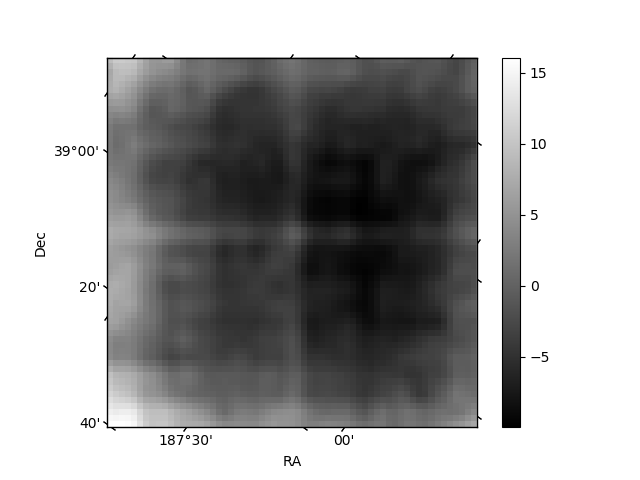
Quadrant B |
|---|---|---|---|
| Quadrant D | 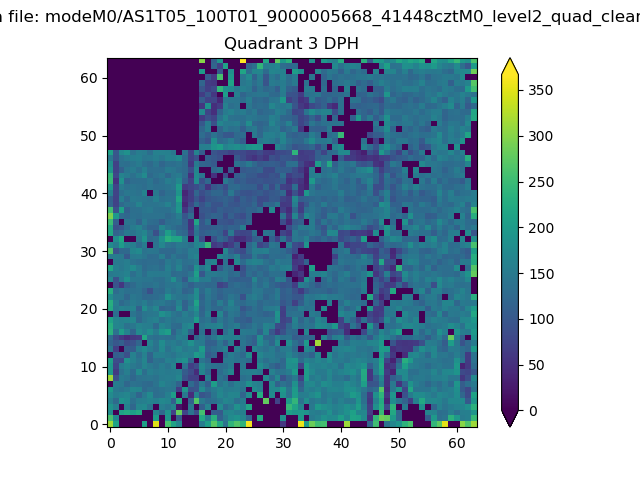 |
 |
Quadrant C |
| Plot type | Count rate plots | Images |
|---|---|---|
| Comparison with Poisson distribution Blue bars denote a histogram of data divided into 1 sec bins. Red curve is a Poisson curve with rate = median count rate of data. |
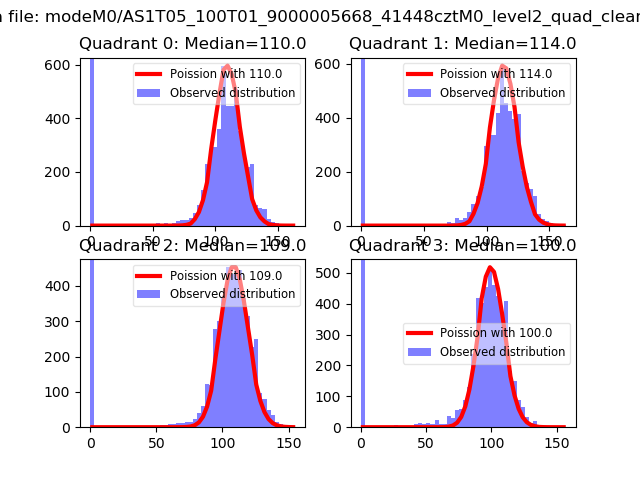 |
 |
| Quadrant-wise count rates Data is divided into 100 sec bins |
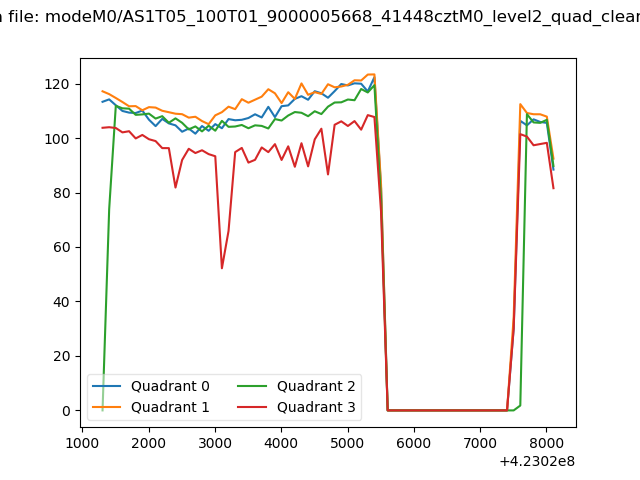 |
|
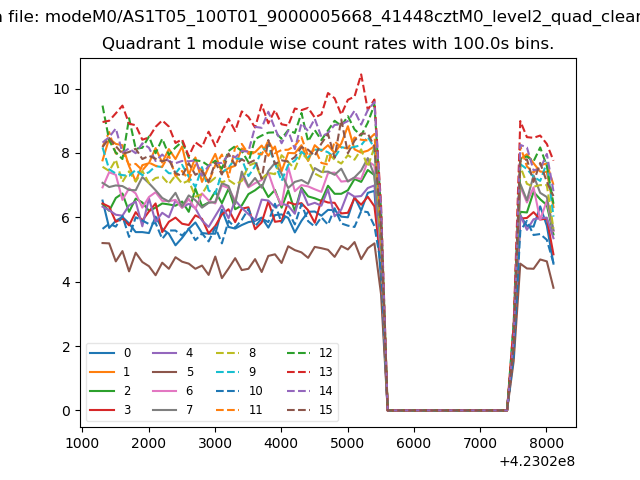
| Module-wise count rates for Quadrant A Data is divided into 100 sec bins |
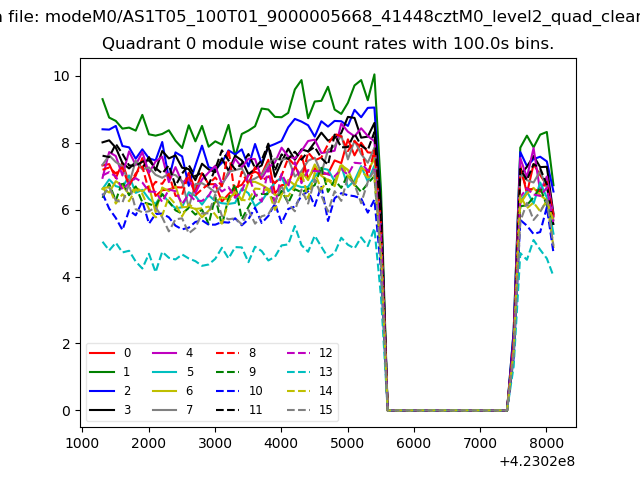 |
 |
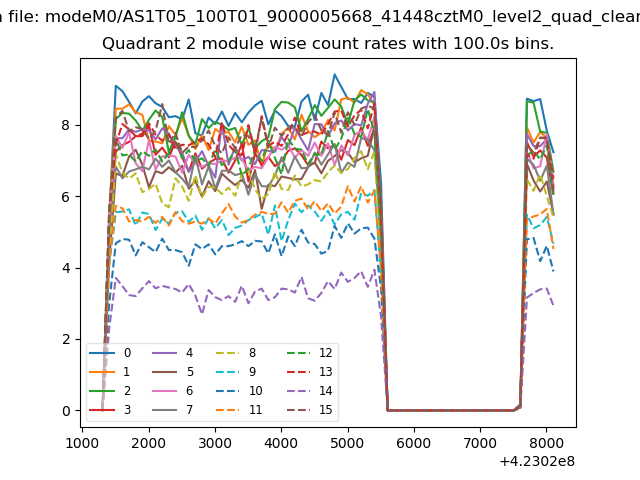
| Module-wise count rates for Quadrant B Data is divided into 100 sec bins |
 |
 |
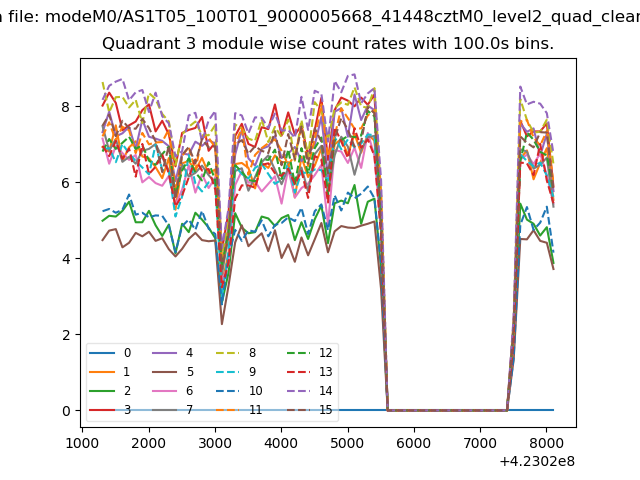
| Module-wise count rates for Quadrant C Data is divided into 100 sec bins |
 |
 |
| Module-wise count rates for Quadrant D Data is divided into 100 sec bins |
 |
 |
| Parameter | Plot |
|---|---|
| CZT HV Monitor | 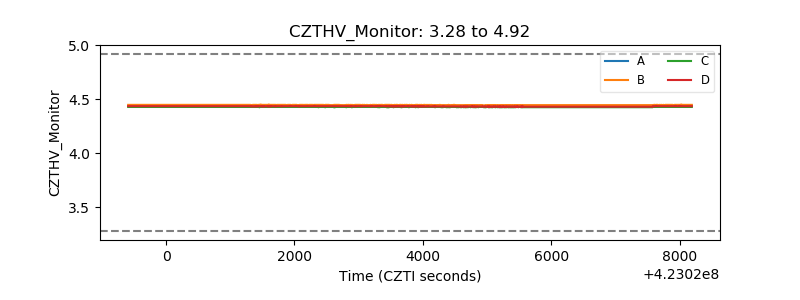 |
| D_VDD | 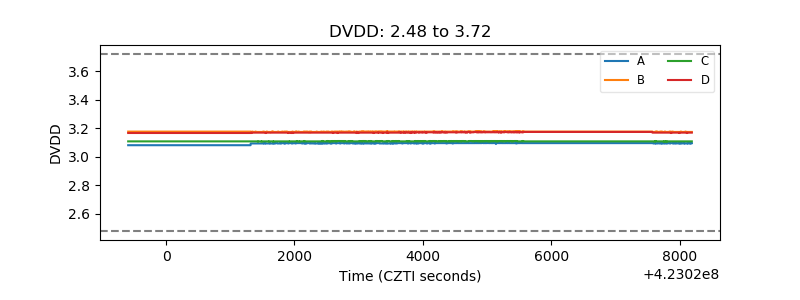 |
| Temperature 1 | 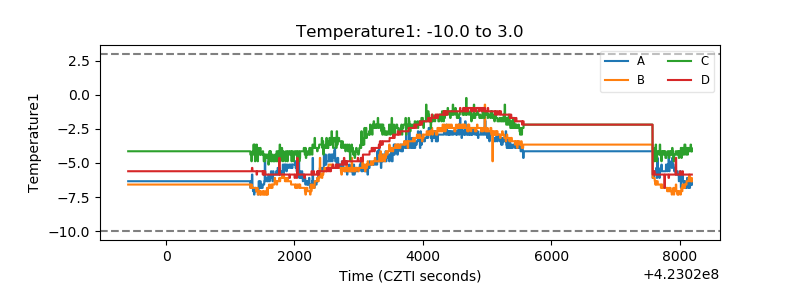 |
| Veto HV Monitor | 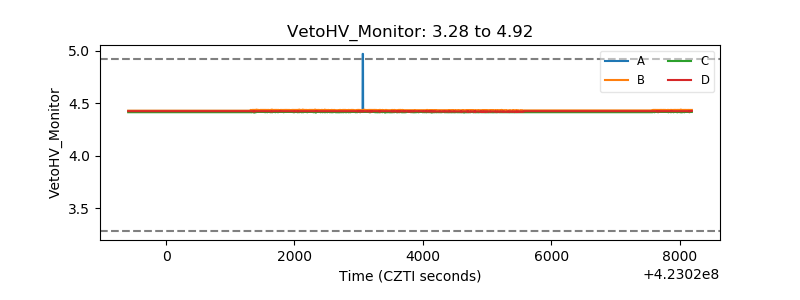 |
| Veto LLD | 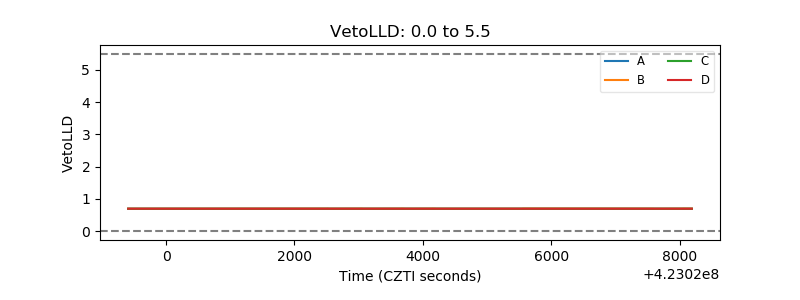 |
| Alpha Counter | 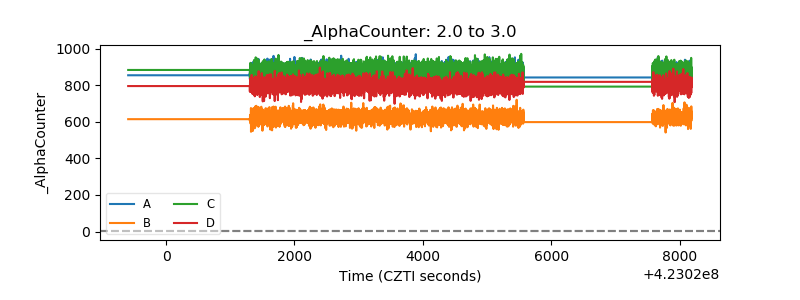 |
| _CPM_Rate | 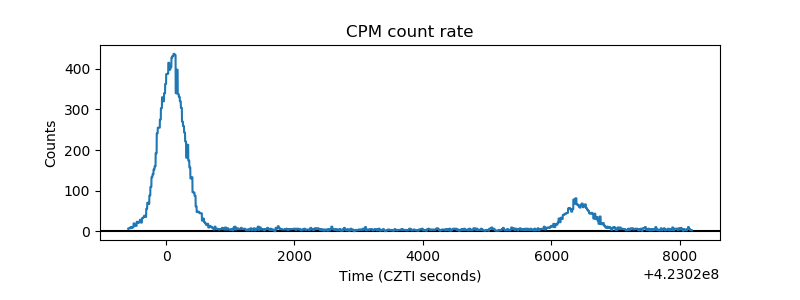 |
| CZT Counter | 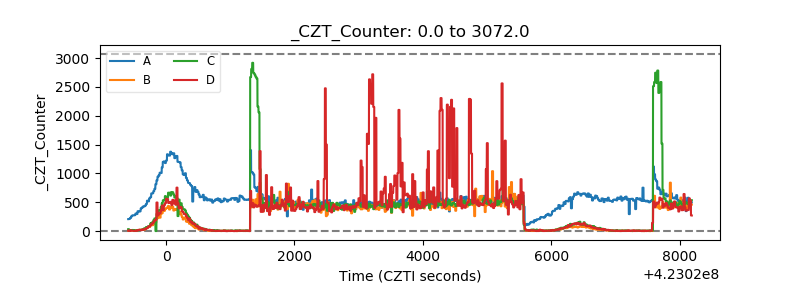 |
| +2.5 Volts monitor | 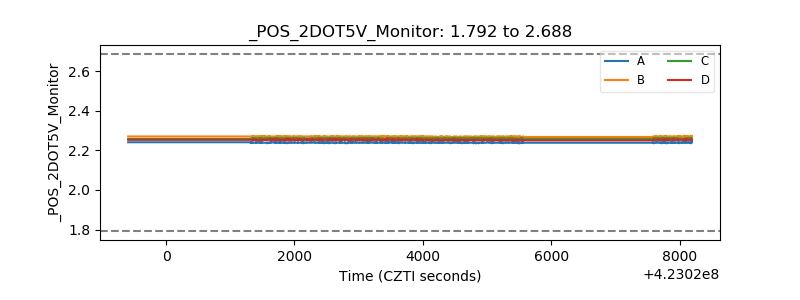 |
| +5 Volts monitor | 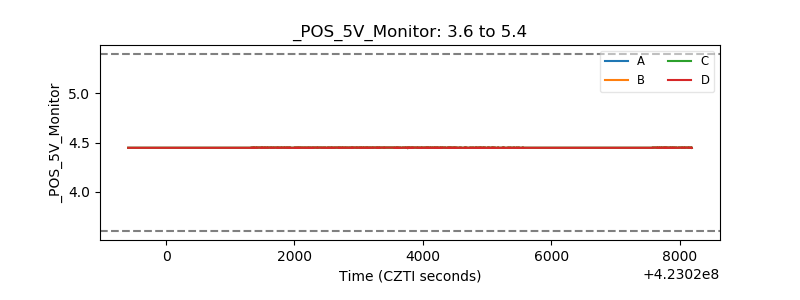 |
| _ROLL_ROT | 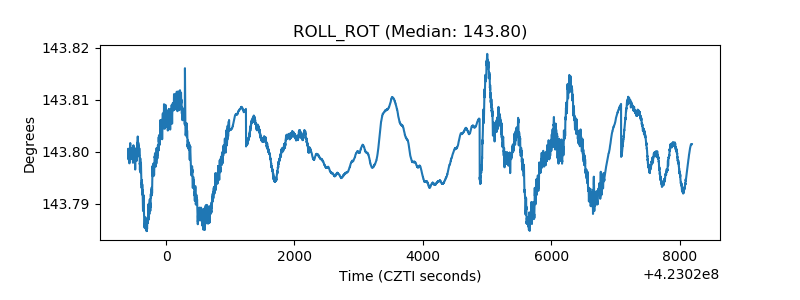 |
| _Roll_DEC | 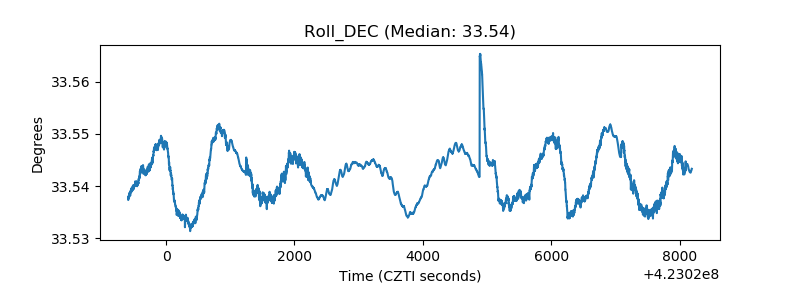 |
| _Roll_RA | 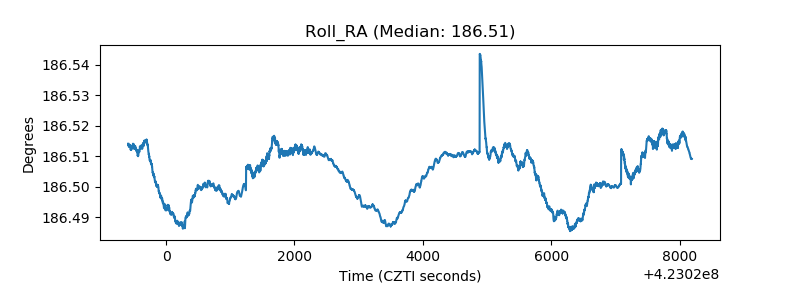 |
| Veto Counter | 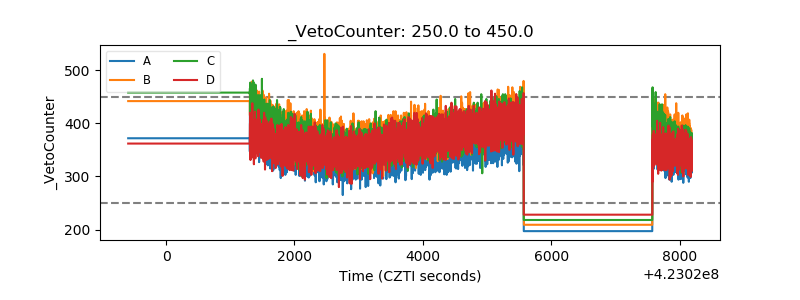 |