| Param | Original file | Final file |
|---|---|---|
| Filename | modeM0/AS1T05_100T01_9000005668_41449cztM0_level2.fits | modeM0/AS1T05_100T01_9000005668_41449cztM0_level2_quad_clean.evt |
| Size (bytes) | 306,927,360 | 85,867,200 |
| Size | 292.7 MB | 81.9 MB |
| Events in quadrant A | 2,859,424 | 575,806 |
| Events in quadrant B | 2,379,679 | 593,727 |
| Events in quadrant C | 3,086,141 | 538,990 |
| Events in quadrant D | 2,622,341 | 519,915 |
| Mode M9 | |||
|---|---|---|---|
| Quadrant | BADHDUFLAG | Total packets | Discarded packets |
| A | 0 | 27 | 0 |
| B | 0 | 27 | 0 |
| C | 0 | 27 | 0 |
| D | 0 | 28 | 0 |
| Mode SS | |||
|---|---|---|---|
| Quadrant | BADHDUFLAG | Total packets | Discarded packets |
| A | 0 | 108 | 0 |
| B | 0 | 108 | 0 |
| C | 0 | 108 | 0 |
| D | 0 | 108 | 0 |
| Mode M0 | |||
|---|---|---|---|
| Quadrant | BADHDUFLAG | Total packets | Discarded packets |
| A | 0 | 11512 | 3 |
| B | 0 | 10779 | 2 |
| C | 0 | 12453 | 2 |
| D | 0 | 11686 | 2 |
| Quadrant | Total seconds | Saturated seconds | Saturation percentage |
|---|---|---|---|
| A | 5306 | 17 | 0.320392% |
| B | 5306 | 6 | 0.113080% |
| C | 5306 | 255 | 4.805880% |
| D | 5306 | 33 | 0.621937% |
Noise dominated data is calculated using 1-second bins in cleaned event files. If a bin has >2000 counts, and if more than 50% of those come from <1% of pixels, then it is considered to be noise-dominated and hence unusable.
| Quadrant | # 1 sec bins | Bins with >0 counts | Bins with >2000 counts | High rate bins dominated by noise | Noise dominated (total time) | Noise dominated (detector-on time) | Marked lightcurve |
|---|---|---|---|---|---|---|---|
| A | 6980 | 5307 | 3 | 3 | 0.04% | 0.06% | 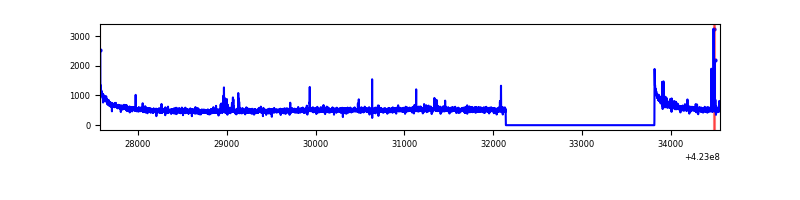 |
| B | 6980 | 5307 | 1 | 1 | 0.01% | 0.02% | 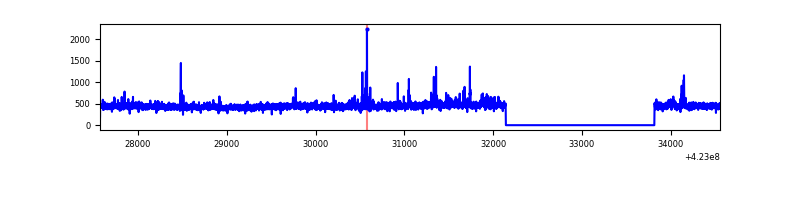 |
| C | 6980 | 5307 | 246 | 246 | 3.52% | 4.64% | 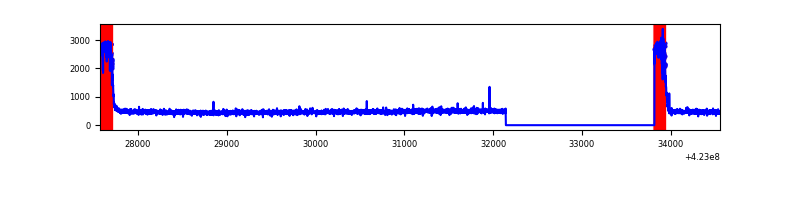 |
| D | 6980 | 5307 | 26 | 26 | 0.37% | 0.49% | 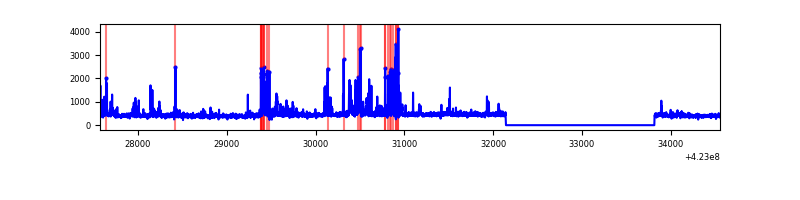 |
Top three noisy pixels from each quadrant. If the there are fewer than three noisy pixels in the level2.evt file, extra rows are filled as -1
| Pixel properties | Quadrant properties | ||||||
|---|---|---|---|---|---|---|---|
| Quadrant | DetID | PixID | Counts | Sigma | Mean | Median | Sigma |
| A | 10 | 83 | 512465 | 4234.77 | 586 | 572 | 120.9 |
| A | 13 | 248 | 41269 | 336.68 | 586 | 572 | 120.9 |
| A | 2 | 79 | 31606 | 256.74 | 586 | 572 | 120.9 |
| B | 0 | 190 | 75478 | 660.09 | 582 | 566 | 113.5 |
| B | 12 | 111 | 14613 | 123.78 | 582 | 566 | 113.5 |
| B | 11 | 111 | 13646 | 115.25 | 582 | 566 | 113.5 |
| C | 0 | 10 | 703562 | 5395.2 | 555 | 558 | 130.3 |
| C | 15 | 214 | 217727 | 1666.66 | 555 | 558 | 130.3 |
| C | 13 | 61 | 3676 | 23.93 | 555 | 558 | 130.3 |
| D | 1 | 47 | 163846 | 1173.7 | 569 | 554 | 139.1 |
| D | 13 | 249 | 104289 | 745.62 | 569 | 554 | 139.1 |
| D | 2 | 249 | 83398 | 595.46 | 569 | 554 | 139.1 |
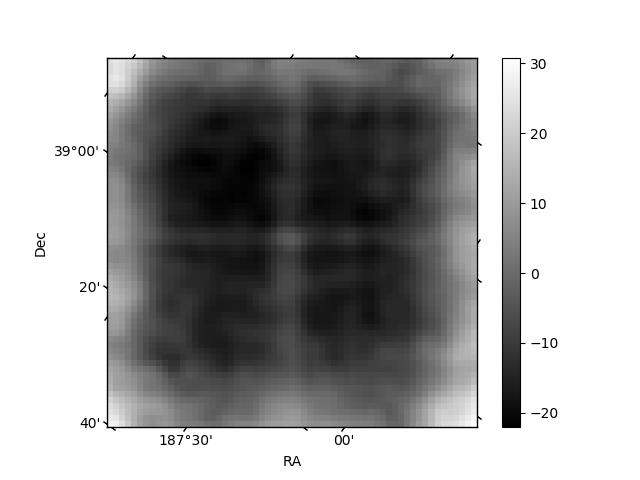
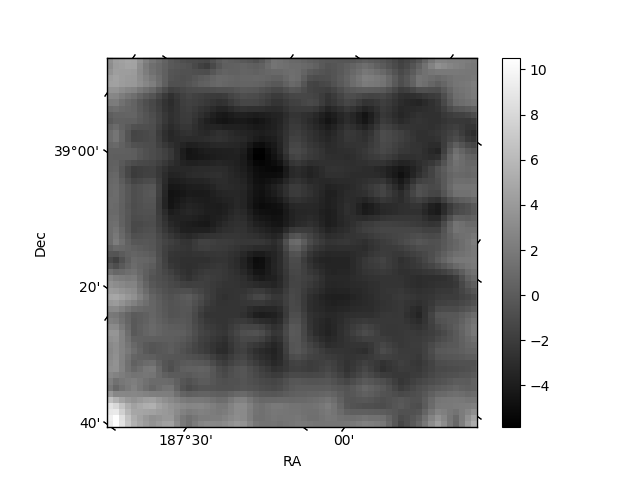
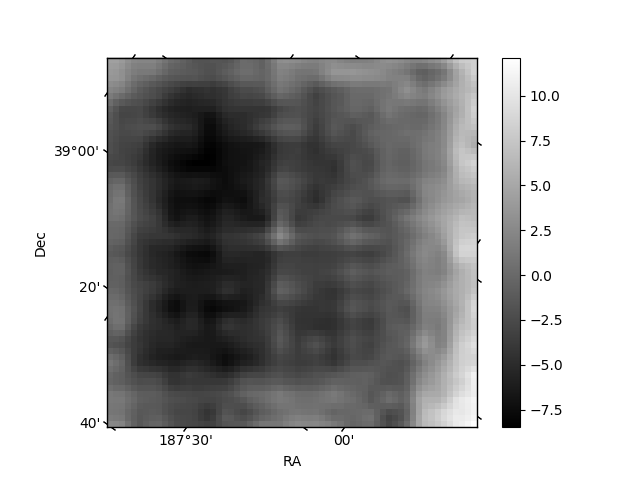
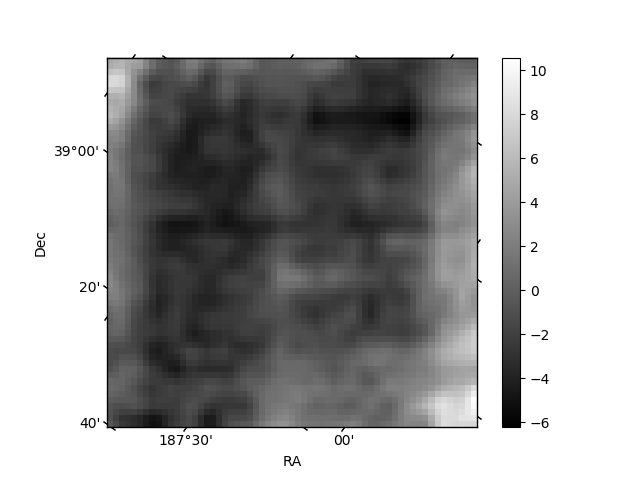
Histogram calculated using DETX and DETY for each event in the final _common_clean file
| Quadrant A | 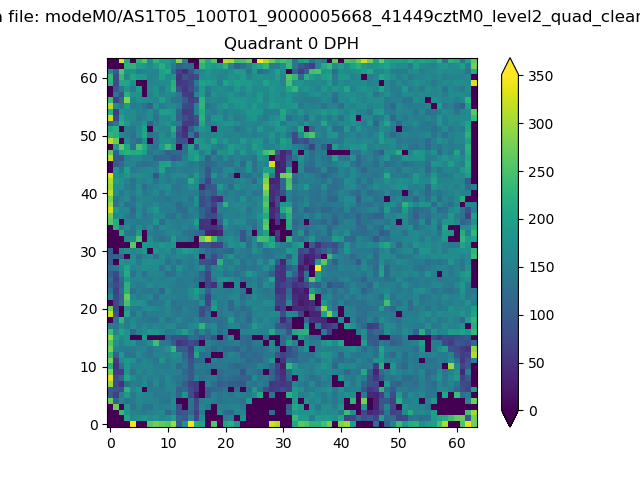 |
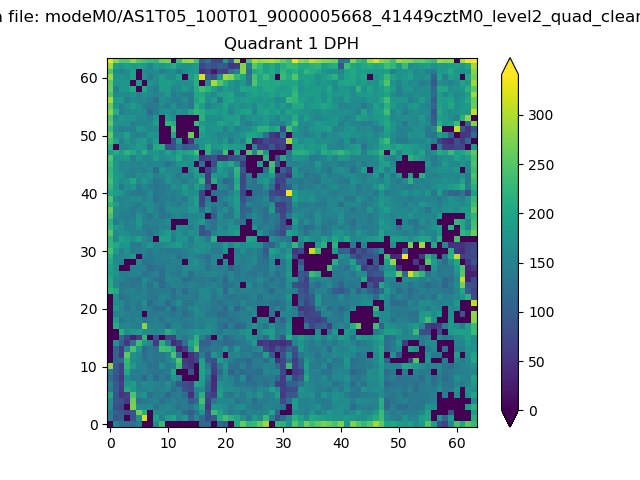 |
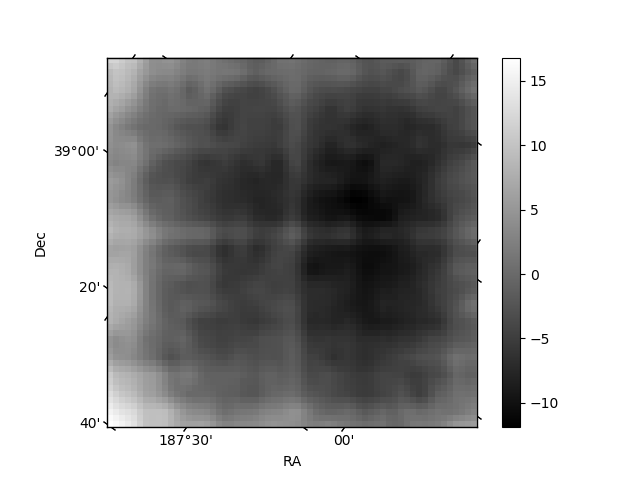
Quadrant B |
|---|---|---|---|
| Quadrant D | 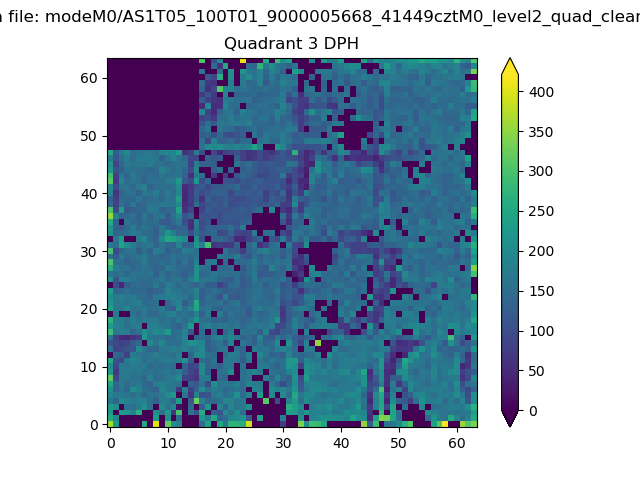 |
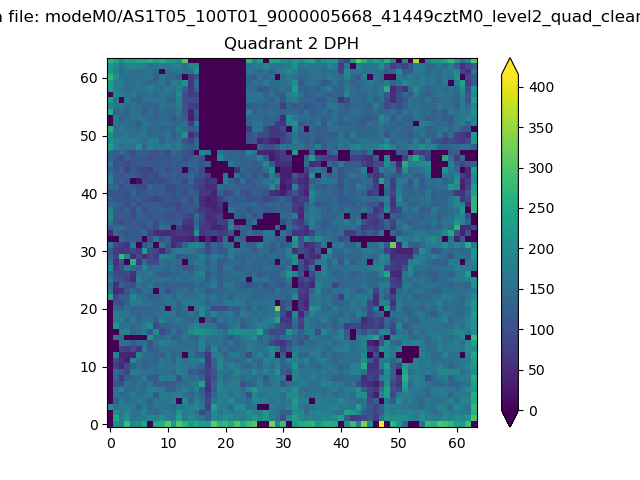 |
Quadrant C |
| Plot type | Count rate plots | Images |
|---|---|---|
| Comparison with Poisson distribution Blue bars denote a histogram of data divided into 1 sec bins. Red curve is a Poisson curve with rate = median count rate of data. |
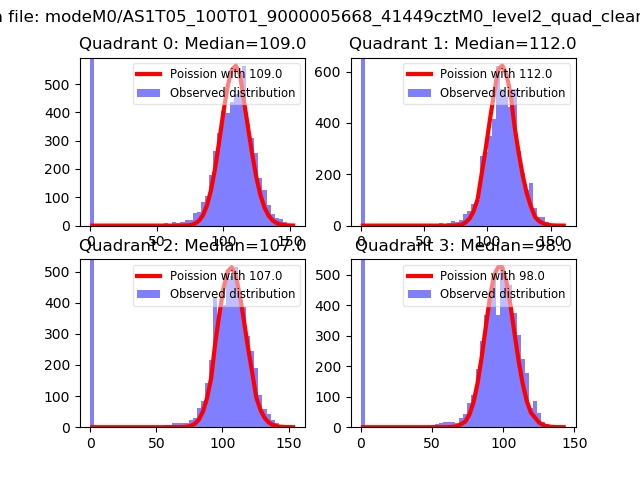 |
 |
| Quadrant-wise count rates Data is divided into 100 sec bins |
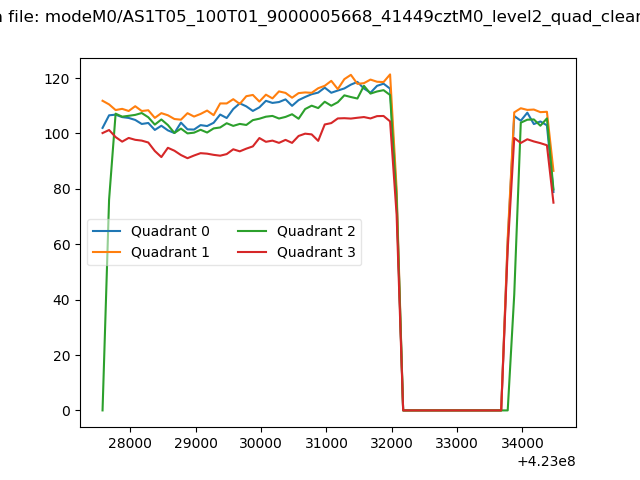 |
|
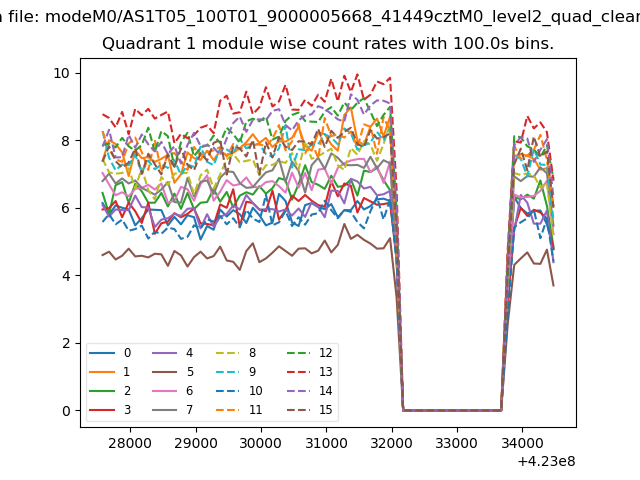
| Module-wise count rates for Quadrant A Data is divided into 100 sec bins |
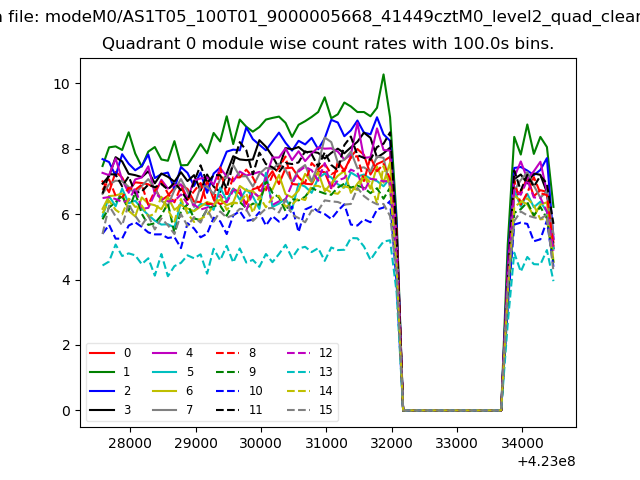 |
 |
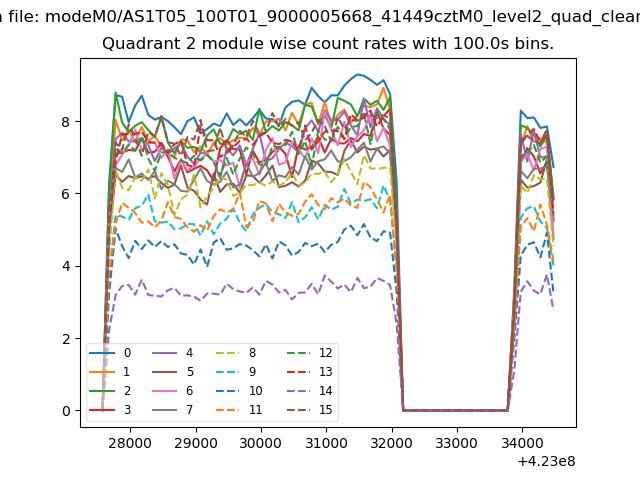
| Module-wise count rates for Quadrant B Data is divided into 100 sec bins |
 |
 |
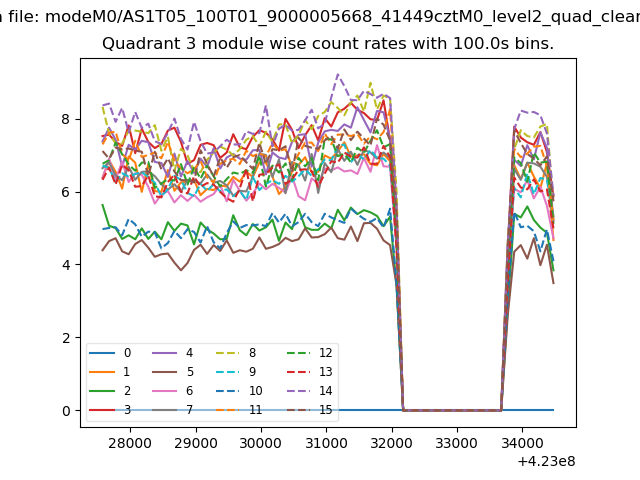
| Module-wise count rates for Quadrant C Data is divided into 100 sec bins |
 |
 |
| Module-wise count rates for Quadrant D Data is divided into 100 sec bins |
 |
 |
| Parameter | Plot |
|---|---|
| CZT HV Monitor | 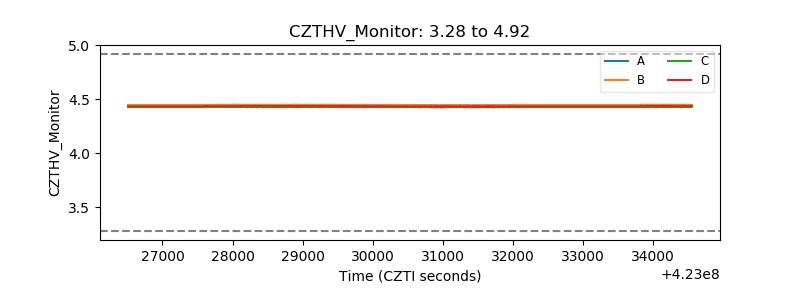 |
| D_VDD | 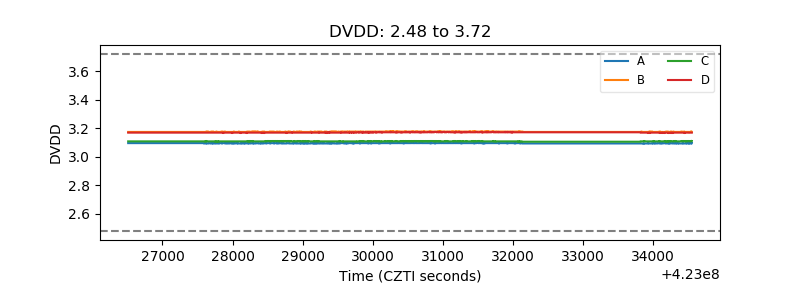 |
| Temperature 1 | 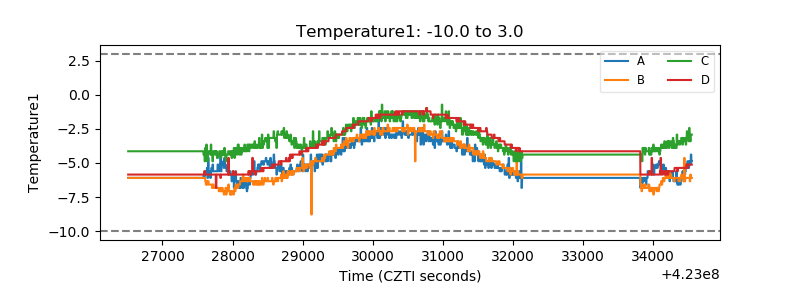 |
| Veto HV Monitor | 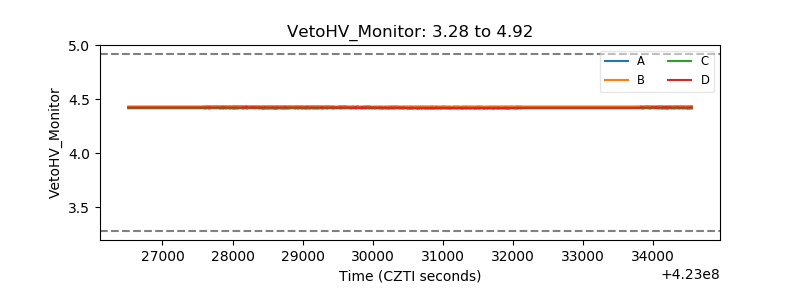 |
| Veto LLD | 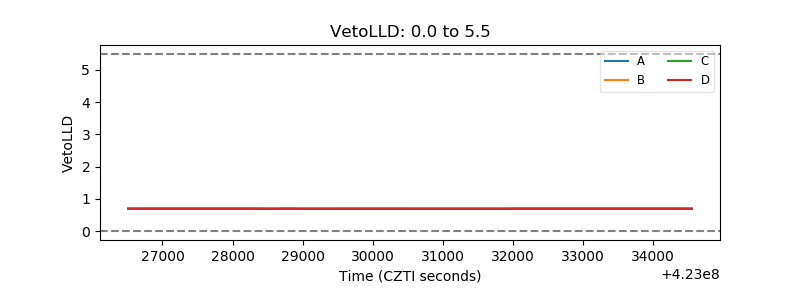 |
| Alpha Counter | 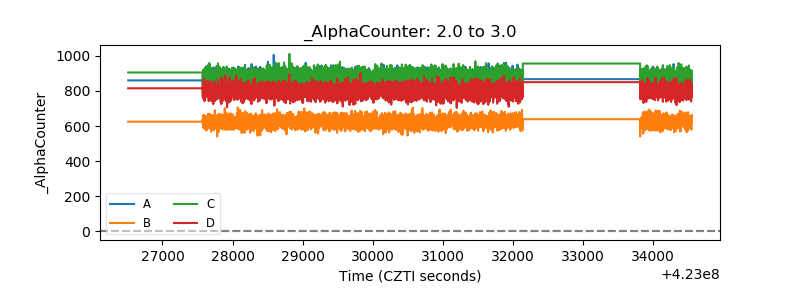 |
| _CPM_Rate | 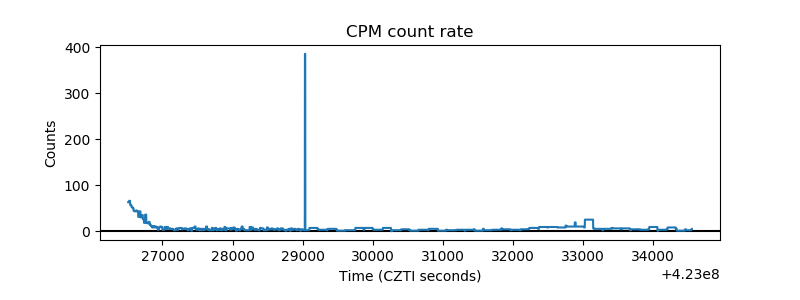 |
| CZT Counter | 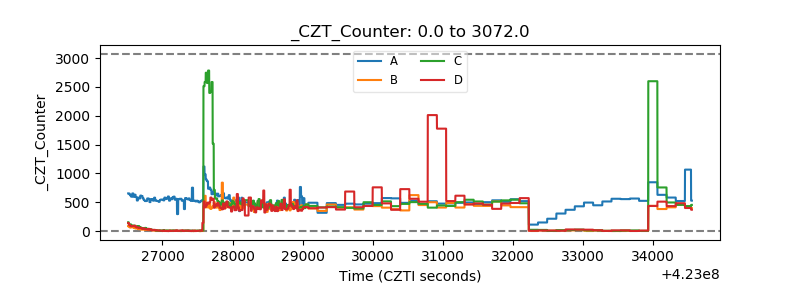 |
| +2.5 Volts monitor | 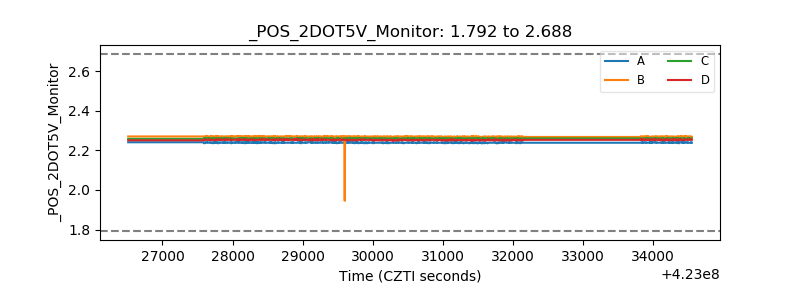 |
| +5 Volts monitor | 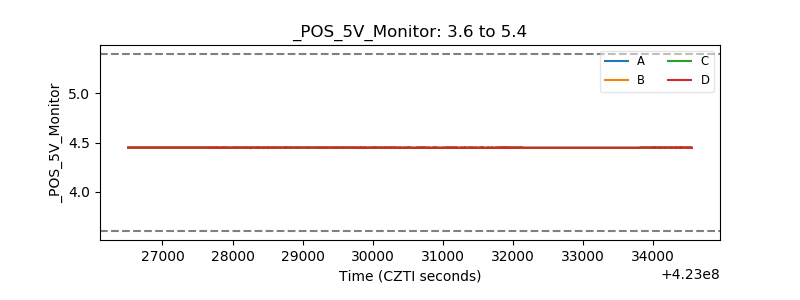 |
| _ROLL_ROT | 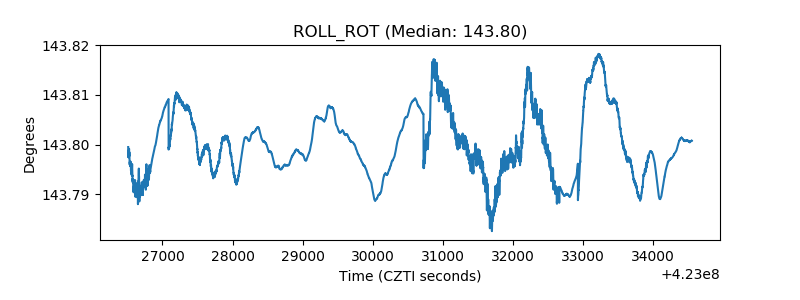 |
| _Roll_DEC | 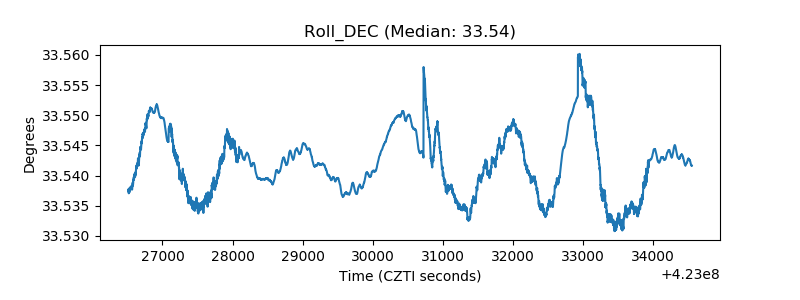 |
| _Roll_RA | 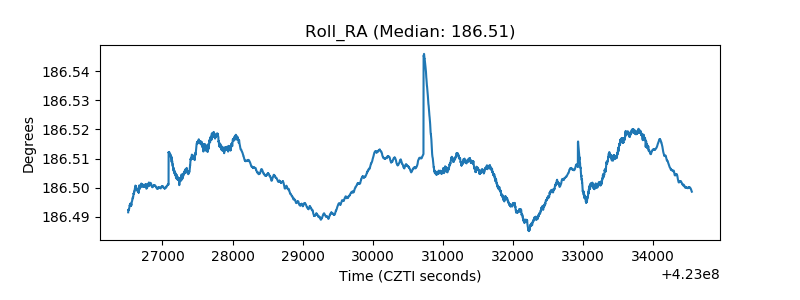 |
| Veto Counter | 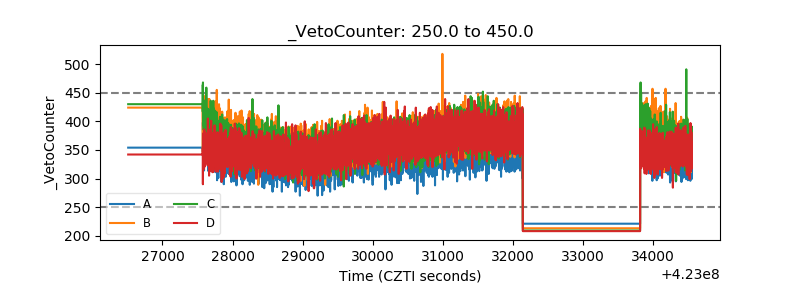 |