| Param | Original file | Final file |
|---|---|---|
| Filename | modeM0/AS1T05_100T01_9000005668_41450cztM0_level2.fits | modeM0/AS1T05_100T01_9000005668_41450cztM0_level2_quad_clean.evt |
| Size (bytes) | 361,036,800 | 103,282,560 |
| Size | 344.3 MB | 98.5 MB |
| Events in quadrant A | 3,502,796 | 690,521 |
| Events in quadrant B | 2,906,843 | 712,565 |
| Events in quadrant C | 3,589,840 | 653,177 |
| Events in quadrant D | 2,865,901 | 624,328 |
| Mode M9 | |||
|---|---|---|---|
| Quadrant | BADHDUFLAG | Total packets | Discarded packets |
| A | 0 | 31 | 0 |
| B | 0 | 31 | 0 |
| C | 0 | 31 | 0 |
| D | 0 | 31 | 0 |
| Mode SS | |||
|---|---|---|---|
| Quadrant | BADHDUFLAG | Total packets | Discarded packets |
| A | 0 | 130 | 0 |
| B | 0 | 130 | 0 |
| C | 0 | 130 | 0 |
| D | 0 | 130 | 0 |
| Mode M0 | |||
|---|---|---|---|
| Quadrant | BADHDUFLAG | Total packets | Discarded packets |
| A | 0 | 13992 | 3 |
| B | 0 | 13066 | 2 |
| C | 0 | 14517 | 2 |
| D | 0 | 13229 | 2 |
| Quadrant | Total seconds | Saturated seconds | Saturation percentage |
|---|---|---|---|
| A | 6409 | 31 | 0.483695% |
| B | 6409 | 5 | 0.078015% |
| C | 6409 | 238 | 3.713528% |
| D | 6409 | 13 | 0.202840% |
Noise dominated data is calculated using 1-second bins in cleaned event files. If a bin has >2000 counts, and if more than 50% of those come from <1% of pixels, then it is considered to be noise-dominated and hence unusable.
| Quadrant | # 1 sec bins | Bins with >0 counts | Bins with >2000 counts | High rate bins dominated by noise | Noise dominated (total time) | Noise dominated (detector-on time) | Marked lightcurve |
|---|---|---|---|---|---|---|---|
| A | 9486 | 6411 | 15 | 15 | 0.16% | 0.23% | 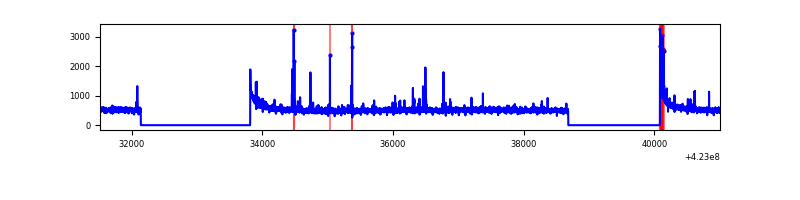 |
| B | 9486 | 6411 | 1 | 1 | 0.01% | 0.02% | 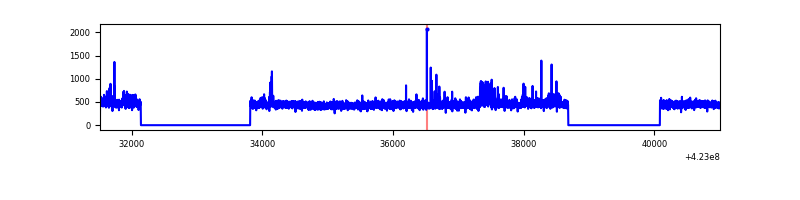 |
| C | 9486 | 6411 | 229 | 229 | 2.41% | 3.57% | 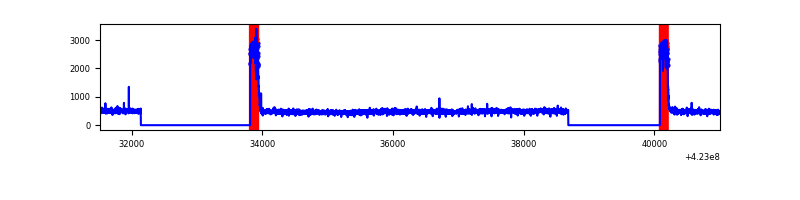 |
| D | 9486 | 6411 | 10 | 10 | 0.11% | 0.16% | 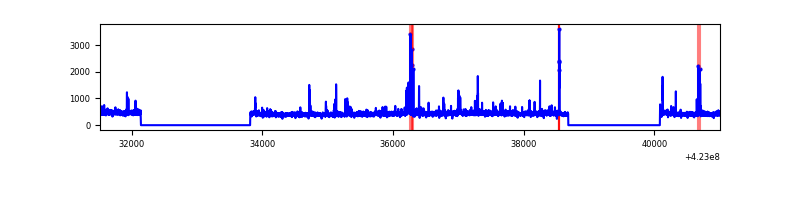 |
Top three noisy pixels from each quadrant. If the there are fewer than three noisy pixels in the level2.evt file, extra rows are filled as -1
| Pixel properties | Quadrant properties | ||||||
|---|---|---|---|---|---|---|---|
| Quadrant | DetID | PixID | Counts | Sigma | Mean | Median | Sigma |
| A | 10 | 83 | 593995 | 4045.84 | 713 | 697 | 146.6 |
| A | 13 | 248 | 114436 | 775.61 | 713 | 697 | 146.6 |
| A | 2 | 79 | 29140 | 193.96 | 713 | 697 | 146.6 |
| B | 0 | 190 | 102360 | 738.18 | 707 | 688 | 137.7 |
| B | 12 | 111 | 17918 | 125.1 | 707 | 688 | 137.7 |
| B | 11 | 111 | 16382 | 113.94 | 707 | 688 | 137.7 |
| C | 0 | 10 | 663259 | 4143.26 | 681 | 685 | 159.9 |
| C | 15 | 214 | 264587 | 1650.25 | 681 | 685 | 159.9 |
| C | 12 | 249 | 5876 | 32.46 | 681 | 685 | 159.9 |
| D | 13 | 249 | 84456 | 493.2 | 696 | 677 | 169.9 |
| D | 1 | 47 | 27470 | 157.73 | 696 | 677 | 169.9 |
| D | 12 | 233 | 26122 | 149.79 | 696 | 677 | 169.9 |
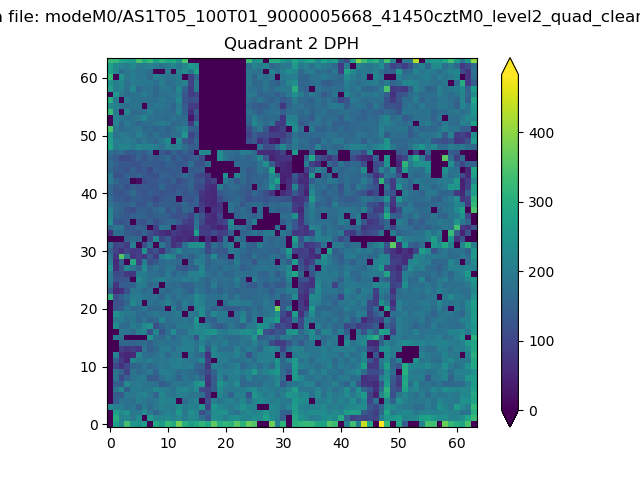
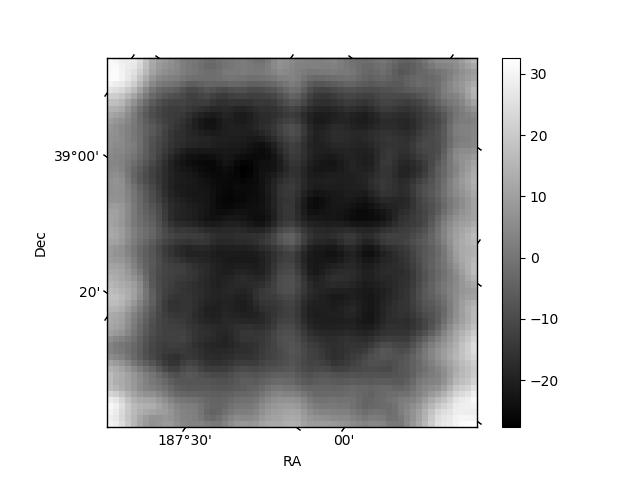
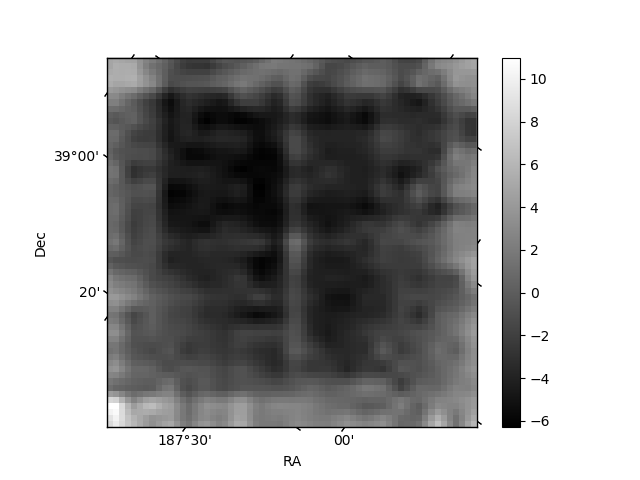
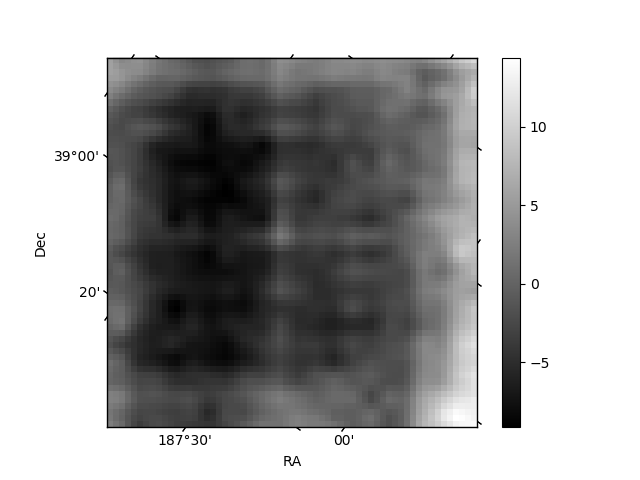
Histogram calculated using DETX and DETY for each event in the final _common_clean file
| Quadrant A | 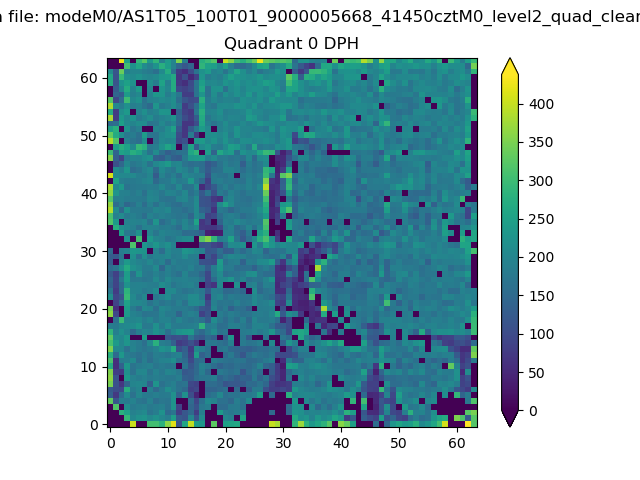 |
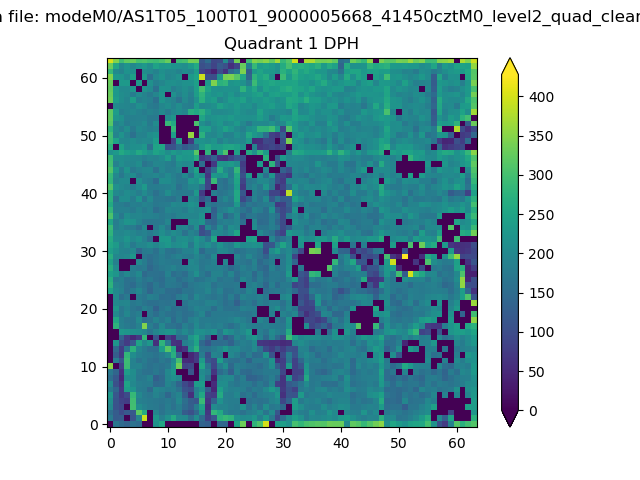 |
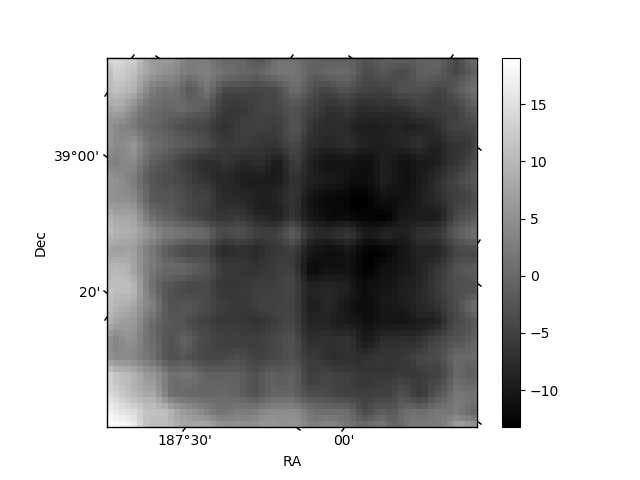
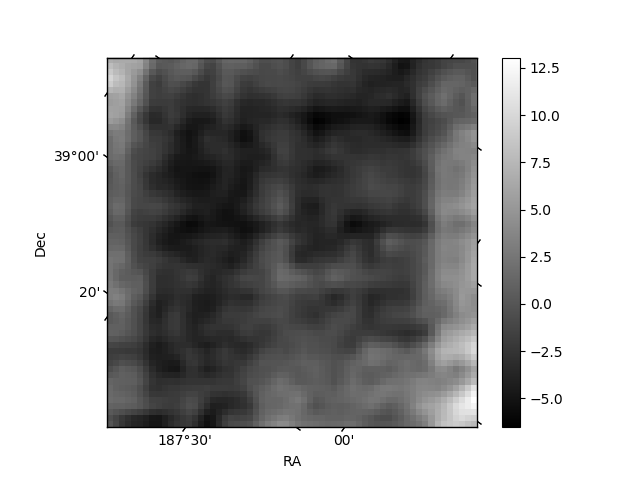
Quadrant B |
|---|---|---|---|
| Quadrant D | 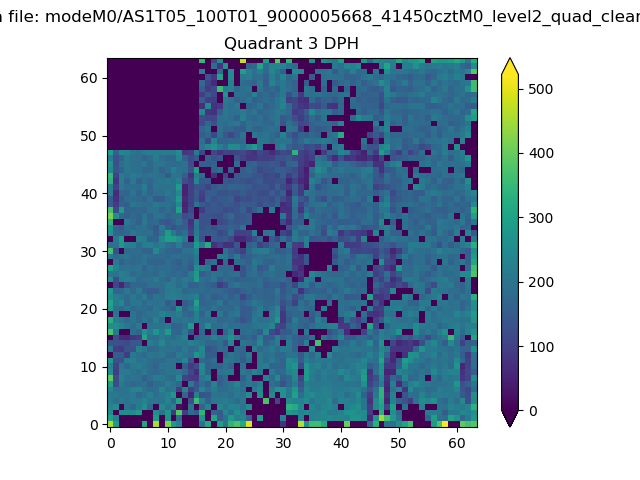 |
 |
Quadrant C |
| Plot type | Count rate plots | Images |
|---|---|---|
| Comparison with Poisson distribution Blue bars denote a histogram of data divided into 1 sec bins. Red curve is a Poisson curve with rate = median count rate of data. |
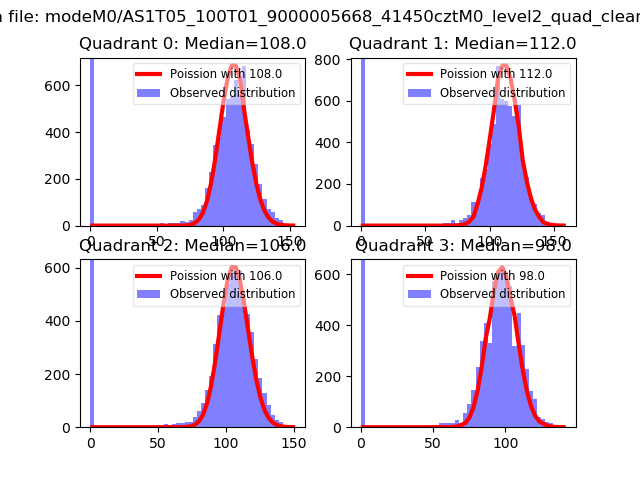 |
 |
| Quadrant-wise count rates Data is divided into 100 sec bins |
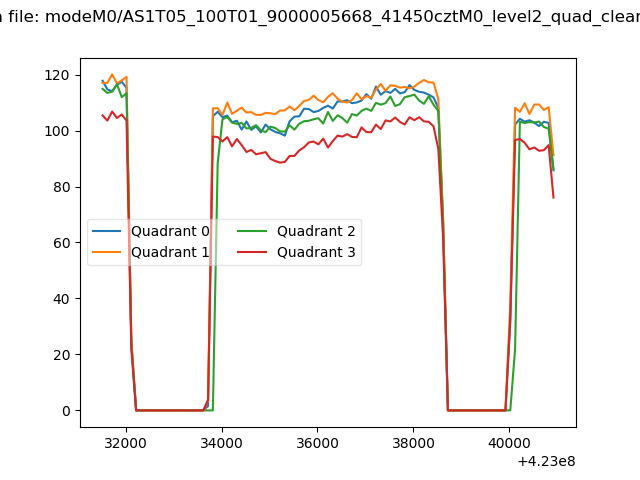 |
|
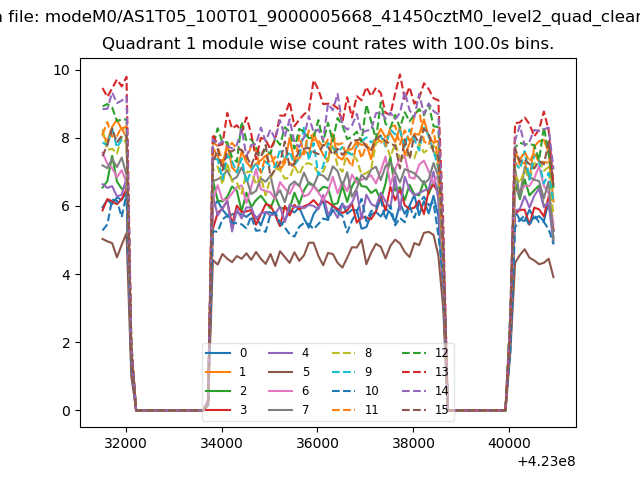
| Module-wise count rates for Quadrant A Data is divided into 100 sec bins |
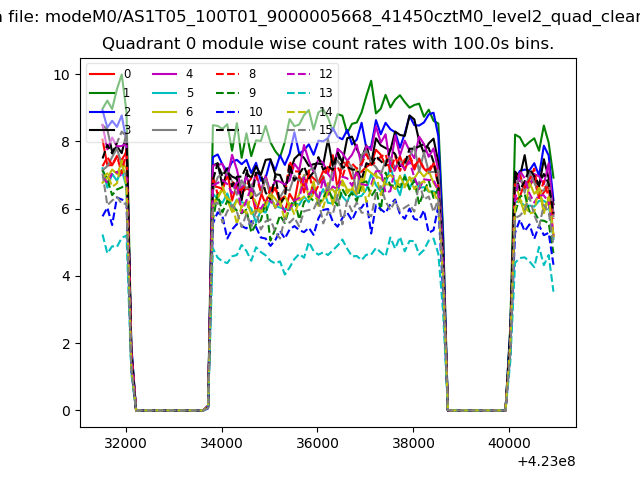 |
 |
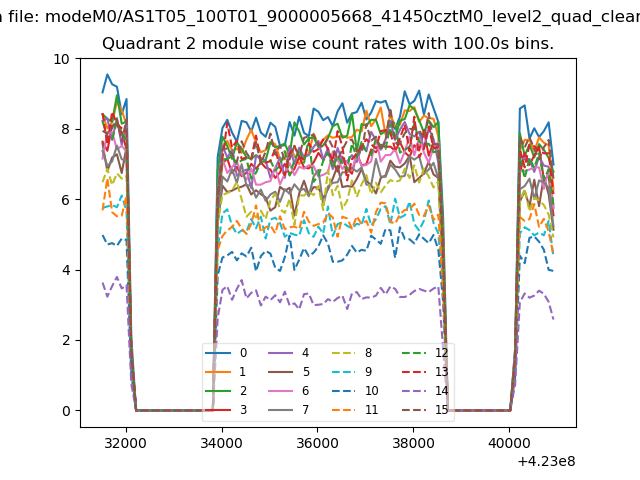
| Module-wise count rates for Quadrant B Data is divided into 100 sec bins |
 |
 |
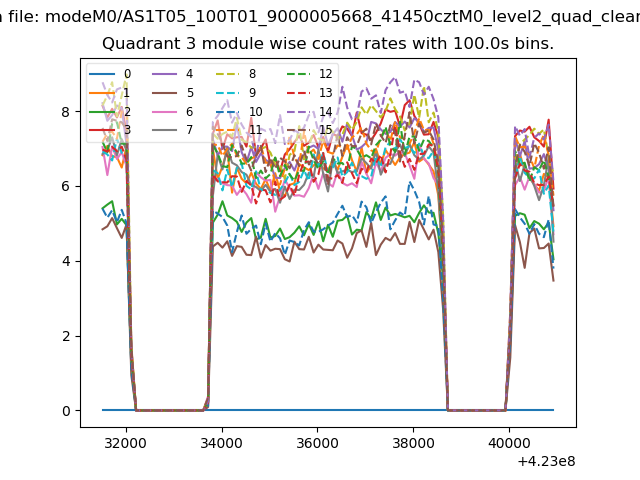
| Module-wise count rates for Quadrant C Data is divided into 100 sec bins |
 |
 |
| Module-wise count rates for Quadrant D Data is divided into 100 sec bins |
 |
 |
| Parameter | Plot |
|---|---|
| CZT HV Monitor | 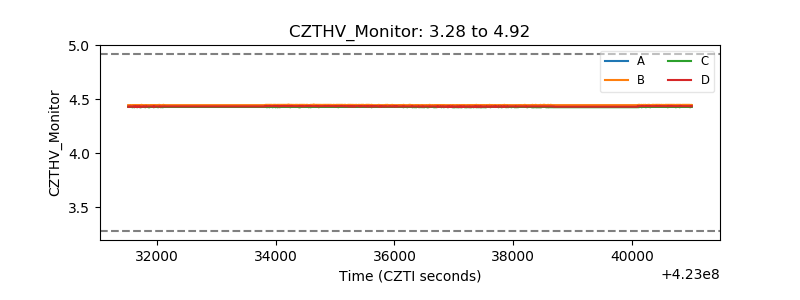 |
| D_VDD | 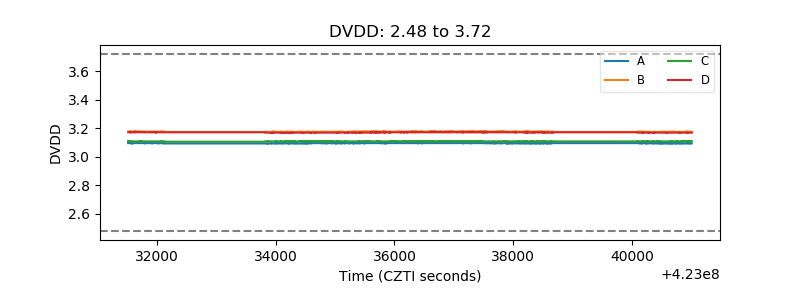 |
| Temperature 1 | 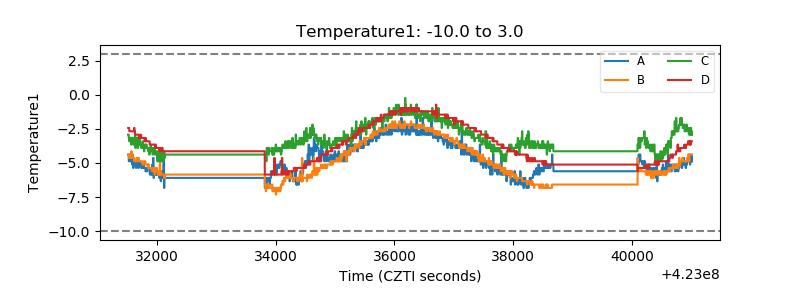 |
| Veto HV Monitor | 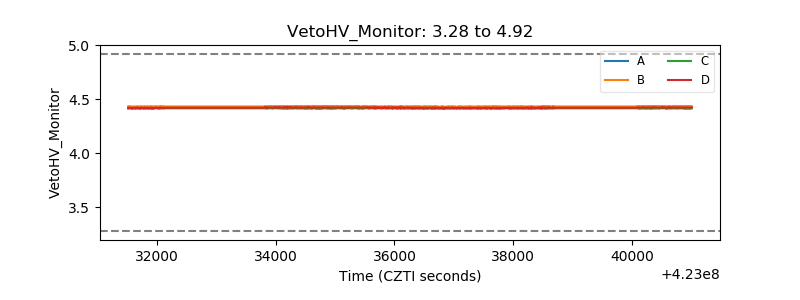 |
| Veto LLD | 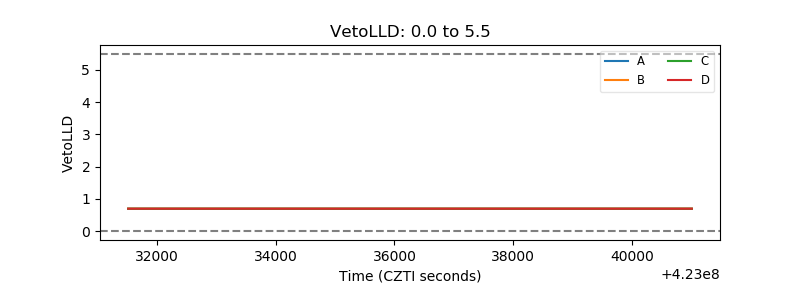 |
| Alpha Counter | 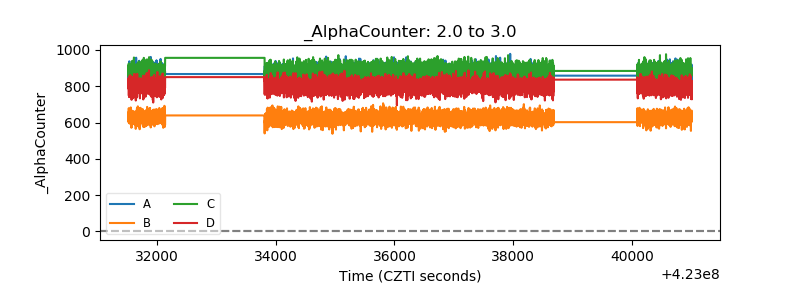 |
| _CPM_Rate | 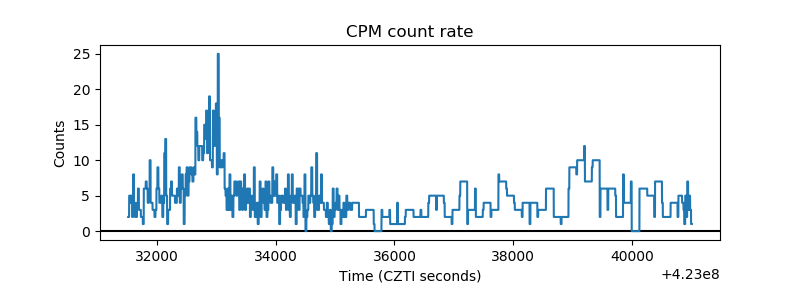 |
| CZT Counter | 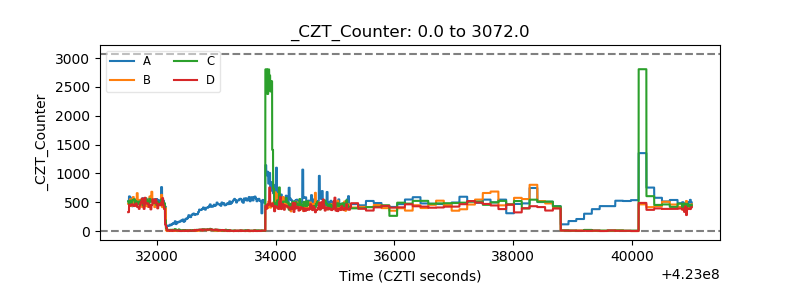 |
| +2.5 Volts monitor | 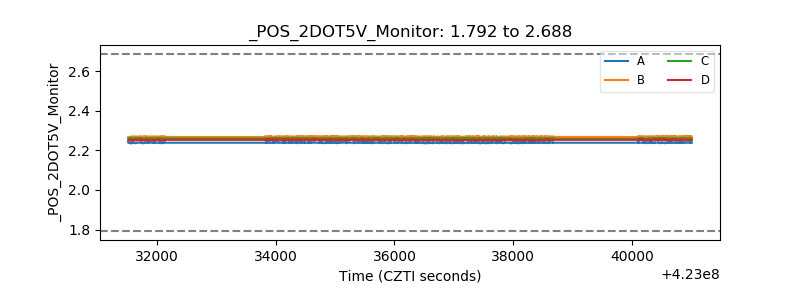 |
| +5 Volts monitor | 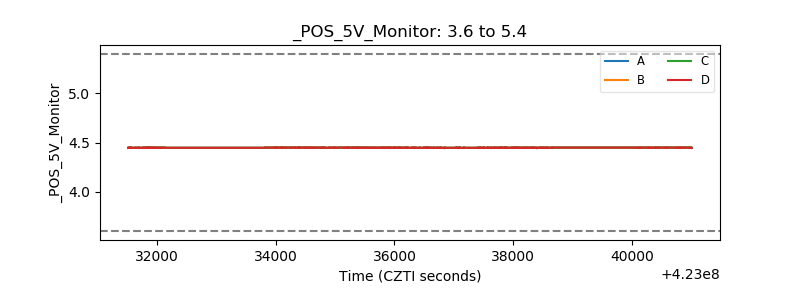 |
| _ROLL_ROT | 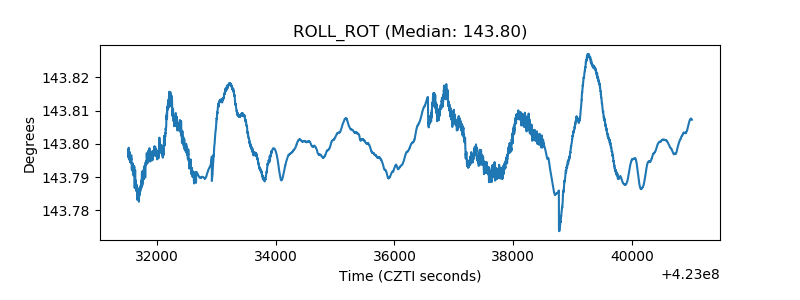 |
| _Roll_DEC | 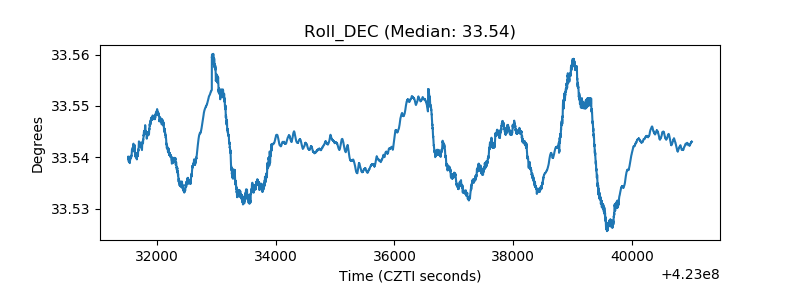 |
| _Roll_RA | 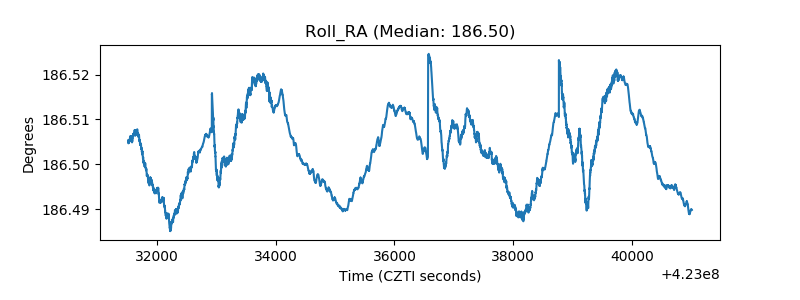 |
| Veto Counter | 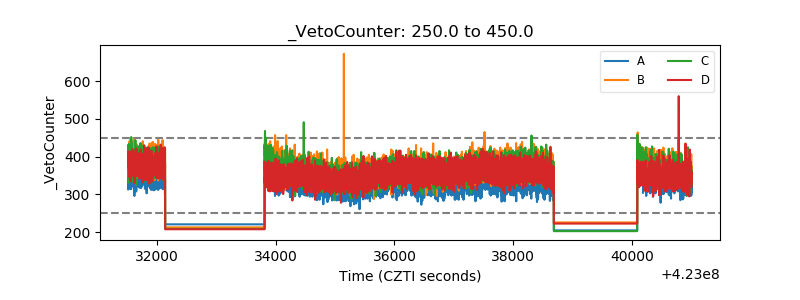 |