| Param | Original file | Final file |
|---|---|---|
| Filename | modeM0/AS1T05_100T01_9000005668_41451cztM0_level2.fits | modeM0/AS1T05_100T01_9000005668_41451cztM0_level2_quad_clean.evt |
| Size (bytes) | 322,260,480 | 83,868,480 |
| Size | 307.3 MB | 80.0 MB |
| Events in quadrant A | 3,072,731 | 558,118 |
| Events in quadrant B | 2,447,635 | 581,587 |
| Events in quadrant C | 2,970,007 | 535,529 |
| Events in quadrant D | 3,020,065 | 487,750 |
| Mode M9 | |||
|---|---|---|---|
| Quadrant | BADHDUFLAG | Total packets | Discarded packets |
| A | 0 | 27 | 1 |
| B | 0 | 27 | 1 |
| C | 0 | 27 | 1 |
| D | 0 | 27 | 1 |
| Mode SS | |||
|---|---|---|---|
| Quadrant | BADHDUFLAG | Total packets | Discarded packets |
| A | 0 | 127 | 7 |
| B | 0 | 128 | 12 |
| C | 0 | 129 | 13 |
| D | 0 | 130 | 22 |
| Mode M0 | |||
|---|---|---|---|
| Quadrant | BADHDUFLAG | Total packets | Discarded packets |
| A | 0 | 14365 | 2091 |
| B | 0 | 12647 | 1679 |
| C | 0 | 13935 | 1867 |
| D | 0 | 14938 | 2121 |
| Quadrant | Total seconds | Saturated seconds | Saturation percentage |
|---|---|---|---|
| A | 5326 | 28 | 0.525723% |
| B | 5370 | 8 | 0.148976% |
| C | 5383 | 177 | 3.288129% |
| D | 5340 | 192 | 3.595506% |
Noise dominated data is calculated using 1-second bins in cleaned event files. If a bin has >2000 counts, and if more than 50% of those come from <1% of pixels, then it is considered to be noise-dominated and hence unusable.
| Quadrant | # 1 sec bins | Bins with >0 counts | Bins with >2000 counts | High rate bins dominated by noise | Noise dominated (total time) | Noise dominated (detector-on time) | Marked lightcurve |
|---|---|---|---|---|---|---|---|
| A | 8965 | 5683 | 15 | 15 | 0.17% | 0.26% | 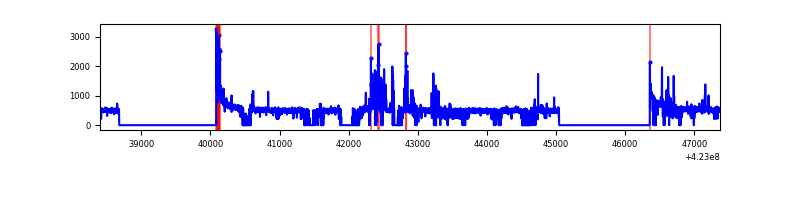 |
| B | 8965 | 5704 | 1 | 1 | 0.01% | 0.02% | 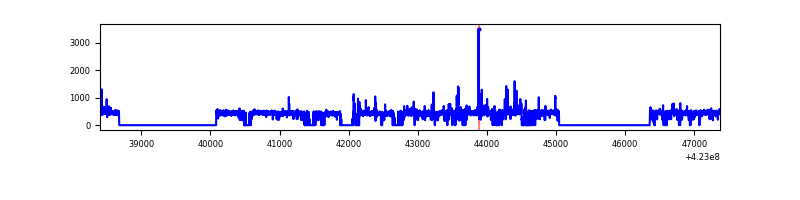 |
| C | 8965 | 5709 | 170 | 170 | 1.90% | 2.98% | 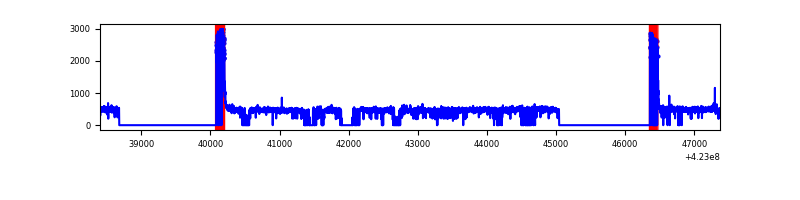 |
| D | 8965 | 5689 | 167 | 167 | 1.86% | 2.94% | 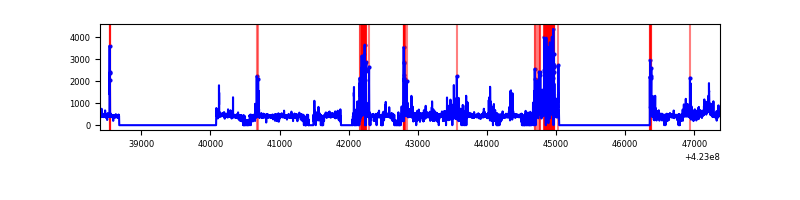 |
Top three noisy pixels from each quadrant. If the there are fewer than three noisy pixels in the level2.evt file, extra rows are filled as -1
| Pixel properties | Quadrant properties | ||||||
|---|---|---|---|---|---|---|---|
| Quadrant | DetID | PixID | Counts | Sigma | Mean | Median | Sigma |
| A | 10 | 83 | 505640 | 4119.67 | 591 | 577 | 122.6 |
| A | 13 | 248 | 255827 | 2082.01 | 591 | 577 | 122.6 |
| A | 2 | 79 | 21920 | 174.09 | 591 | 577 | 122.6 |
| B | 5 | 255 | 44486 | 376.62 | 593 | 576 | 116.6 |
| B | 0 | 190 | 41088 | 347.48 | 593 | 576 | 116.6 |
| B | 0 | 186 | 22694 | 189.71 | 593 | 576 | 116.6 |
| C | 0 | 10 | 514182 | 3819.65 | 572 | 576 | 134.5 |
| C | 15 | 214 | 223493 | 1657.82 | 572 | 576 | 134.5 |
| C | 12 | 249 | 4978 | 32.74 | 572 | 576 | 134.5 |
| D | 13 | 249 | 686190 | 4915.69 | 567 | 550 | 139.5 |
| D | 1 | 47 | 88526 | 630.74 | 567 | 550 | 139.5 |
| D | 2 | 249 | 29531 | 207.78 | 567 | 550 | 139.5 |
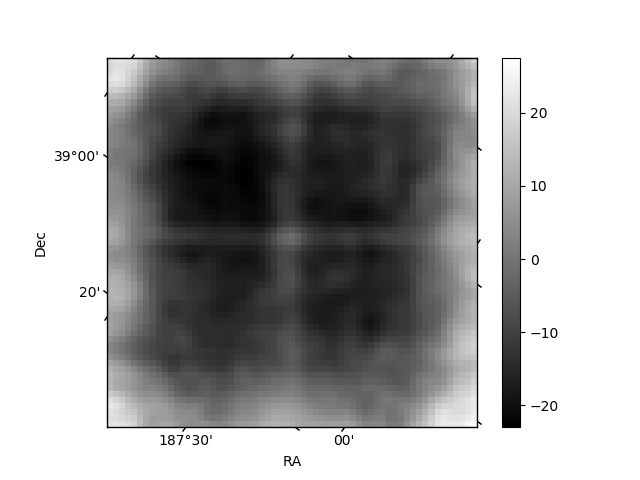
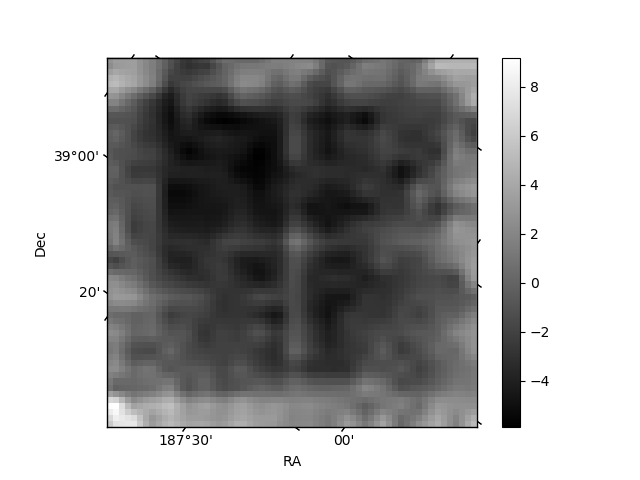
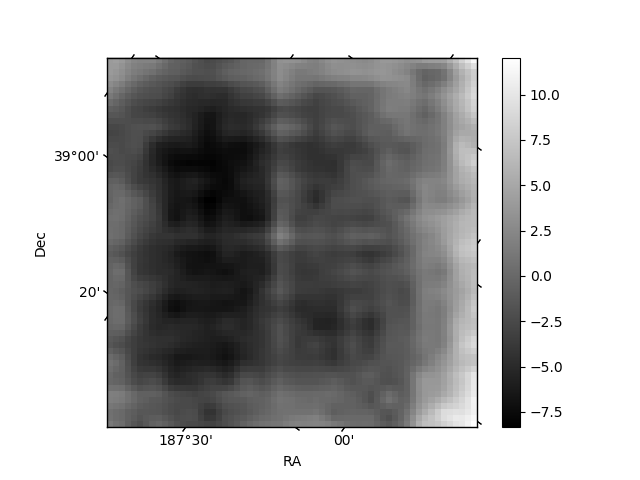
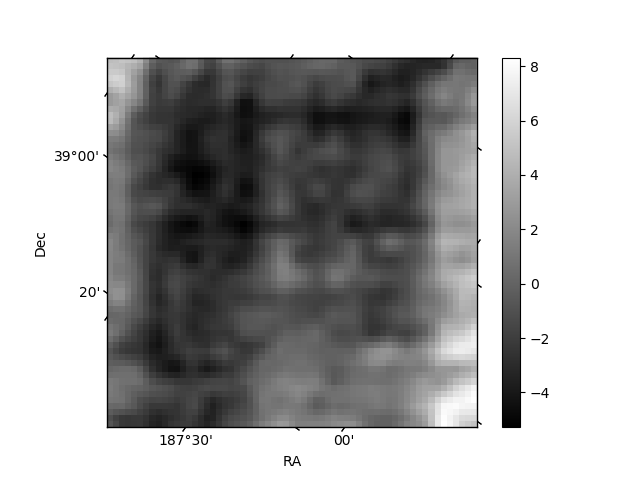
Histogram calculated using DETX and DETY for each event in the final _common_clean file
| Quadrant A | 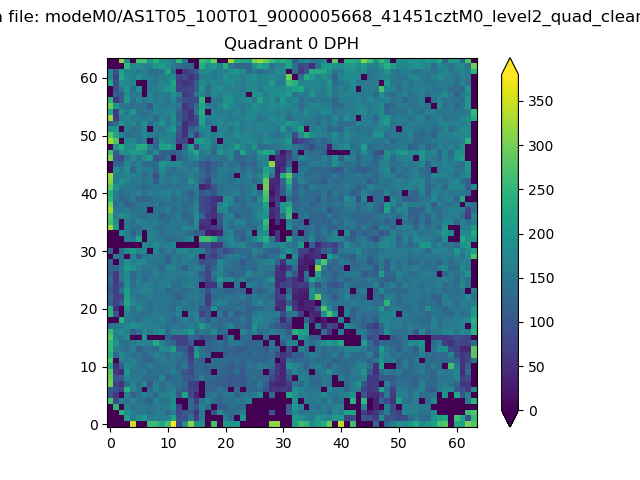 |
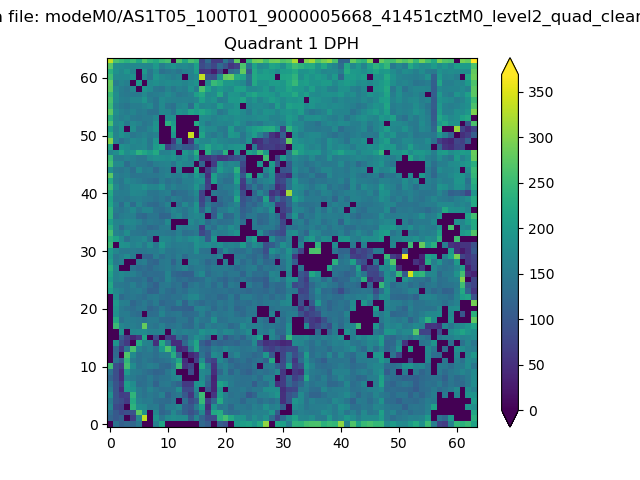 |
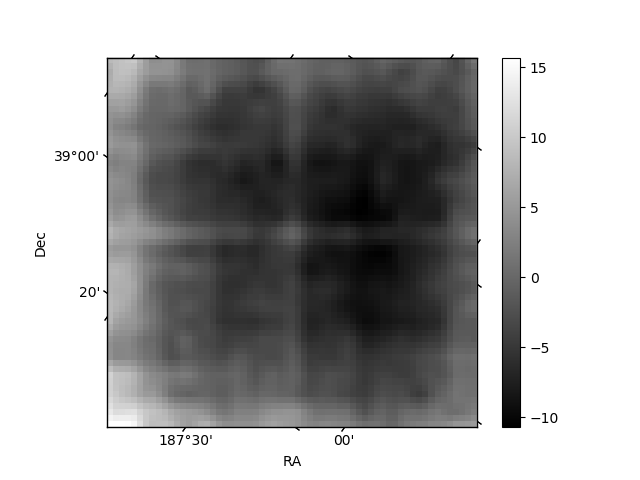
Quadrant B |
|---|---|---|---|
| Quadrant D | 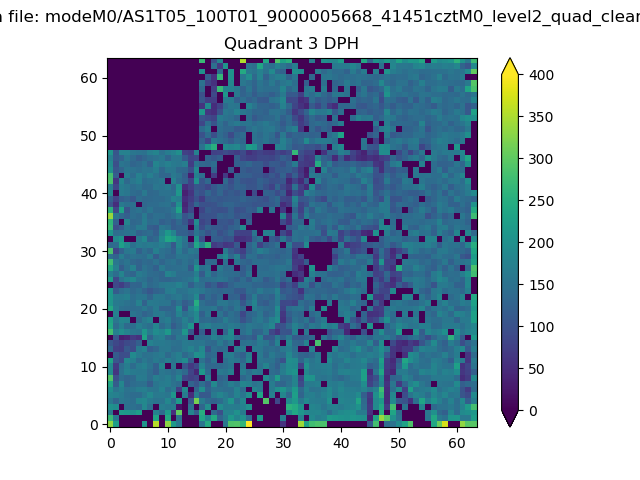 |
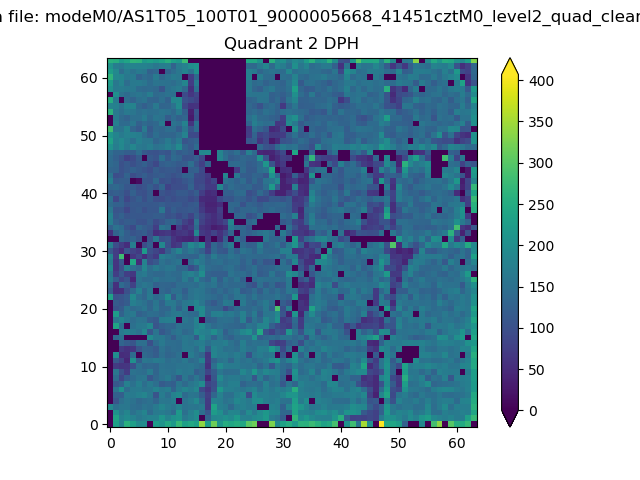 |
Quadrant C |
| Plot type | Count rate plots | Images |
|---|---|---|
| Comparison with Poisson distribution Blue bars denote a histogram of data divided into 1 sec bins. Red curve is a Poisson curve with rate = median count rate of data. |
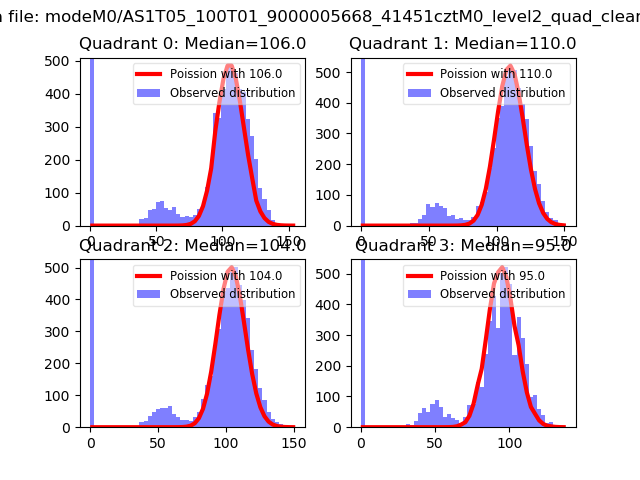 |
 |
| Quadrant-wise count rates Data is divided into 100 sec bins |
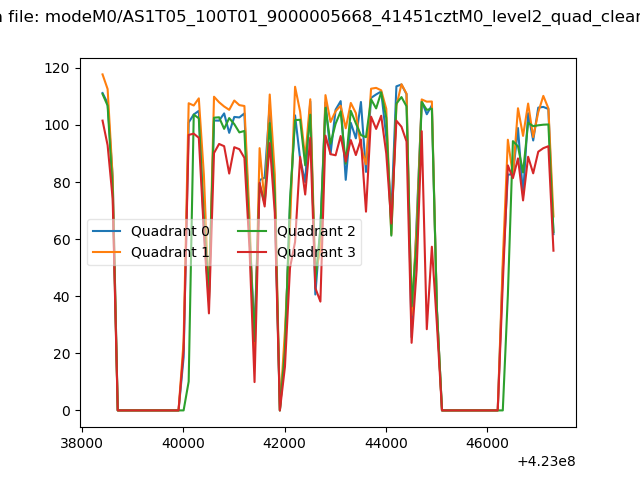 |
|
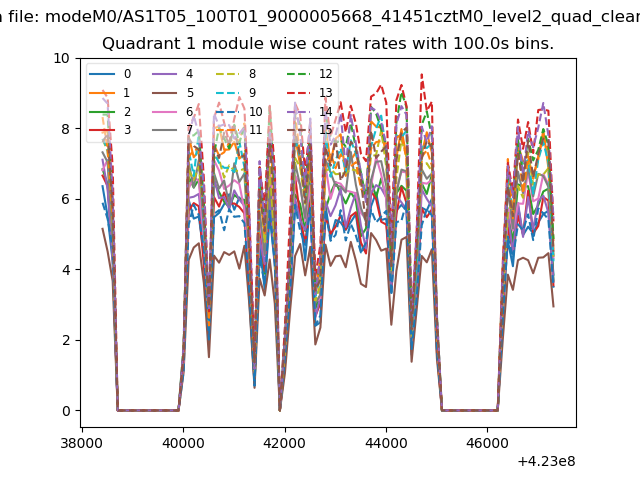
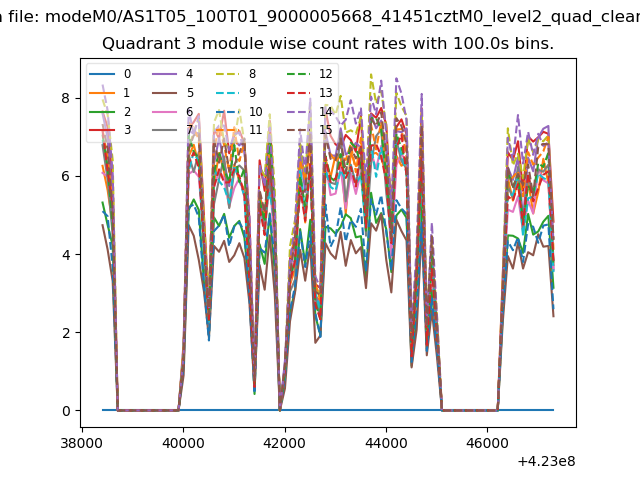
| Module-wise count rates for Quadrant A Data is divided into 100 sec bins |
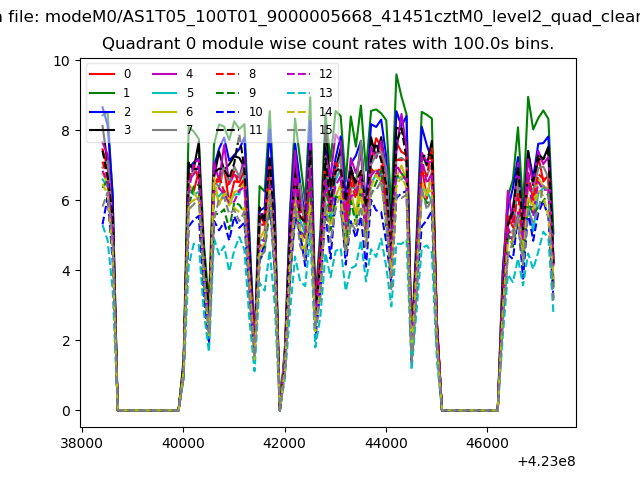 |
 |
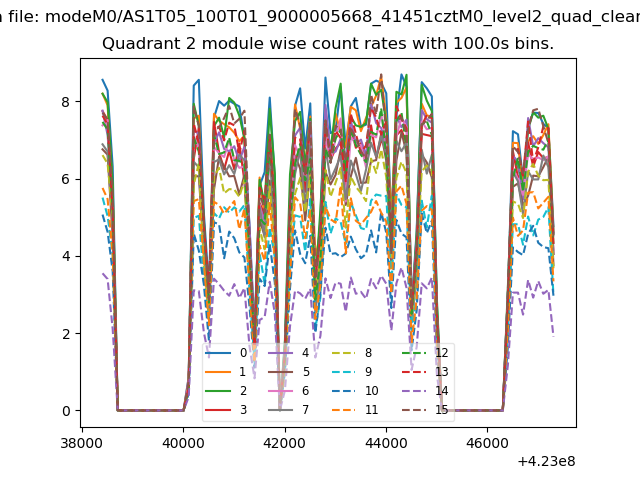
| Module-wise count rates for Quadrant B Data is divided into 100 sec bins |
 |
 |
| Module-wise count rates for Quadrant C Data is divided into 100 sec bins |
 |
 |
| Module-wise count rates for Quadrant D Data is divided into 100 sec bins |
 |
 |
| Parameter | Plot |
|---|---|
| CZT HV Monitor | 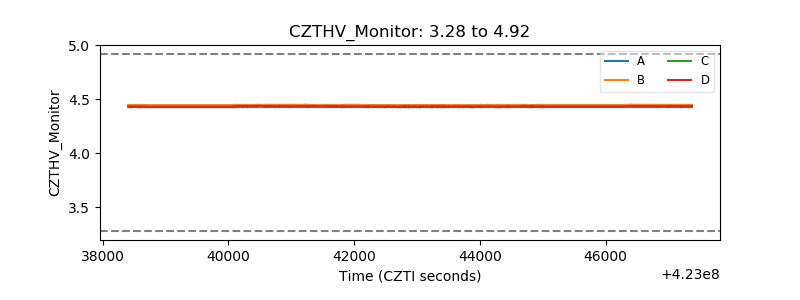 |
| D_VDD | 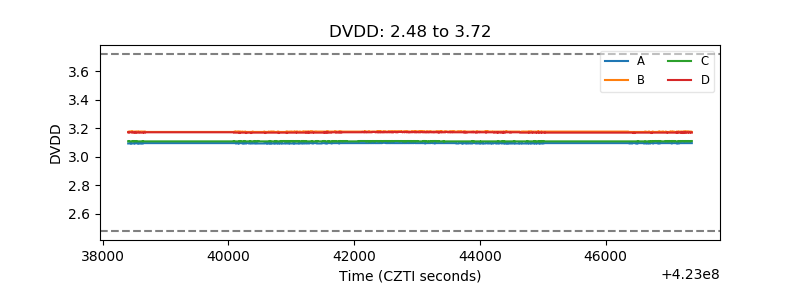 |
| Temperature 1 | 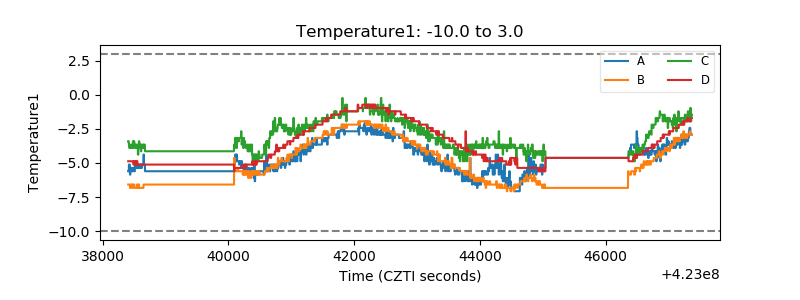 |
| Veto HV Monitor | 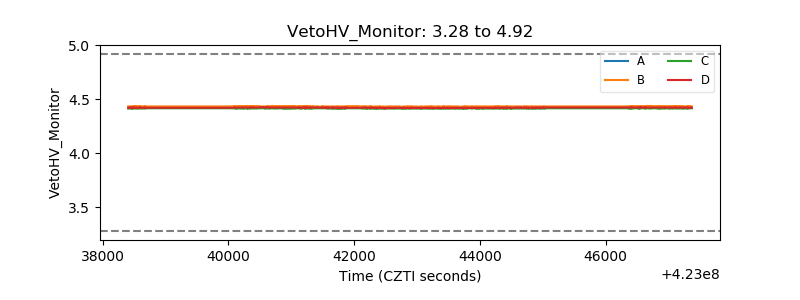 |
| Veto LLD | 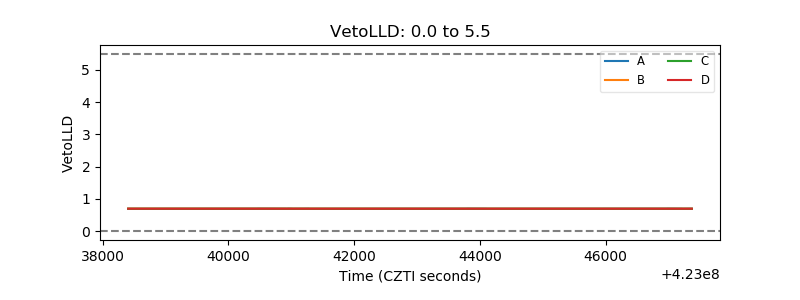 |
| Alpha Counter | 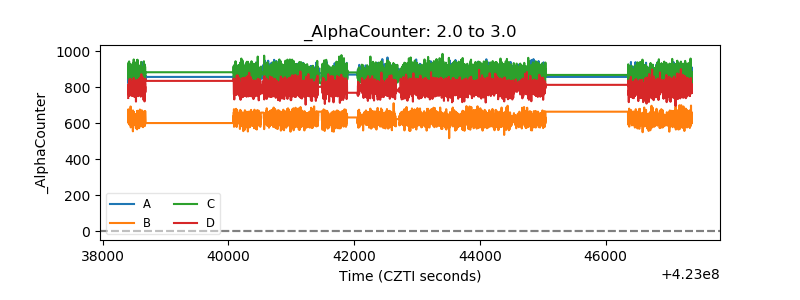 |
| _CPM_Rate |  |
| CZT Counter | 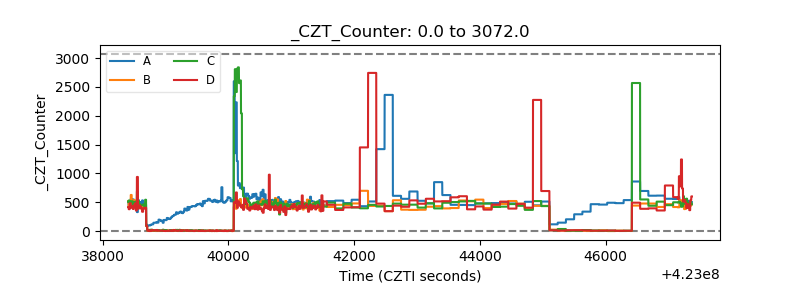 |
| +2.5 Volts monitor | 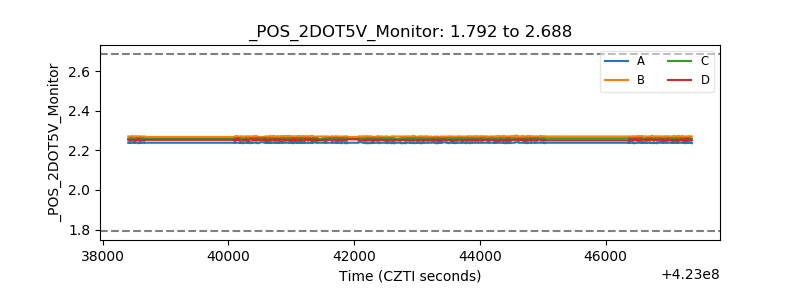 |
| +5 Volts monitor | 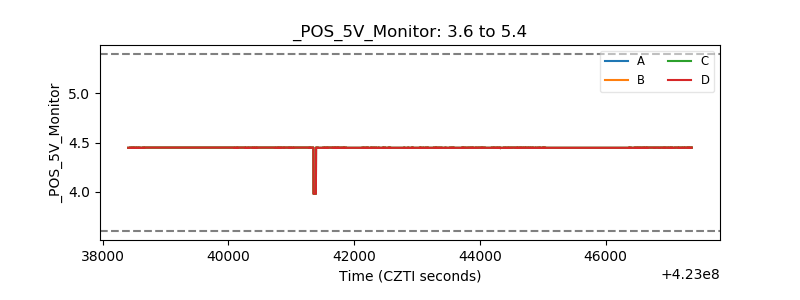 |
| _ROLL_ROT | 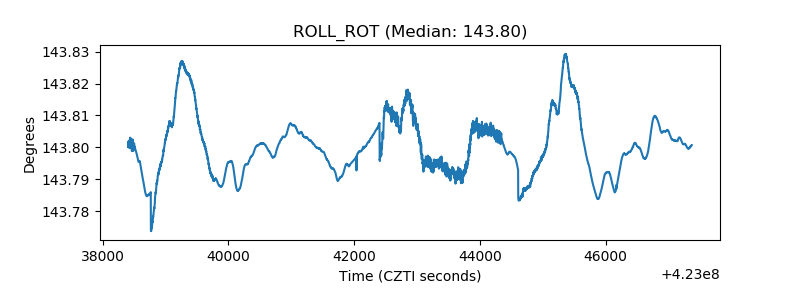 |
| _Roll_DEC | 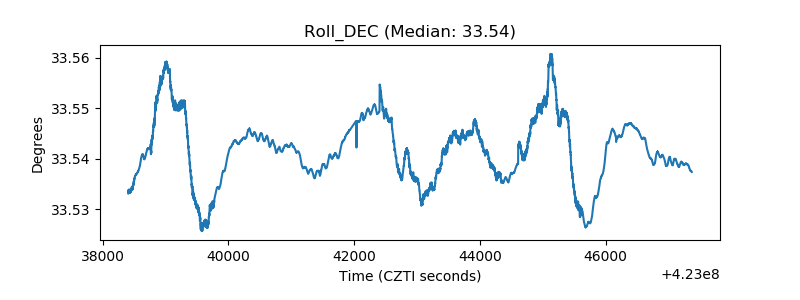 |
| _Roll_RA | 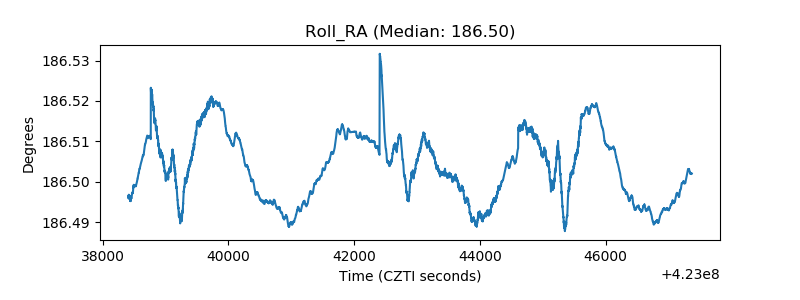 |
| Veto Counter | 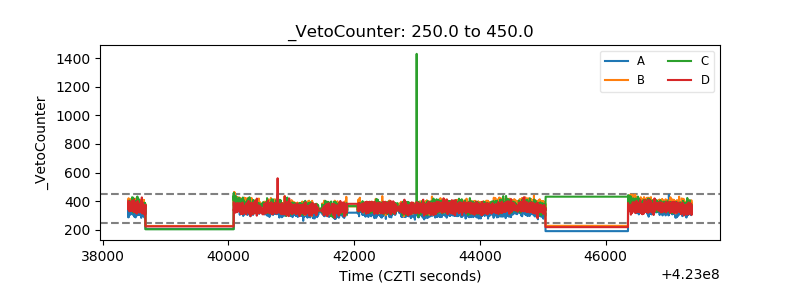 |