| Param | Original file | Final file |
|---|---|---|
| Filename | modeM0/AS1T05_100T01_9000005668_41454cztM0_level2.fits | modeM0/AS1T05_100T01_9000005668_41454cztM0_level2_quad_clean.evt |
| Size (bytes) | 957,196,800 | 247,083,840 |
| Size | 912.9 MB | 235.6 MB |
| Events in quadrant A | 8,287,222 | 1,662,405 |
| Events in quadrant B | 7,106,107 | 1,706,556 |
| Events in quadrant C | 8,378,087 | 1,571,450 |
| Events in quadrant D | 10,453,712 | 1,464,673 |
| Mode M9 | |||
|---|---|---|---|
| Quadrant | BADHDUFLAG | Total packets | Discarded packets |
| A | 0 | 55 | 0 |
| B | 0 | 55 | 0 |
| C | 0 | 55 | 0 |
| D | 0 | 55 | 0 |
| Mode SS | |||
|---|---|---|---|
| Quadrant | BADHDUFLAG | Total packets | Discarded packets |
| A | 0 | 322 | 0 |
| B | 0 | 322 | 0 |
| C | 0 | 322 | 0 |
| D | 0 | 322 | 0 |
| Mode M0 | |||
|---|---|---|---|
| Quadrant | BADHDUFLAG | Total packets | Discarded packets |
| A | 0 | 33934 | 5 |
| B | 0 | 31876 | 4 |
| C | 0 | 34509 | 4 |
| D | 0 | 41977 | 4 |
| Quadrant | Total seconds | Saturated seconds | Saturation percentage |
|---|---|---|---|
| A | 15584 | 46 | 0.295175% |
| B | 15584 | 27 | 0.173255% |
| C | 15584 | 451 | 2.893994% |
| D | 15584 | 508 | 3.259754% |
Noise dominated data is calculated using 1-second bins in cleaned event files. If a bin has >2000 counts, and if more than 50% of those come from <1% of pixels, then it is considered to be noise-dominated and hence unusable.
| Quadrant | # 1 sec bins | Bins with >0 counts | Bins with >2000 counts | High rate bins dominated by noise | Noise dominated (total time) | Noise dominated (detector-on time) | Marked lightcurve |
|---|---|---|---|---|---|---|---|
| A | 21133 | 15588 | 17 | 17 | 0.08% | 0.11% | 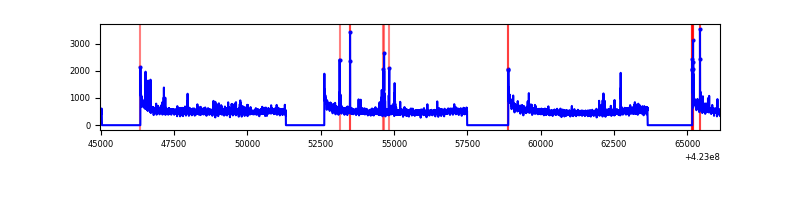 |
| B | 21133 | 15588 | 7 | 7 | 0.03% | 0.04% | 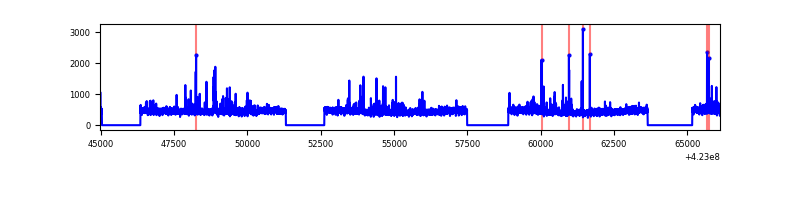 |
| C | 21133 | 15588 | 424 | 424 | 2.01% | 2.72% | 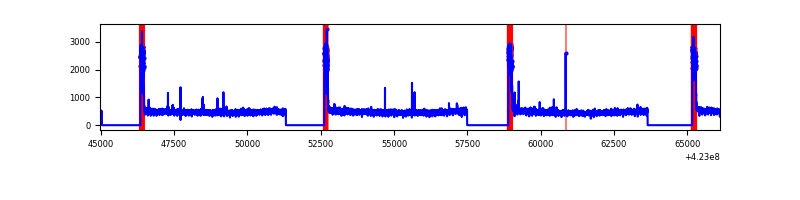 |
| D | 21133 | 15588 | 465 | 465 | 2.20% | 2.98% | 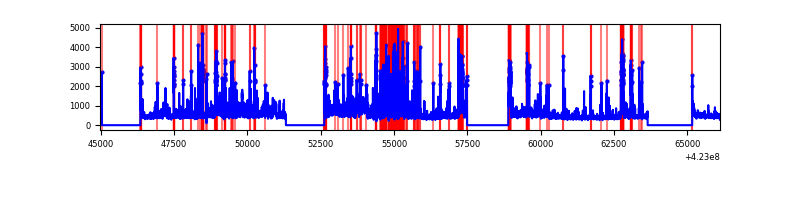 |
Top three noisy pixels from each quadrant. If the there are fewer than three noisy pixels in the level2.evt file, extra rows are filled as -1
| Pixel properties | Quadrant properties | ||||||
|---|---|---|---|---|---|---|---|
| Quadrant | DetID | PixID | Counts | Sigma | Mean | Median | Sigma |
| A | 10 | 83 | 1400092 | 3965.16 | 1715 | 1676 | 352.7 |
| A | 13 | 248 | 164125 | 460.62 | 1715 | 1676 | 352.7 |
| A | 2 | 79 | 80589 | 223.76 | 1715 | 1676 | 352.7 |
| B | 0 | 190 | 258819 | 792.4 | 1702 | 1653 | 324.5 |
| B | 0 | 186 | 64991 | 195.16 | 1702 | 1653 | 324.5 |
| B | 12 | 111 | 42473 | 125.78 | 1702 | 1653 | 324.5 |
| C | 0 | 10 | 1274506 | 3331.77 | 1648 | 1659 | 382.0 |
| C | 15 | 214 | 643391 | 1679.78 | 1648 | 1659 | 382.0 |
| C | 12 | 249 | 31710 | 78.66 | 1648 | 1659 | 382.0 |
| D | 5 | 222 | 1847170 | 4538.39 | 1657 | 1611 | 406.7 |
| D | 1 | 47 | 1021484 | 2507.96 | 1657 | 1611 | 406.7 |
| D | 13 | 249 | 765067 | 1877.41 | 1657 | 1611 | 406.7 |
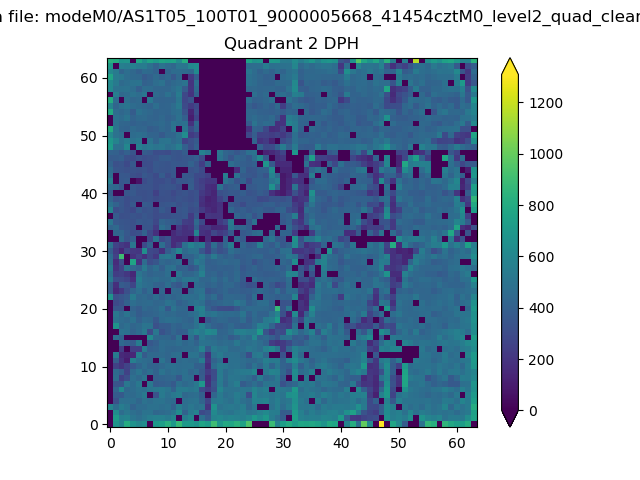
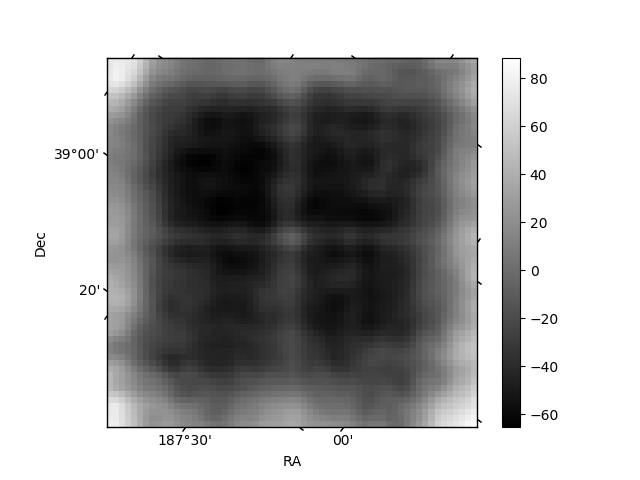
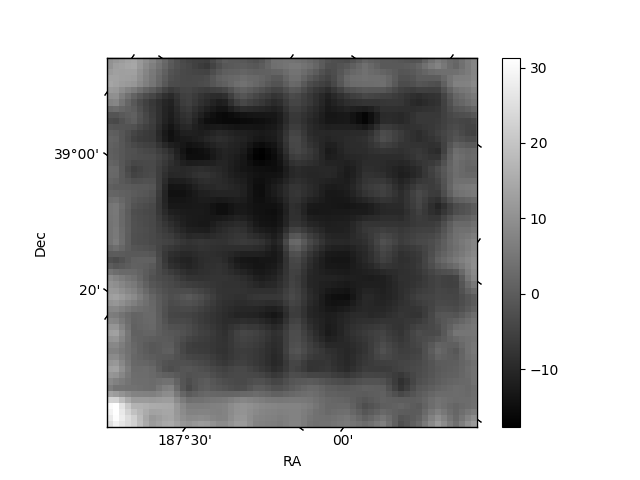
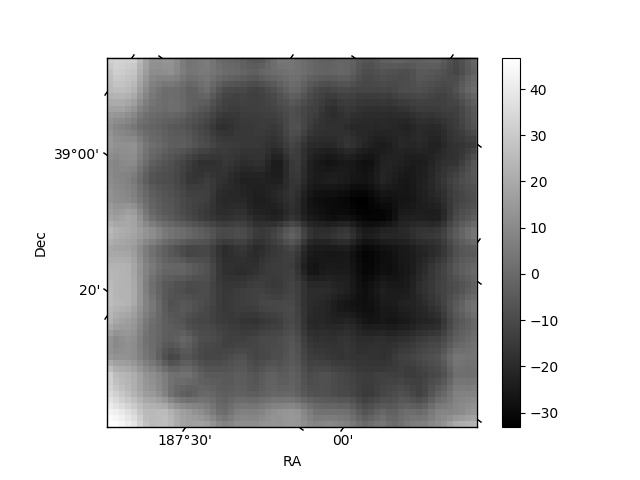
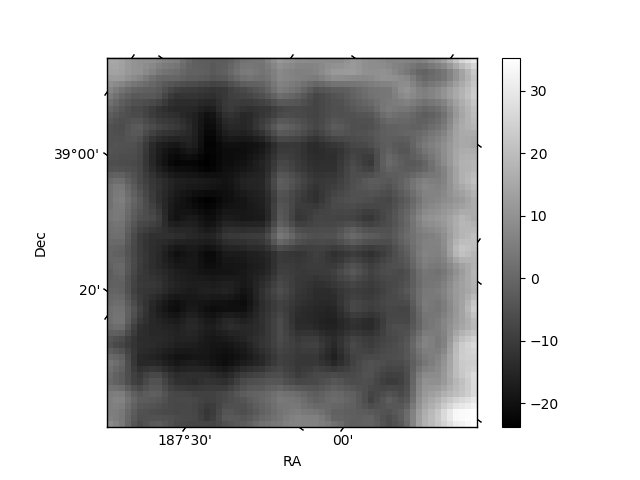
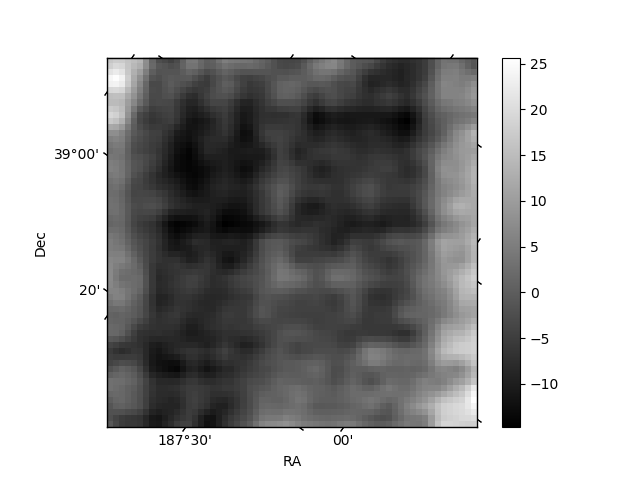
Histogram calculated using DETX and DETY for each event in the final _common_clean file
| Quadrant A | 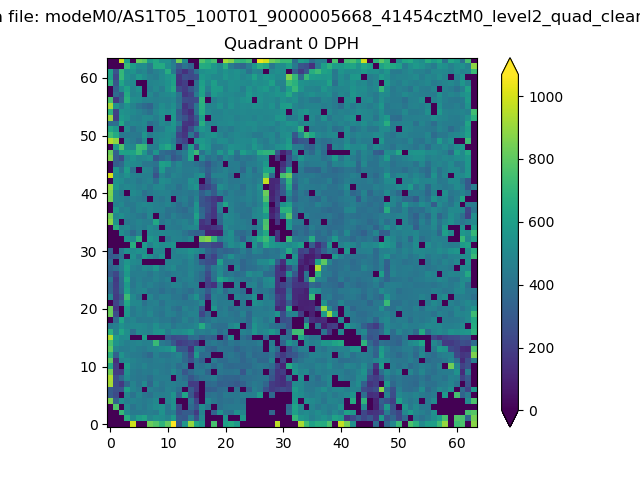 |
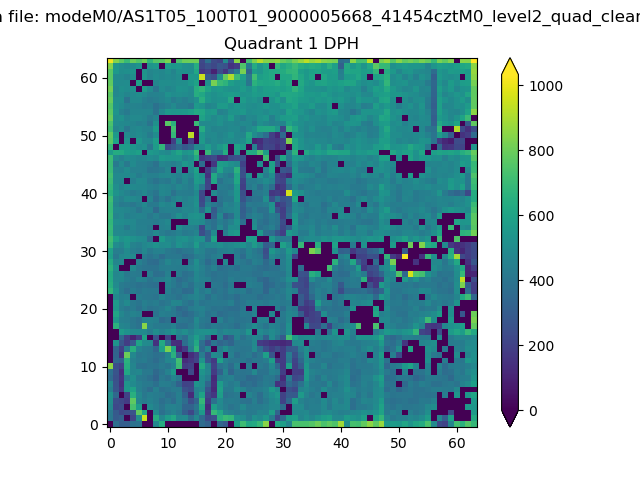 |
Quadrant B |
|---|---|---|---|
| Quadrant D | 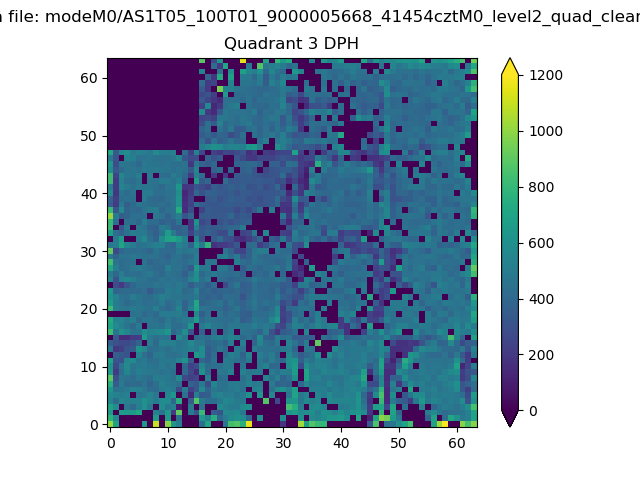 |
 |
Quadrant C |
| Plot type | Count rate plots | Images |
|---|---|---|
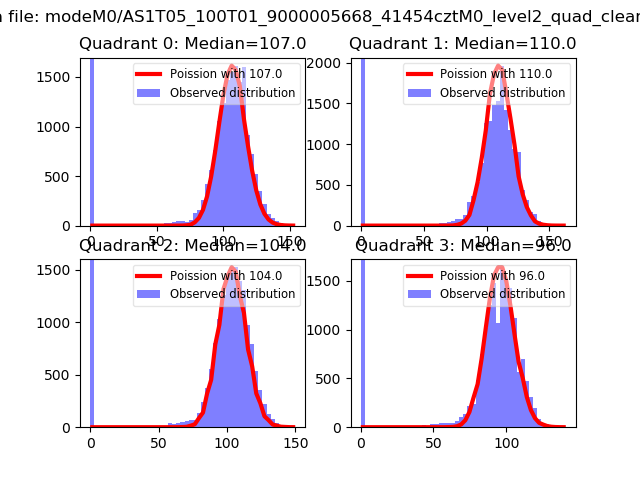
| Comparison with Poisson distribution Blue bars denote a histogram of data divided into 1 sec bins. Red curve is a Poisson curve with rate = median count rate of data. |
 |
 |
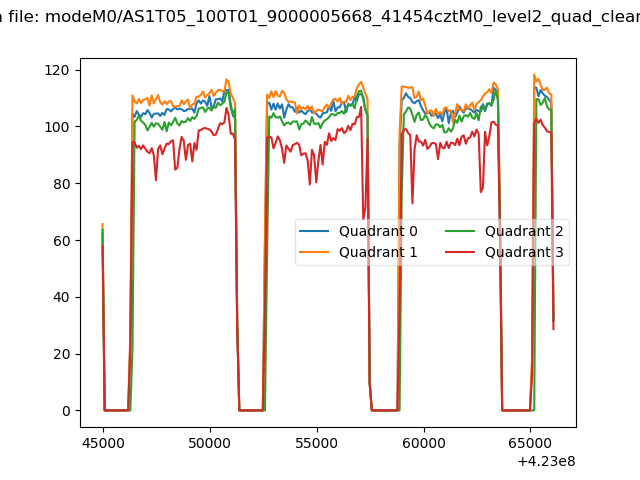
| Quadrant-wise count rates Data is divided into 100 sec bins |
 |
|
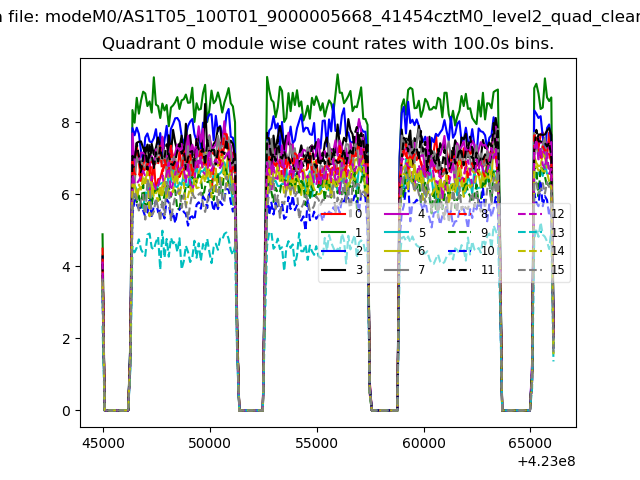
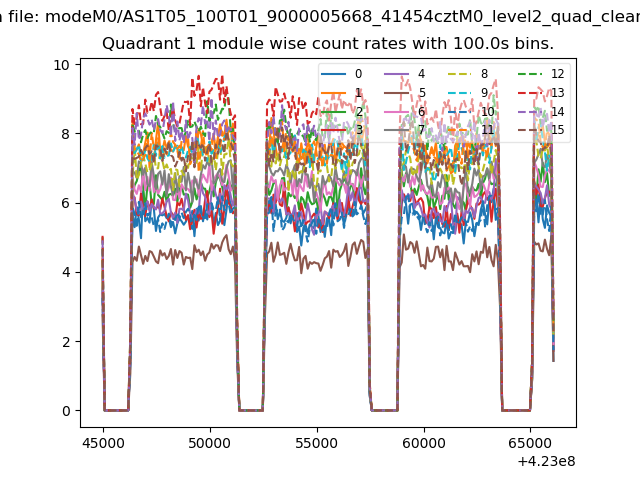
| Module-wise count rates for Quadrant A Data is divided into 100 sec bins |
 |
 |
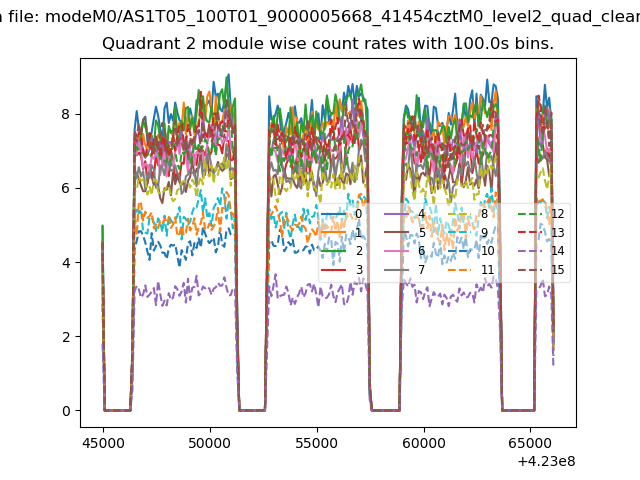
| Module-wise count rates for Quadrant B Data is divided into 100 sec bins |
 |
 |
| Module-wise count rates for Quadrant C Data is divided into 100 sec bins |
 |
 |
| Module-wise count rates for Quadrant D Data is divided into 100 sec bins |
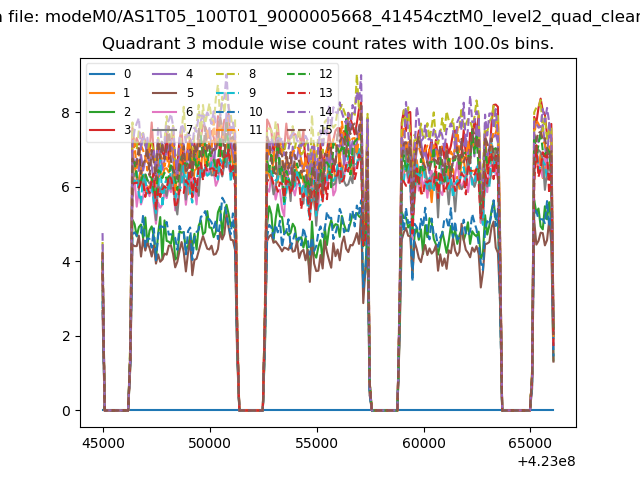 |
 |
| Parameter | Plot |
|---|---|
| CZT HV Monitor | 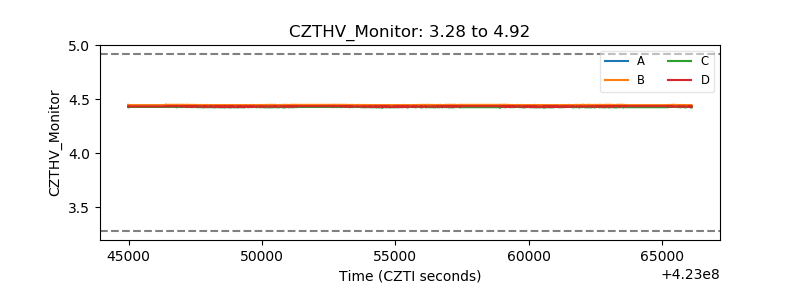 |
| D_VDD | 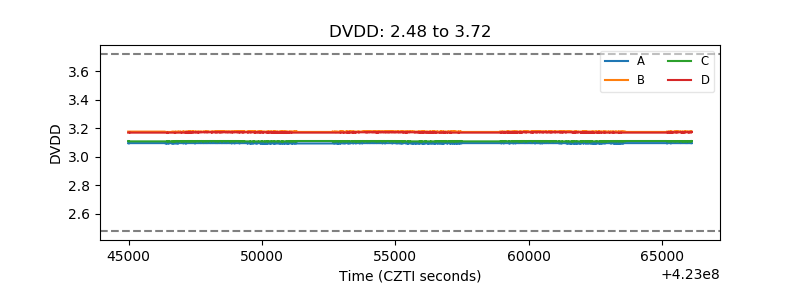 |
| Temperature 1 | 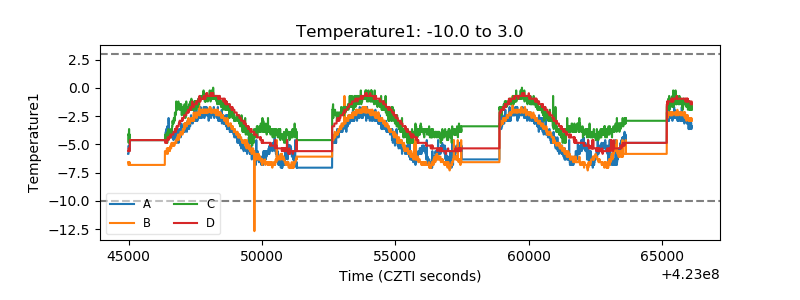 |
| Veto HV Monitor | 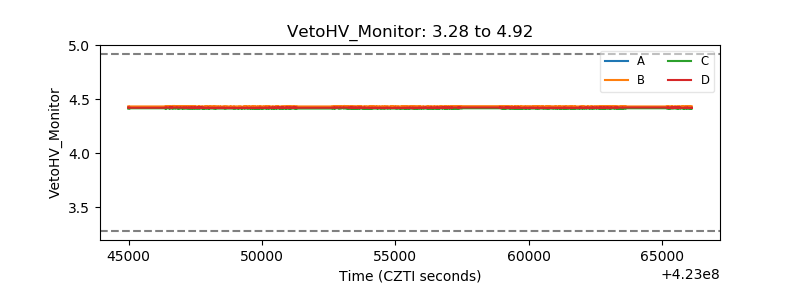 |
| Veto LLD | 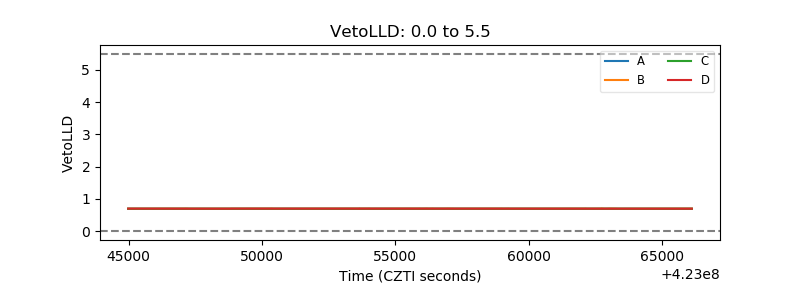 |
| Alpha Counter | 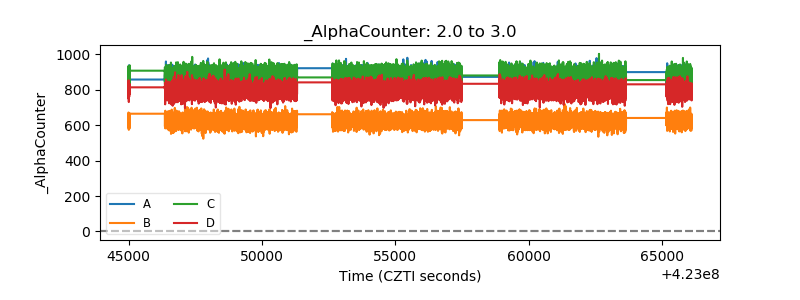 |
| _CPM_Rate | 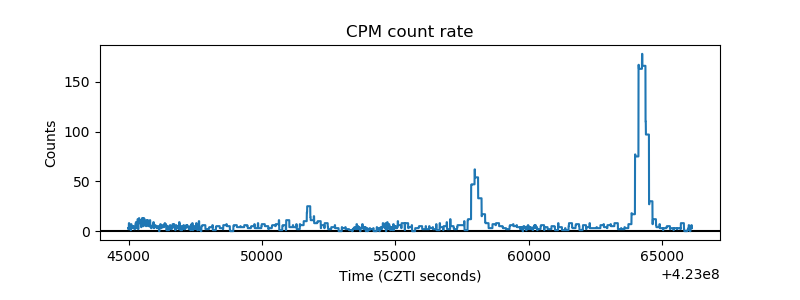 |
| CZT Counter | 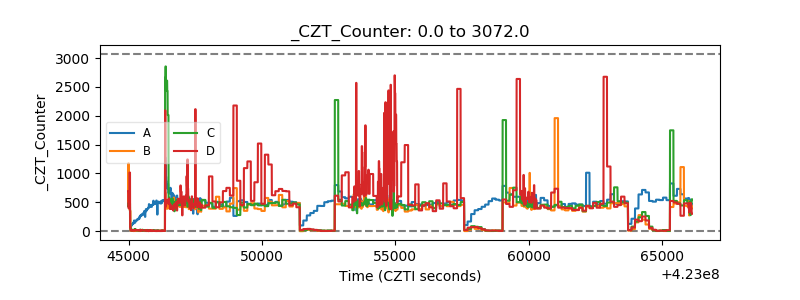 |
| +2.5 Volts monitor |  |
| +5 Volts monitor | 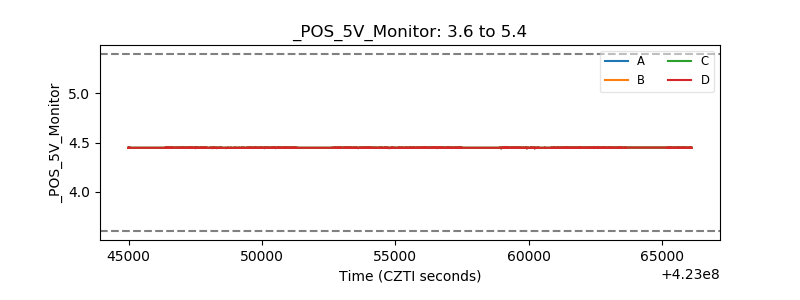 |
| _ROLL_ROT | 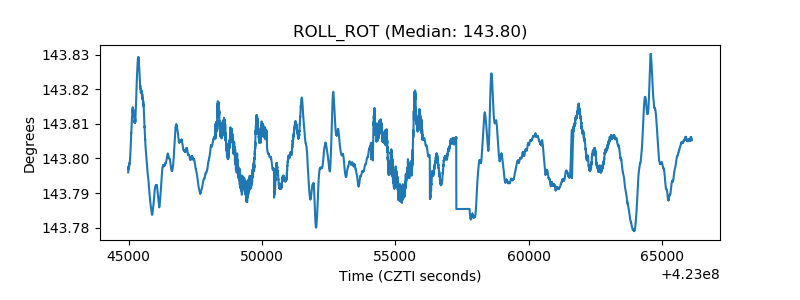 |
| _Roll_DEC | 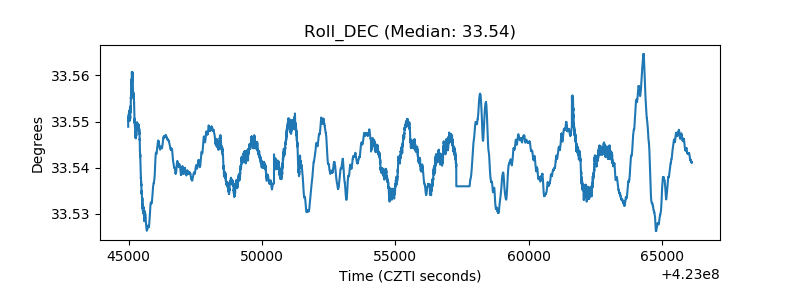 |
| _Roll_RA | 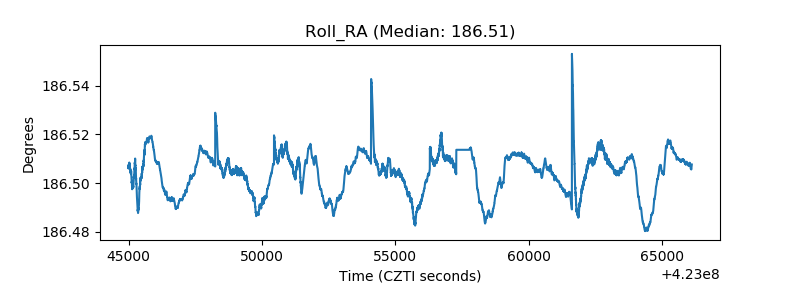 |
| Veto Counter | 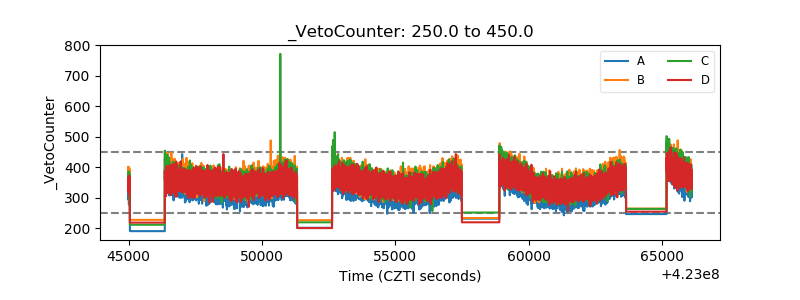 |