| Param | Original file | Final file |
|---|---|---|
| Filename | modeM0/AS1T05_100T01_9000005668_41455cztM0_level2.fits | modeM0/AS1T05_100T01_9000005668_41455cztM0_level2_quad_clean.evt |
| Size (bytes) | 320,448,960 | 88,378,560 |
| Size | 305.6 MB | 84.3 MB |
| Events in quadrant A | 2,895,372 | 591,498 |
| Events in quadrant B | 2,446,366 | 607,450 |
| Events in quadrant C | 3,457,827 | 556,519 |
| Events in quadrant D | 2,638,301 | 539,435 |
| Mode M9 | |||
|---|---|---|---|
| Quadrant | BADHDUFLAG | Total packets | Discarded packets |
| A | 0 | 20 | 0 |
| B | 0 | 20 | 0 |
| C | 0 | 20 | 0 |
| D | 0 | 21 | 0 |
| Mode SS | |||
|---|---|---|---|
| Quadrant | BADHDUFLAG | Total packets | Discarded packets |
| A | 0 | 112 | 0 |
| B | 0 | 112 | 0 |
| C | 0 | 112 | 0 |
| D | 0 | 112 | 0 |
| Mode M0 | |||
|---|---|---|---|
| Quadrant | BADHDUFLAG | Total packets | Discarded packets |
| A | 0 | 12067 | 3 |
| B | 0 | 11096 | 2 |
| C | 0 | 13717 | 2 |
| D | 0 | 11809 | 2 |
| Quadrant | Total seconds | Saturated seconds | Saturation percentage |
|---|---|---|---|
| A | 5440 | 25 | 0.459559% |
| B | 5440 | 8 | 0.147059% |
| C | 5440 | 244 | 4.485294% |
| D | 5440 | 28 | 0.514706% |
Noise dominated data is calculated using 1-second bins in cleaned event files. If a bin has >2000 counts, and if more than 50% of those come from <1% of pixels, then it is considered to be noise-dominated and hence unusable.
| Quadrant | # 1 sec bins | Bins with >0 counts | Bins with >2000 counts | High rate bins dominated by noise | Noise dominated (total time) | Noise dominated (detector-on time) | Marked lightcurve |
|---|---|---|---|---|---|---|---|
| A | 7054 | 5441 | 10 | 10 | 0.14% | 0.18% | 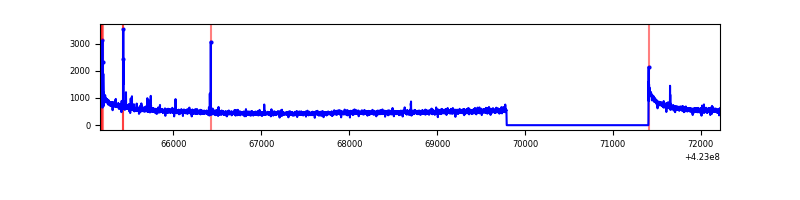 |
| B | 7054 | 5441 | 2 | 2 | 0.03% | 0.04% | 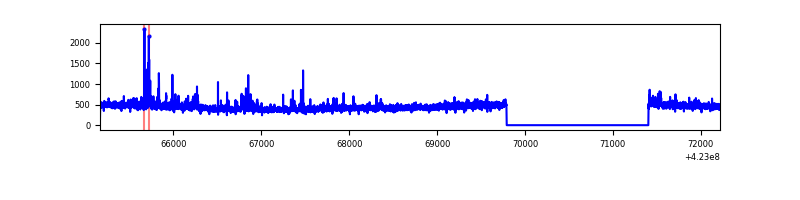 |
| C | 7054 | 5441 | 222 | 222 | 3.15% | 4.08% | 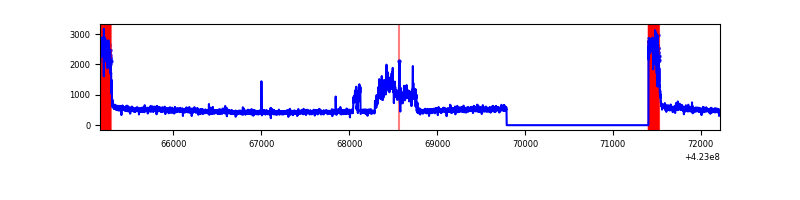 |
| D | 7054 | 5441 | 31 | 31 | 0.44% | 0.57% | 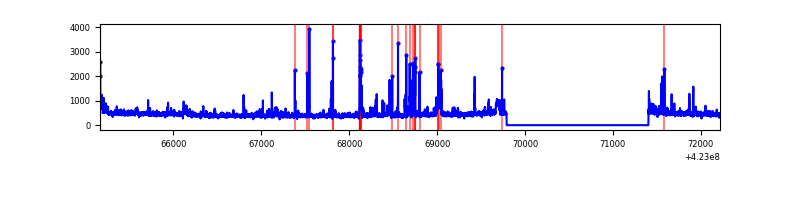 |
Top three noisy pixels from each quadrant. If the there are fewer than three noisy pixels in the level2.evt file, extra rows are filled as -1
| Pixel properties | Quadrant properties | ||||||
|---|---|---|---|---|---|---|---|
| Quadrant | DetID | PixID | Counts | Sigma | Mean | Median | Sigma |
| A | 10 | 83 | 539897 | 4342.71 | 597 | 583 | 124.2 |
| A | 13 | 248 | 38662 | 306.62 | 597 | 583 | 124.2 |
| A | 13 | 254 | 9128 | 68.81 | 597 | 583 | 124.2 |
| B | 0 | 190 | 95080 | 823.15 | 593 | 577 | 114.8 |
| B | 12 | 111 | 14487 | 121.16 | 593 | 577 | 114.8 |
| B | 11 | 111 | 13752 | 114.76 | 593 | 577 | 114.8 |
| C | 0 | 10 | 621954 | 4669.21 | 567 | 569 | 133.1 |
| C | 9 | 54 | 396674 | 2976.41 | 567 | 569 | 133.1 |
| C | 15 | 214 | 223757 | 1677.08 | 567 | 569 | 133.1 |
| D | 1 | 47 | 182882 | 1254.7 | 585 | 569 | 145.3 |
| D | 13 | 249 | 119288 | 817.04 | 585 | 569 | 145.3 |
| D | 2 | 249 | 28452 | 191.89 | 585 | 569 | 145.3 |
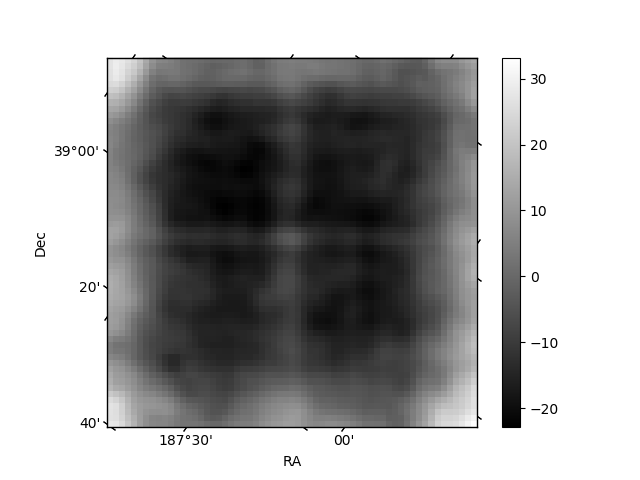
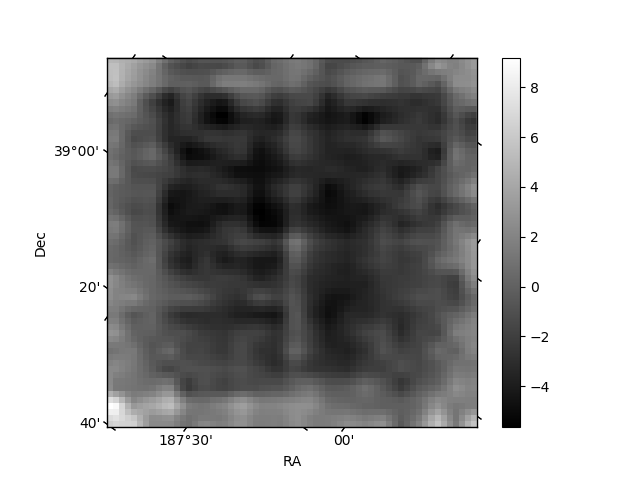
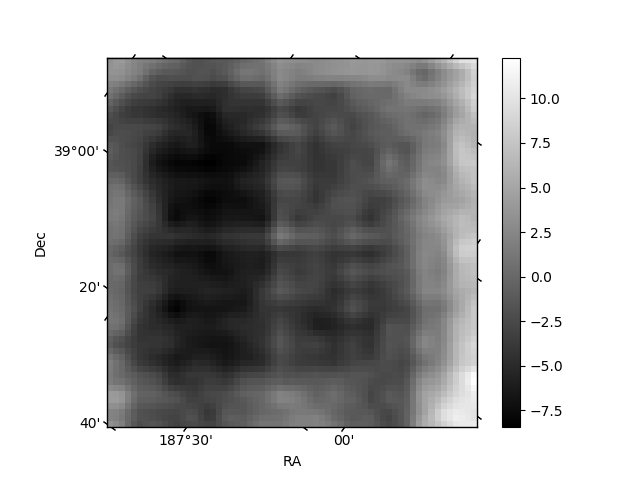
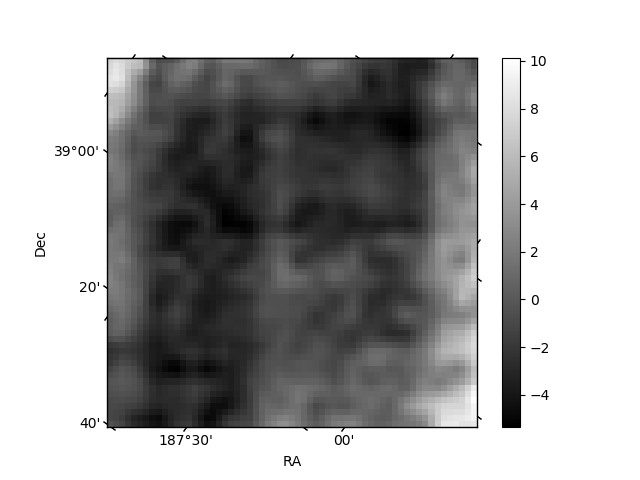
Histogram calculated using DETX and DETY for each event in the final _common_clean file
| Quadrant A | 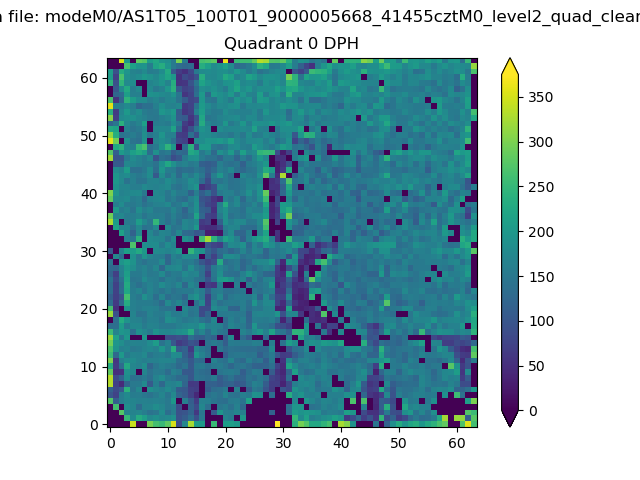 |
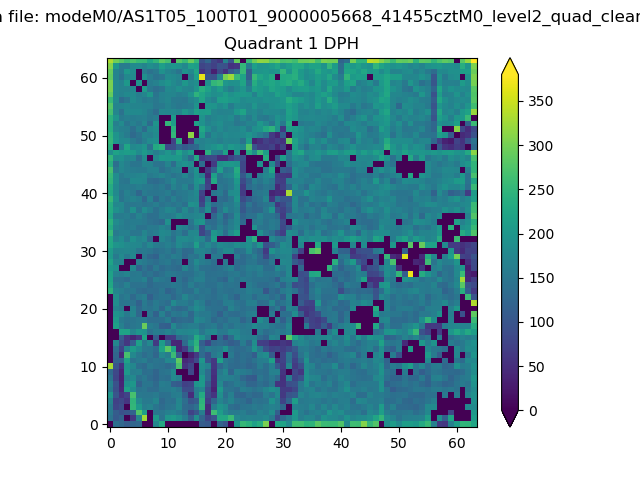 |
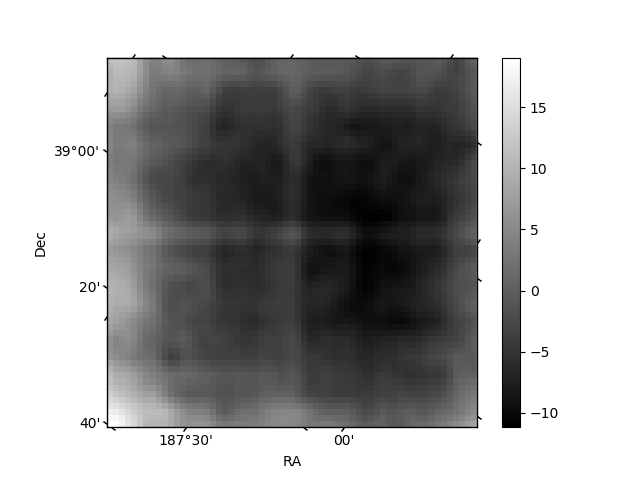
Quadrant B |
|---|---|---|---|
| Quadrant D | 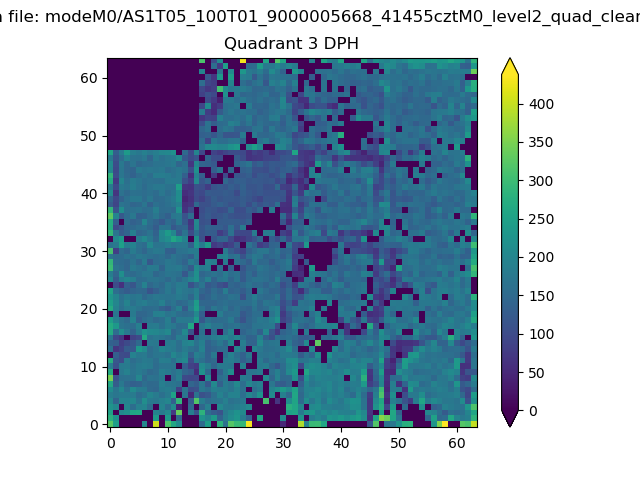 |
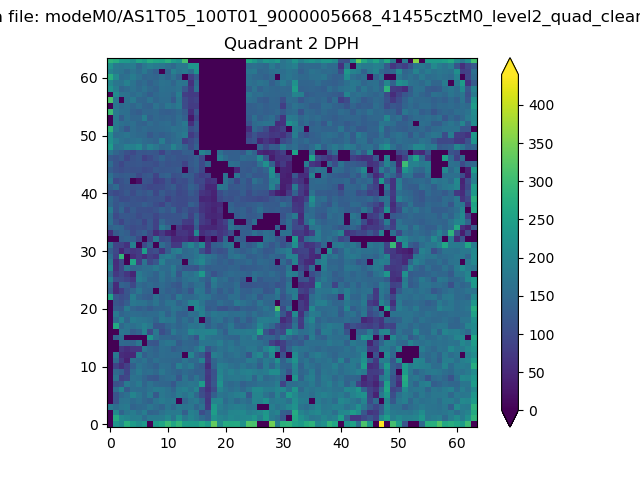 |
Quadrant C |
| Plot type | Count rate plots | Images |
|---|---|---|
| Comparison with Poisson distribution Blue bars denote a histogram of data divided into 1 sec bins. Red curve is a Poisson curve with rate = median count rate of data. |
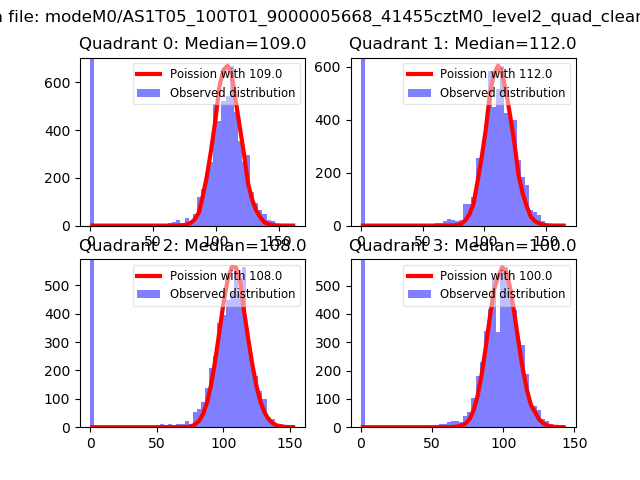 |
 |
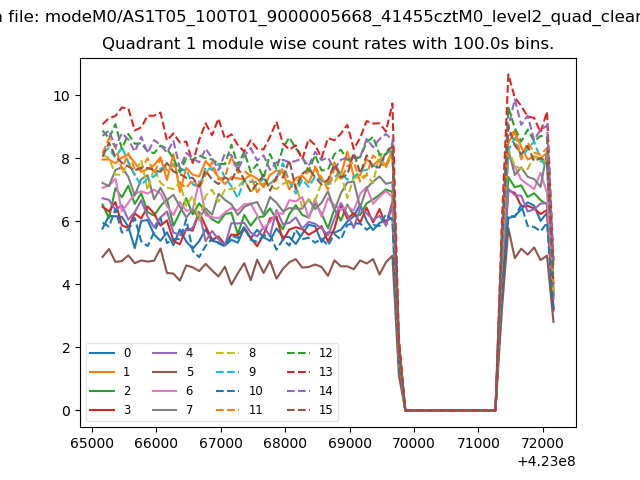
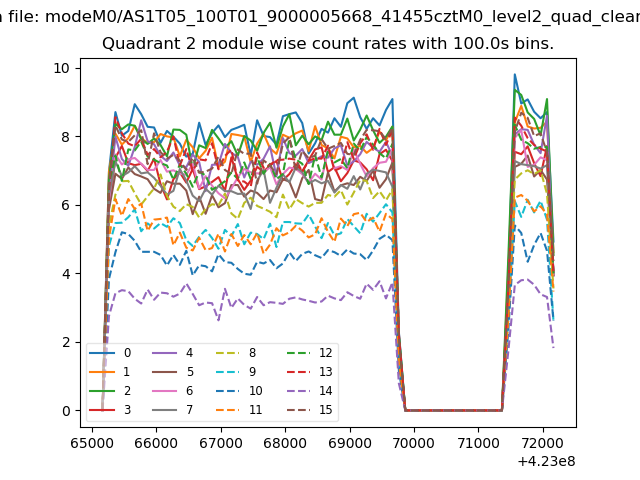
| Quadrant-wise count rates Data is divided into 100 sec bins |
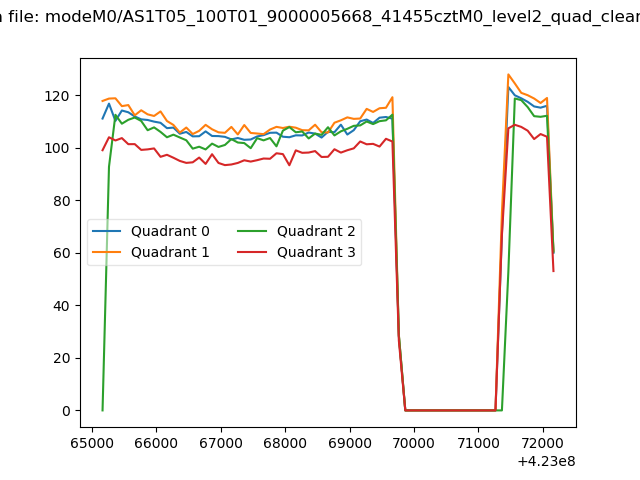 |
|
| Module-wise count rates for Quadrant A Data is divided into 100 sec bins |
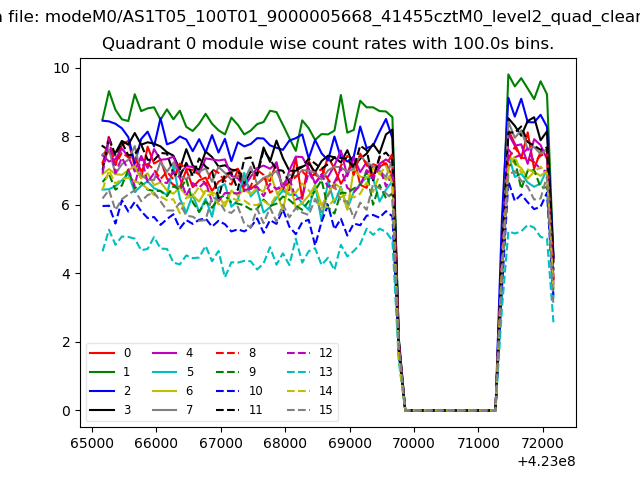 |
 |
| Module-wise count rates for Quadrant B Data is divided into 100 sec bins |
 |
 |
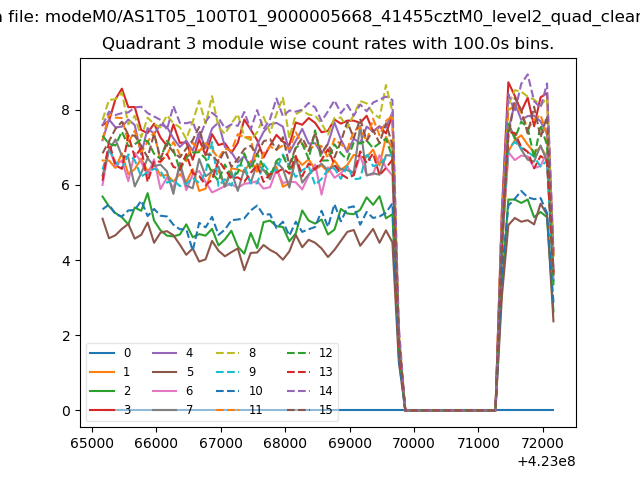
| Module-wise count rates for Quadrant C Data is divided into 100 sec bins |
 |
 |
| Module-wise count rates for Quadrant D Data is divided into 100 sec bins |
 |
 |
| Parameter | Plot |
|---|---|
| CZT HV Monitor | 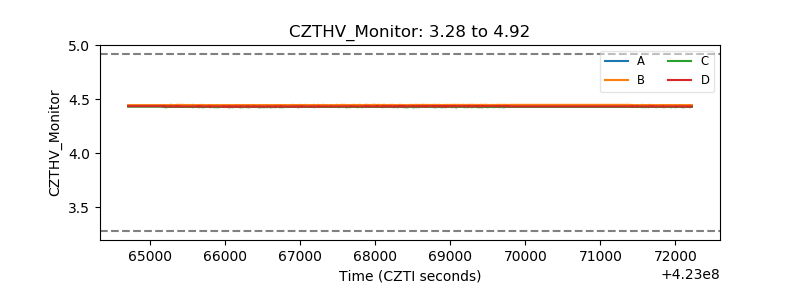 |
| D_VDD | 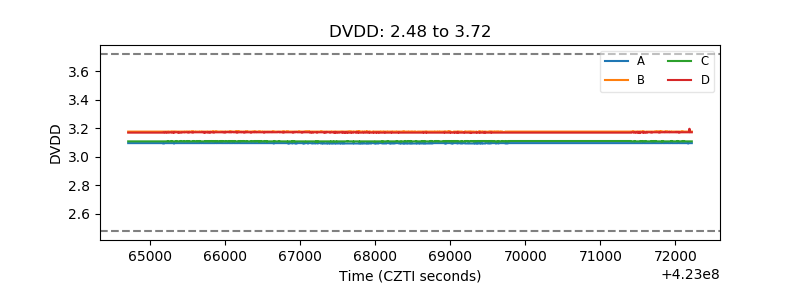 |
| Temperature 1 | 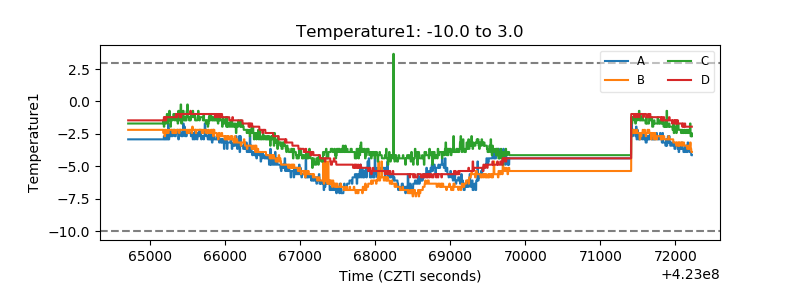 |
| Veto HV Monitor | 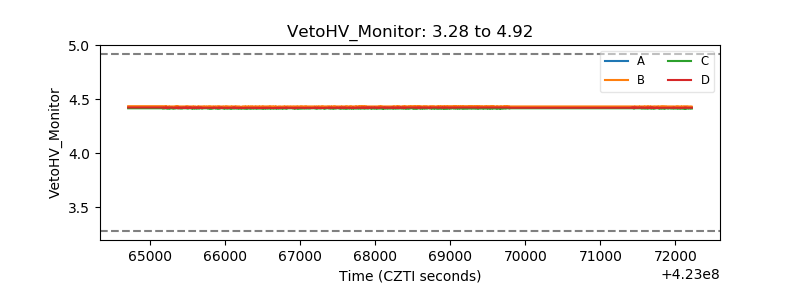 |
| Veto LLD | 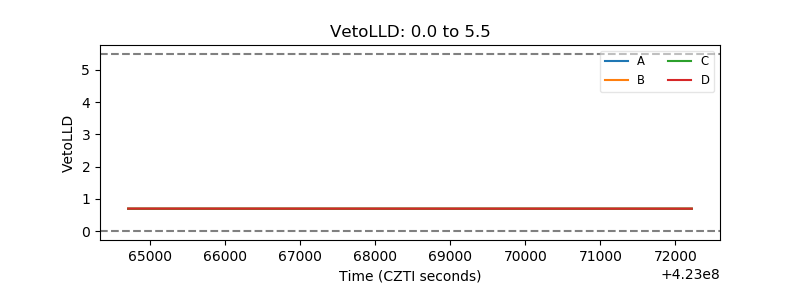 |
| Alpha Counter | 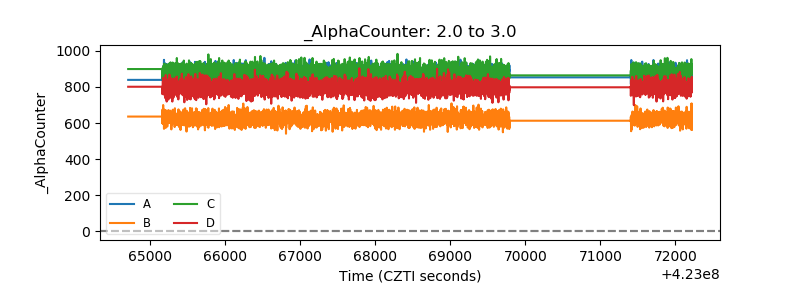 |
| _CPM_Rate | 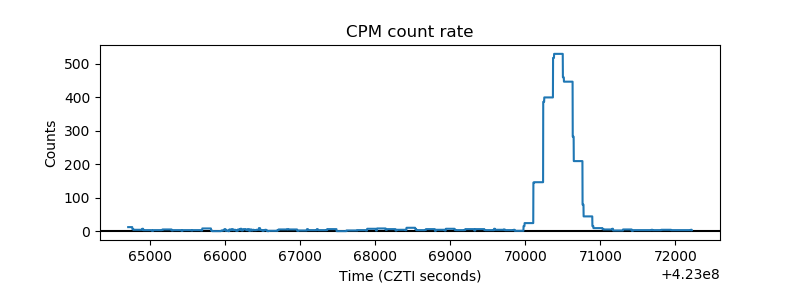 |
| CZT Counter | 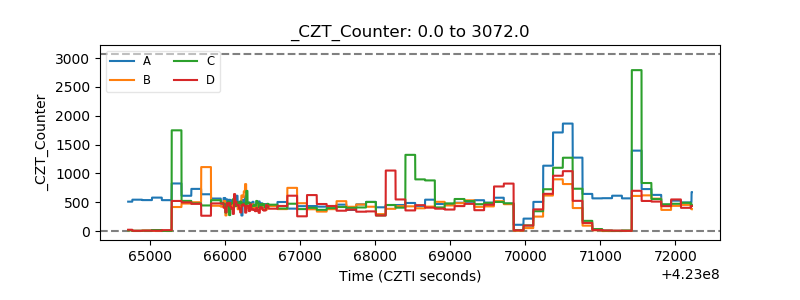 |
| +2.5 Volts monitor |  |
| +5 Volts monitor | 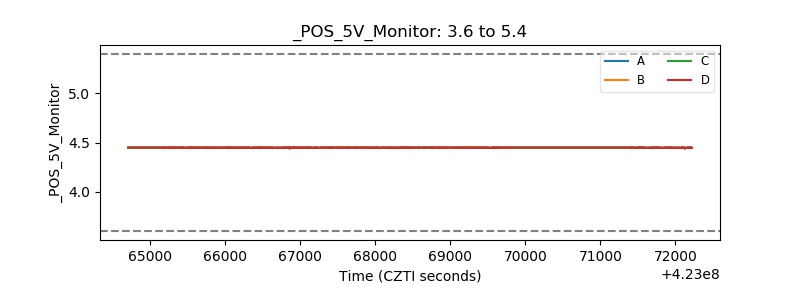 |
| _ROLL_ROT | 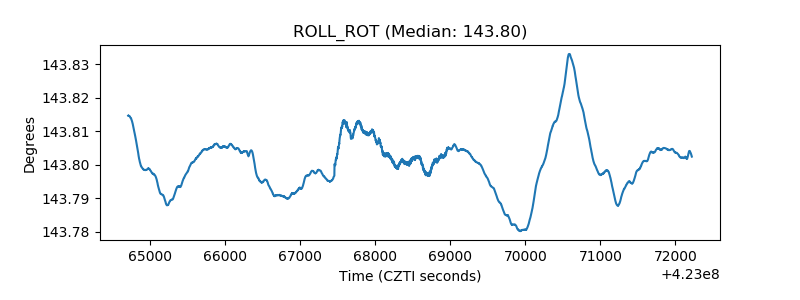 |
| _Roll_DEC | 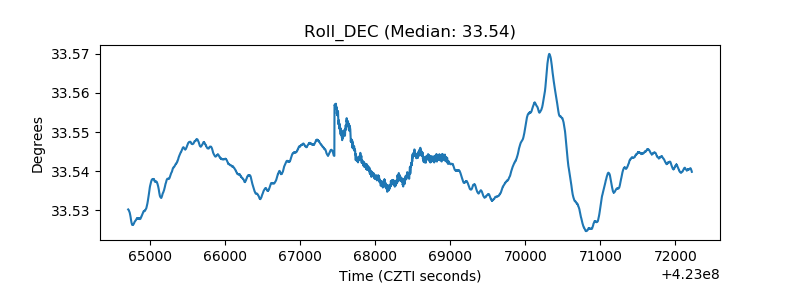 |
| _Roll_RA | 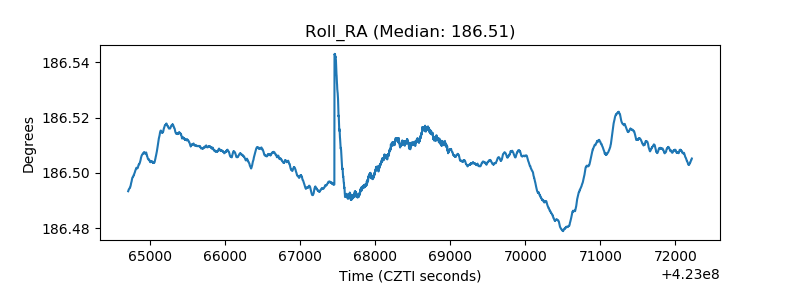 |
| Veto Counter | 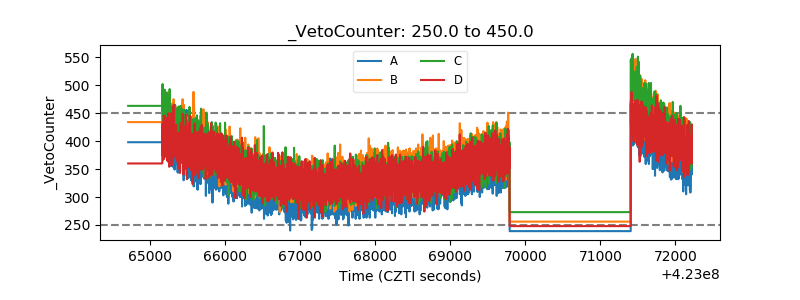 |