| Param | Original file | Final file |
|---|---|---|
| Filename | modeM0/AS1T05_100T01_9000005668_41457cztM0_level2.fits | modeM0/AS1T05_100T01_9000005668_41457cztM0_level2_quad_clean.evt |
| Size (bytes) | 310,875,840 | 89,608,320 |
| Size | 296.5 MB | 85.5 MB |
| Events in quadrant A | 2,842,801 | 604,477 |
| Events in quadrant B | 2,436,209 | 619,543 |
| Events in quadrant C | 3,050,749 | 565,919 |
| Events in quadrant D | 2,758,024 | 545,950 |
| Mode M9 | |||
|---|---|---|---|
| Quadrant | BADHDUFLAG | Total packets | Discarded packets |
| A | 0 | 20 | 0 |
| B | 0 | 20 | 0 |
| C | 0 | 20 | 0 |
| D | 0 | 21 | 0 |
| Mode SS | |||
|---|---|---|---|
| Quadrant | BADHDUFLAG | Total packets | Discarded packets |
| A | 0 | 112 | 0 |
| B | 0 | 112 | 0 |
| C | 0 | 112 | 0 |
| D | 0 | 112 | 0 |
| Mode M0 | |||
|---|---|---|---|
| Quadrant | BADHDUFLAG | Total packets | Discarded packets |
| A | 0 | 11860 | 3 |
| B | 0 | 11029 | 2 |
| C | 0 | 12588 | 2 |
| D | 0 | 12125 | 2 |
| Quadrant | Total seconds | Saturated seconds | Saturation percentage |
|---|---|---|---|
| A | 5383 | 13 | 0.241501% |
| B | 5383 | 10 | 0.185770% |
| C | 5383 | 231 | 4.291287% |
| D | 5383 | 57 | 1.058889% |
Noise dominated data is calculated using 1-second bins in cleaned event files. If a bin has >2000 counts, and if more than 50% of those come from <1% of pixels, then it is considered to be noise-dominated and hence unusable.
| Quadrant | # 1 sec bins | Bins with >0 counts | Bins with >2000 counts | High rate bins dominated by noise | Noise dominated (total time) | Noise dominated (detector-on time) | Marked lightcurve |
|---|---|---|---|---|---|---|---|
| A | 7145 | 5384 | 2 | 2 | 0.03% | 0.04% | 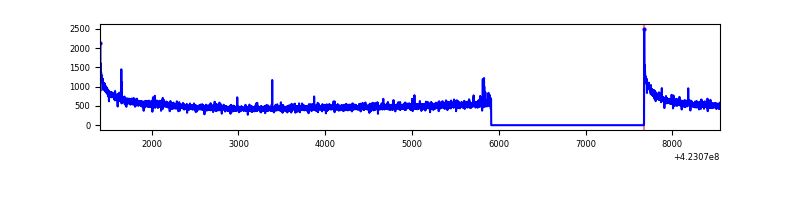 |
| B | 7145 | 5384 | 1 | 1 | 0.01% | 0.02% | 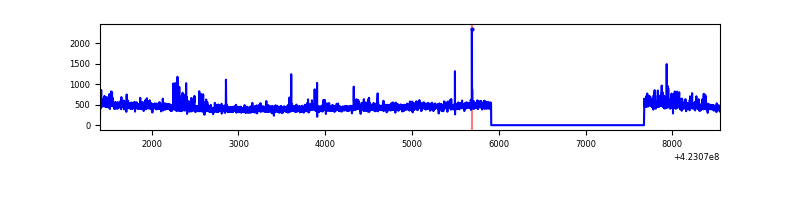 |
| C | 7145 | 5384 | 221 | 221 | 3.09% | 4.10% | 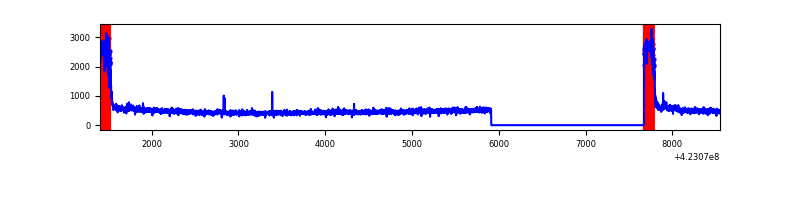 |
| D | 7145 | 5384 | 43 | 43 | 0.60% | 0.80% | 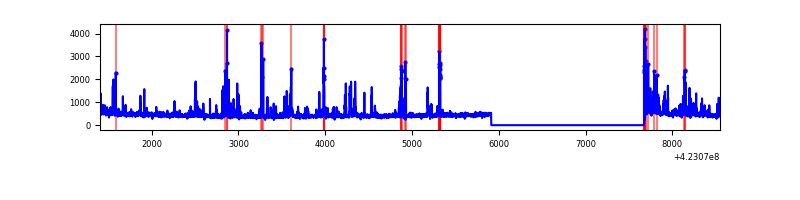 |
Top three noisy pixels from each quadrant. If the there are fewer than three noisy pixels in the level2.evt file, extra rows are filled as -1
| Pixel properties | Quadrant properties | ||||||
|---|---|---|---|---|---|---|---|
| Quadrant | DetID | PixID | Counts | Sigma | Mean | Median | Sigma |
| A | 10 | 83 | 535415 | 4367.15 | 591 | 578 | 122.5 |
| A | 2 | 79 | 14683 | 115.17 | 591 | 578 | 122.5 |
| A | 13 | 254 | 8375 | 63.66 | 591 | 578 | 122.5 |
| B | 0 | 190 | 102851 | 889.06 | 590 | 573 | 115.0 |
| B | 12 | 111 | 14276 | 119.11 | 590 | 573 | 115.0 |
| B | 11 | 111 | 13317 | 110.78 | 590 | 573 | 115.0 |
| C | 0 | 10 | 599315 | 4545.14 | 564 | 567 | 131.7 |
| C | 15 | 214 | 220962 | 1673.03 | 564 | 567 | 131.7 |
| C | 9 | 54 | 24346 | 180.51 | 564 | 567 | 131.7 |
| D | 12 | 233 | 207214 | 1452.86 | 578 | 561 | 142.2 |
| D | 13 | 249 | 132419 | 927.02 | 578 | 561 | 142.2 |
| D | 1 | 47 | 107445 | 751.44 | 578 | 561 | 142.2 |
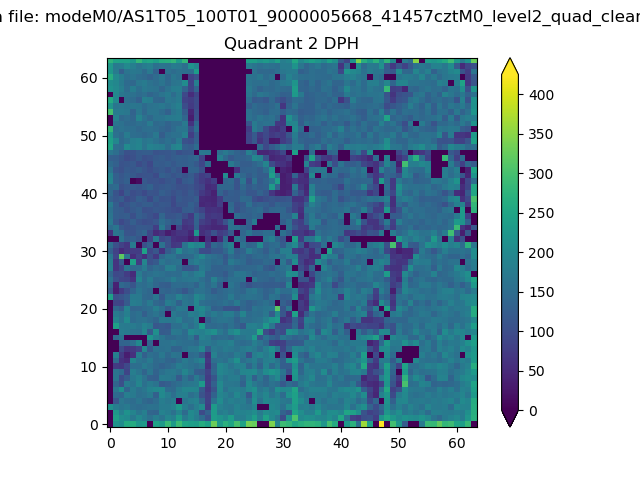
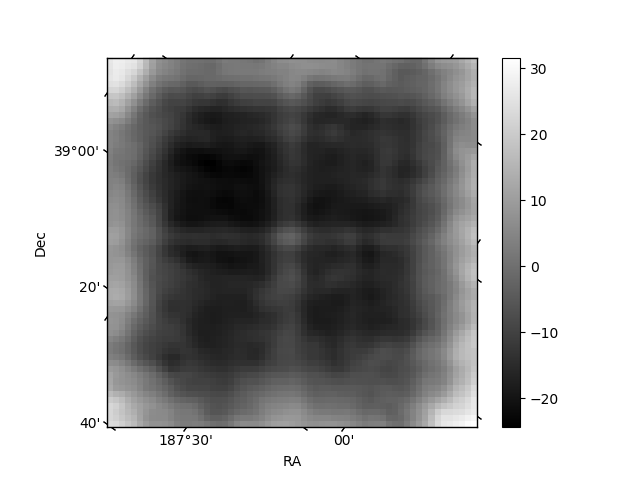
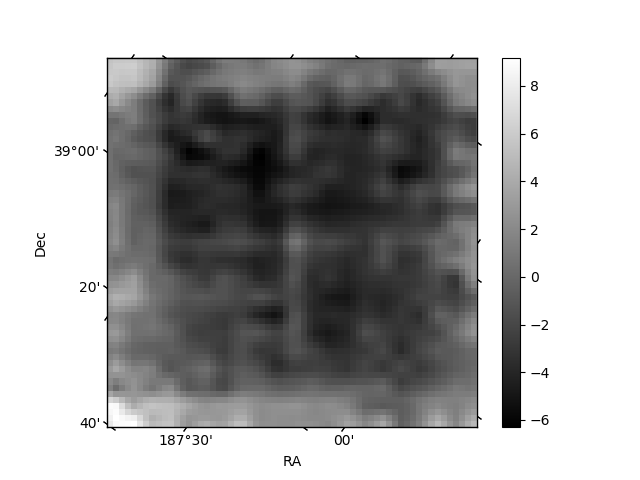
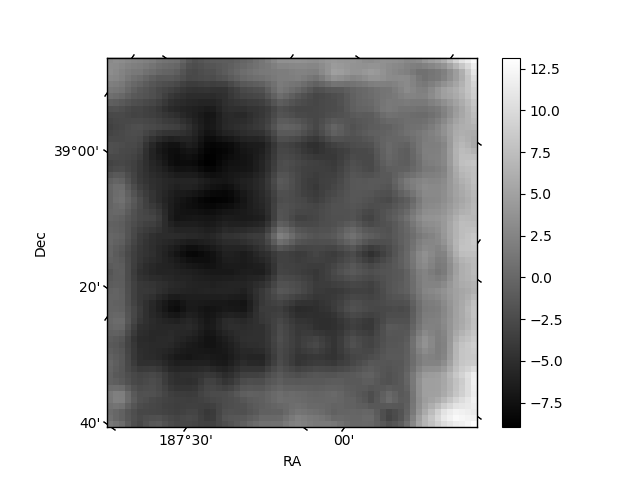
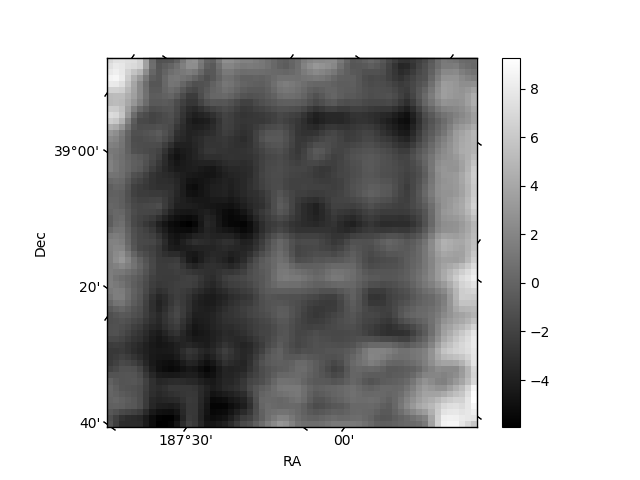
Histogram calculated using DETX and DETY for each event in the final _common_clean file
| Quadrant A | 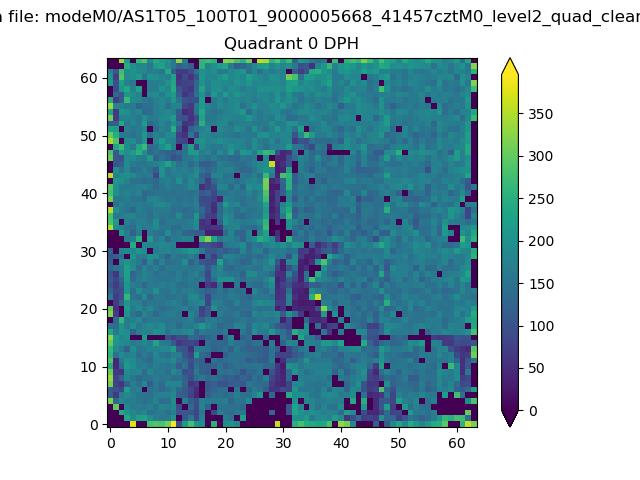 |
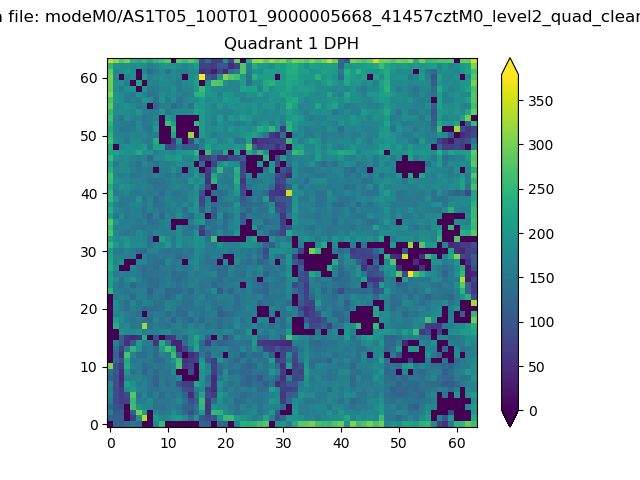 |
Quadrant B |
|---|---|---|---|
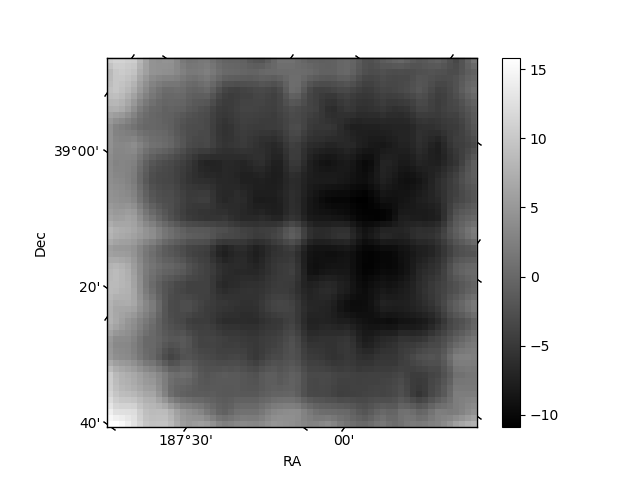
| Quadrant D | 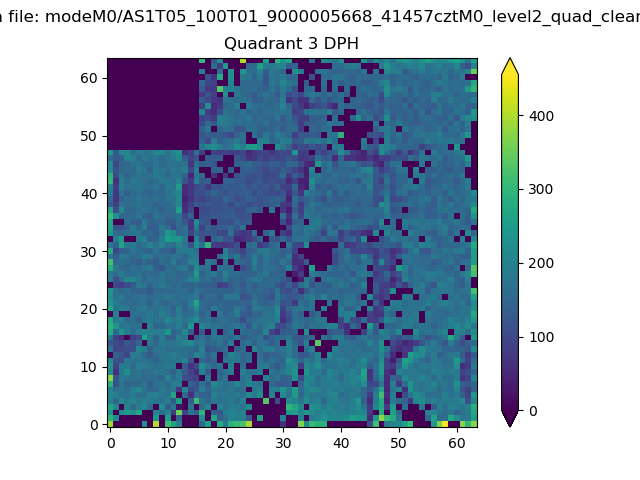 |
 |
Quadrant C |
| Plot type | Count rate plots | Images |
|---|---|---|
| Comparison with Poisson distribution Blue bars denote a histogram of data divided into 1 sec bins. Red curve is a Poisson curve with rate = median count rate of data. |
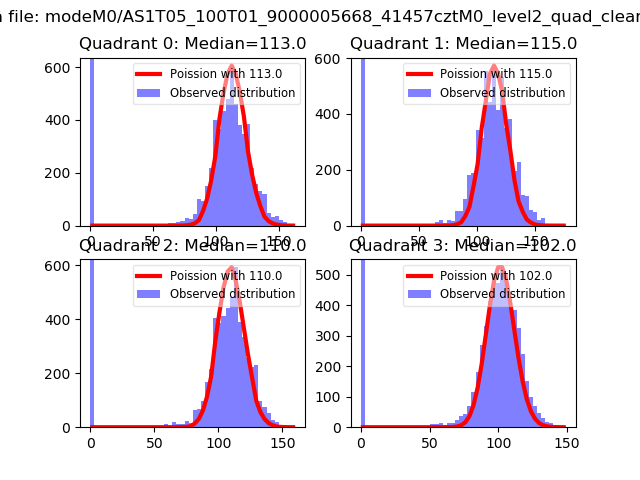 |
 |
| Quadrant-wise count rates Data is divided into 100 sec bins |
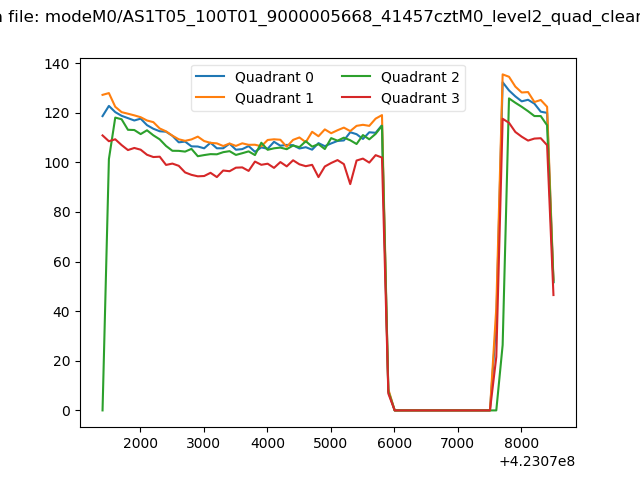 |
|
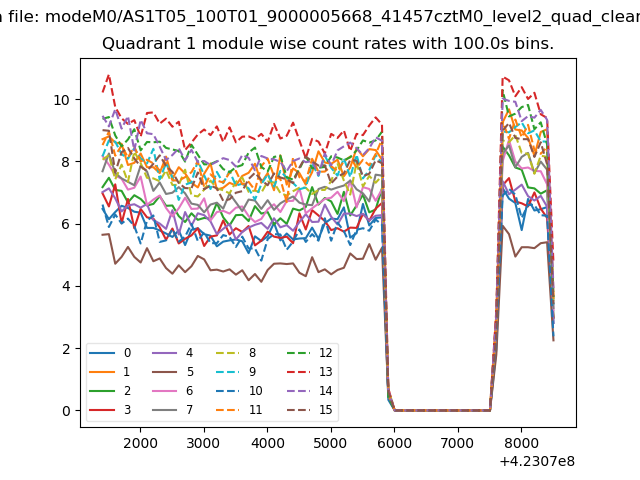
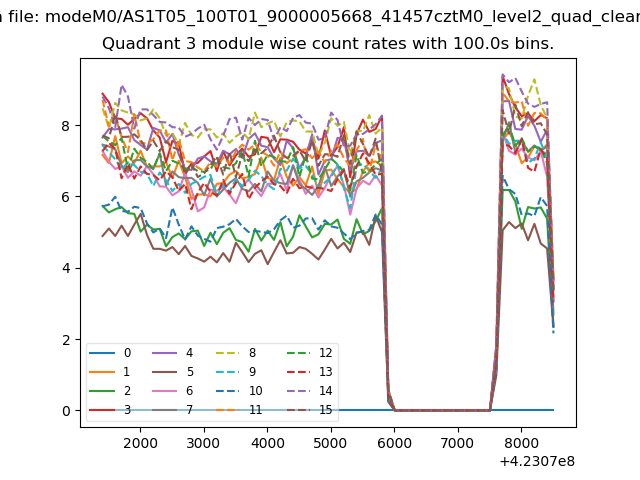
| Module-wise count rates for Quadrant A Data is divided into 100 sec bins |
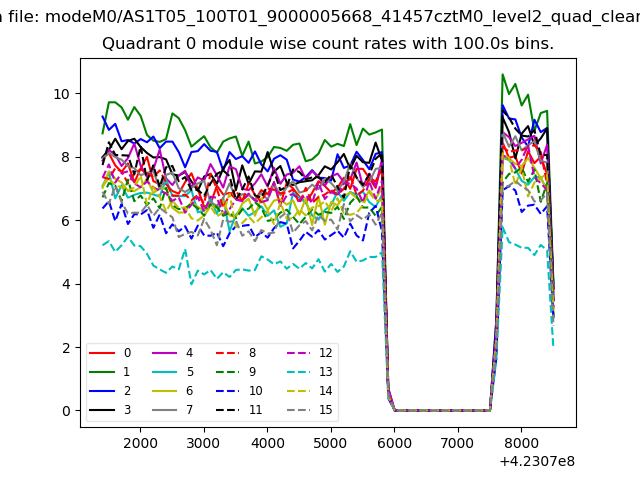 |
 |
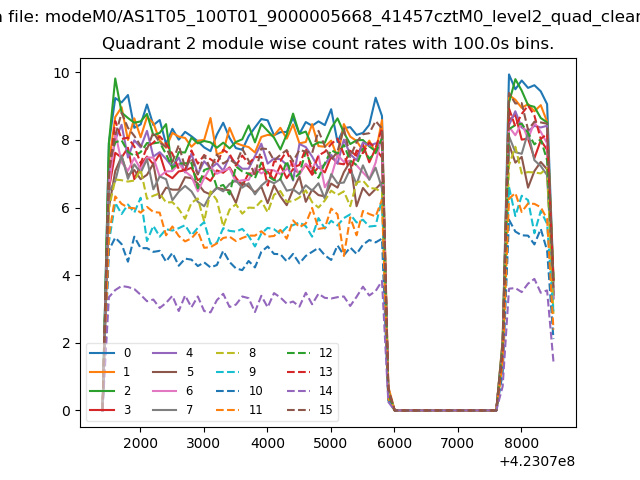
| Module-wise count rates for Quadrant B Data is divided into 100 sec bins |
 |
 |
| Module-wise count rates for Quadrant C Data is divided into 100 sec bins |
 |
 |
| Module-wise count rates for Quadrant D Data is divided into 100 sec bins |
 |
 |
| Parameter | Plot |
|---|---|
| CZT HV Monitor | 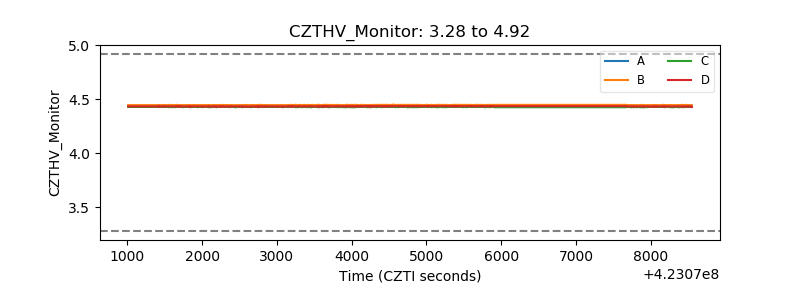 |
| D_VDD | 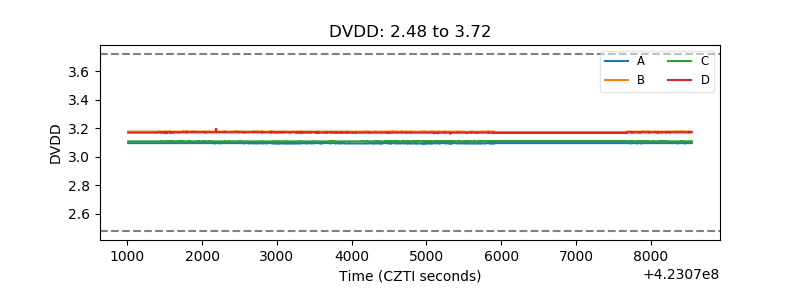 |
| Temperature 1 | 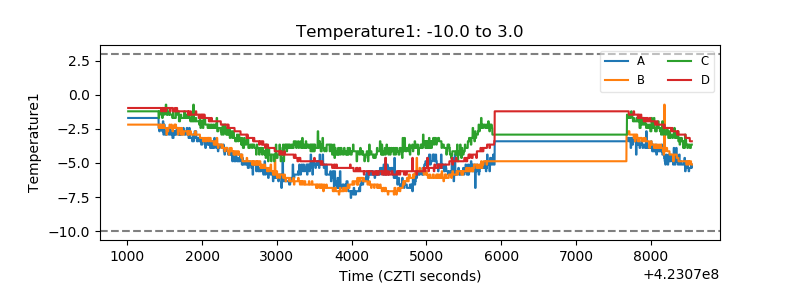 |
| Veto HV Monitor | 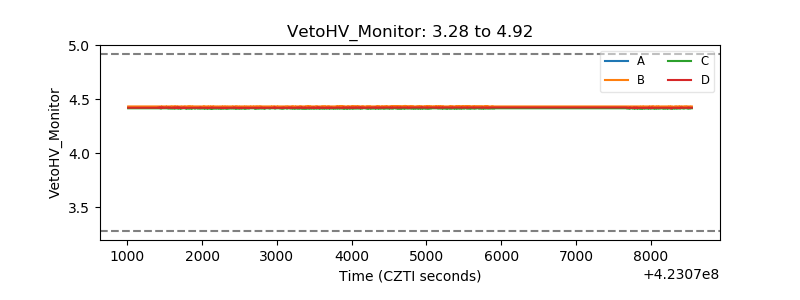 |
| Veto LLD | 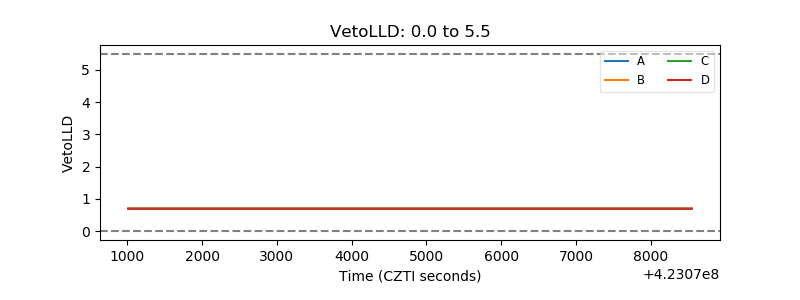 |
| Alpha Counter | 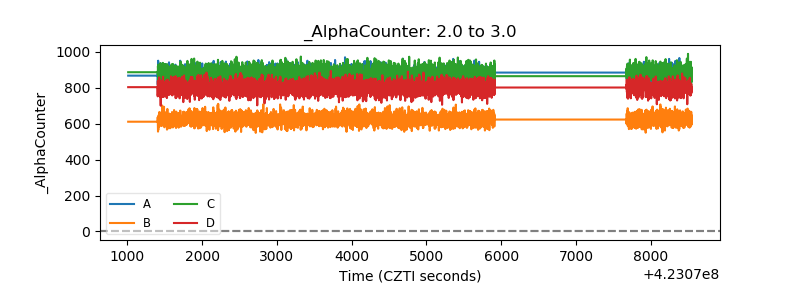 |
| _CPM_Rate | 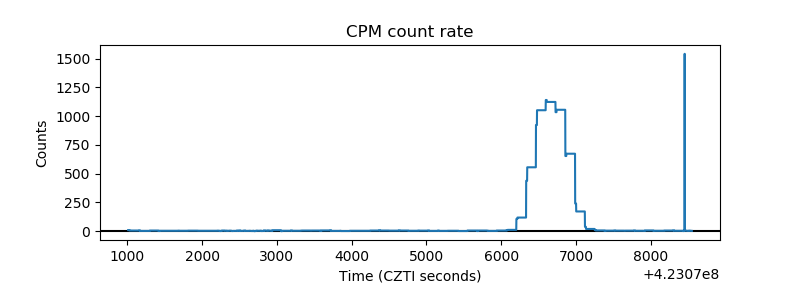 |
| CZT Counter | 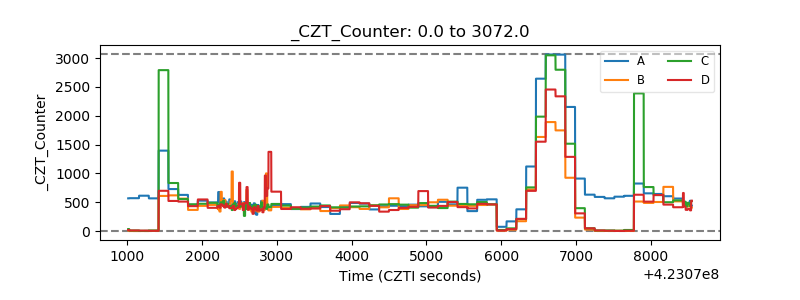 |
| +2.5 Volts monitor | 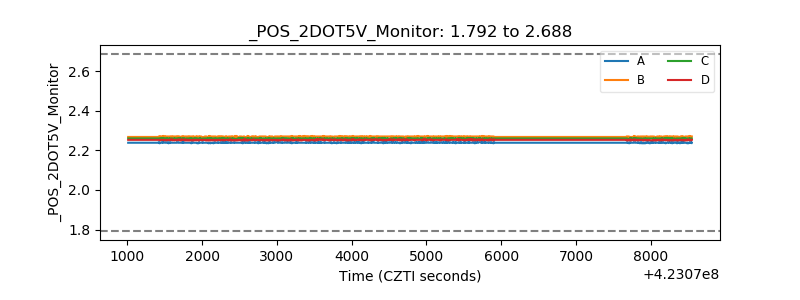 |
| +5 Volts monitor | 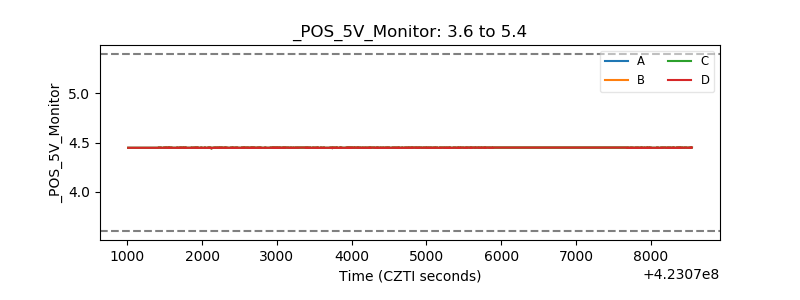 |
| _ROLL_ROT | 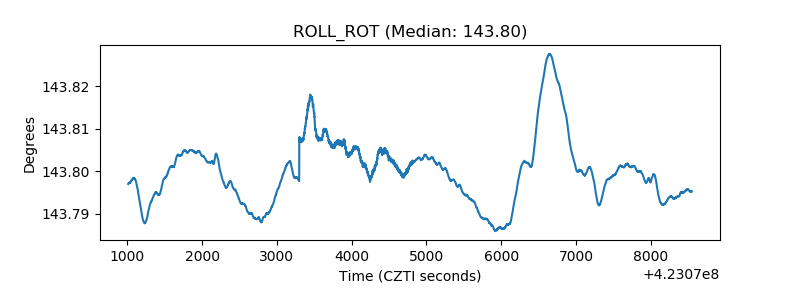 |
| _Roll_DEC | 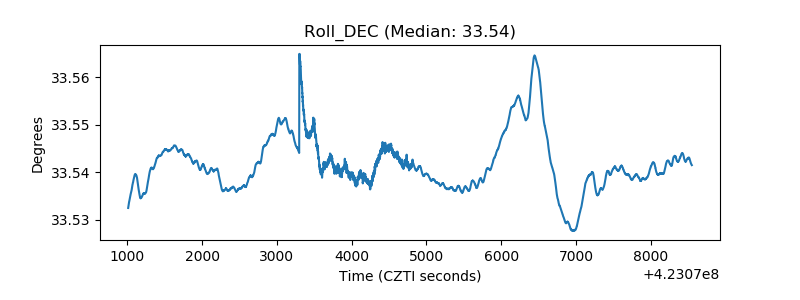 |
| _Roll_RA | 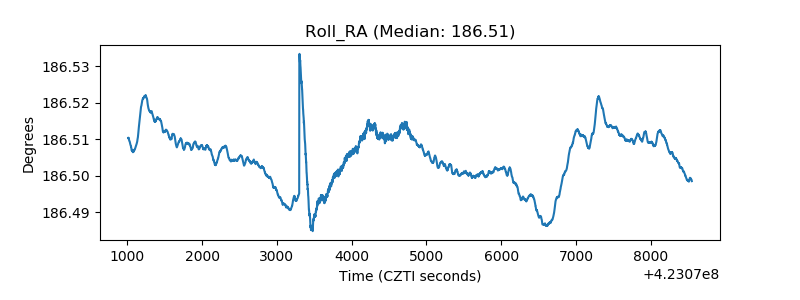 |
| Veto Counter | 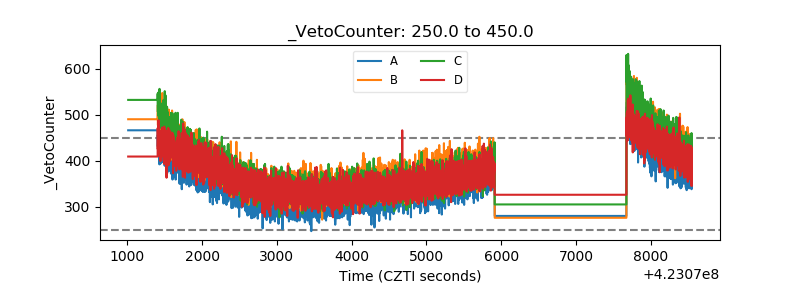 |