| Param | Original file | Final file |
|---|---|---|
| Filename | modeM0/AS1T05_100T01_9000005668_41458cztM0_level2.fits | modeM0/AS1T05_100T01_9000005668_41458cztM0_level2_quad_clean.evt |
| Size (bytes) | 326,750,400 | 89,723,520 |
| Size | 311.6 MB | 85.6 MB |
| Events in quadrant A | 2,817,125 | 612,314 |
| Events in quadrant B | 2,459,440 | 629,091 |
| Events in quadrant C | 3,031,513 | 570,432 |
| Events in quadrant D | 3,377,910 | 537,544 |
| Mode M9 | |||
|---|---|---|---|
| Quadrant | BADHDUFLAG | Total packets | Discarded packets |
| A | 0 | 22 | 0 |
| B | 0 | 22 | 0 |
| C | 0 | 22 | 0 |
| D | 0 | 23 | 0 |
| Mode SS | |||
|---|---|---|---|
| Quadrant | BADHDUFLAG | Total packets | Discarded packets |
| A | 0 | 106 | 0 |
| B | 0 | 106 | 0 |
| C | 0 | 106 | 0 |
| D | 0 | 106 | 0 |
| Mode M0 | |||
|---|---|---|---|
| Quadrant | BADHDUFLAG | Total packets | Discarded packets |
| A | 0 | 11575 | 3 |
| B | 0 | 10921 | 2 |
| C | 0 | 12334 | 2 |
| D | 0 | 13798 | 2 |
| Quadrant | Total seconds | Saturated seconds | Saturation percentage |
|---|---|---|---|
| A | 5250 | 11 | 0.209524% |
| B | 5250 | 18 | 0.342857% |
| C | 5250 | 236 | 4.495238% |
| D | 5250 | 188 | 3.580952% |
Noise dominated data is calculated using 1-second bins in cleaned event files. If a bin has >2000 counts, and if more than 50% of those come from <1% of pixels, then it is considered to be noise-dominated and hence unusable.
| Quadrant | # 1 sec bins | Bins with >0 counts | Bins with >2000 counts | High rate bins dominated by noise | Noise dominated (total time) | Noise dominated (detector-on time) | Marked lightcurve |
|---|---|---|---|---|---|---|---|
| A | 7133 | 5251 | 4 | 4 | 0.06% | 0.08% | 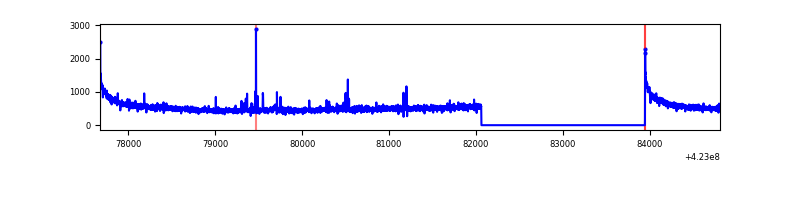 |
| B | 7133 | 5251 | 4 | 4 | 0.06% | 0.08% | 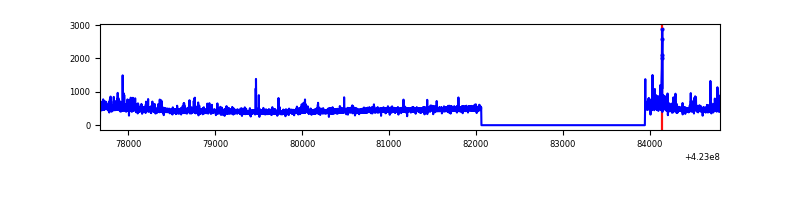 |
| C | 7133 | 5251 | 231 | 231 | 3.24% | 4.40% | 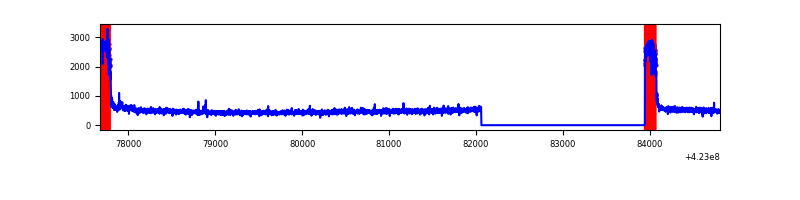 |
| D | 7133 | 5251 | 171 | 171 | 2.40% | 3.26% | 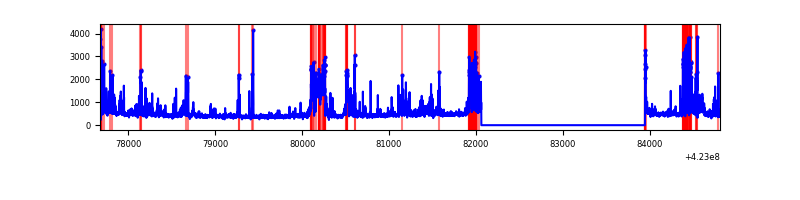 |
Top three noisy pixels from each quadrant. If the there are fewer than three noisy pixels in the level2.evt file, extra rows are filled as -1
| Pixel properties | Quadrant properties | ||||||
|---|---|---|---|---|---|---|---|
| Quadrant | DetID | PixID | Counts | Sigma | Mean | Median | Sigma |
| A | 10 | 83 | 513984 | 4316.33 | 583 | 574 | 118.9 |
| A | 13 | 248 | 22948 | 188.1 | 583 | 574 | 118.9 |
| A | 2 | 79 | 21919 | 179.45 | 583 | 574 | 118.9 |
| B | 0 | 190 | 140750 | 1249.94 | 585 | 570 | 112.1 |
| B | 12 | 111 | 13961 | 119.4 | 585 | 570 | 112.1 |
| B | 11 | 111 | 12981 | 110.66 | 585 | 570 | 112.1 |
| C | 0 | 10 | 633218 | 4846.84 | 556 | 561 | 130.5 |
| C | 15 | 214 | 214610 | 1639.85 | 556 | 561 | 130.5 |
| C | 9 | 54 | 14599 | 107.55 | 556 | 561 | 130.5 |
| D | 1 | 47 | 376410 | 2727.11 | 562 | 548 | 137.8 |
| D | 12 | 233 | 361976 | 2622.39 | 562 | 548 | 137.8 |
| D | 13 | 249 | 345603 | 2503.59 | 562 | 548 | 137.8 |
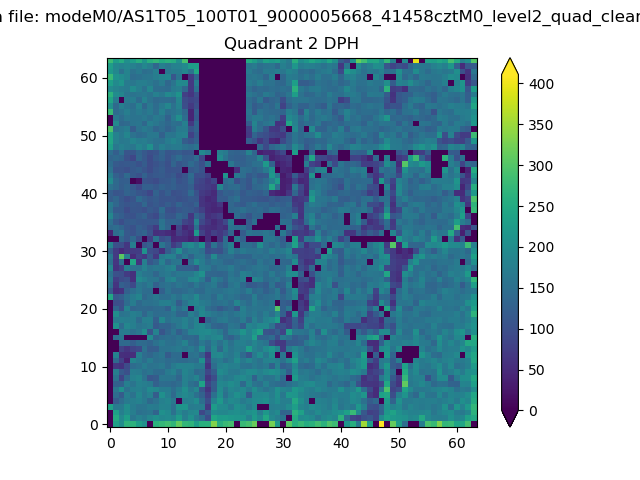
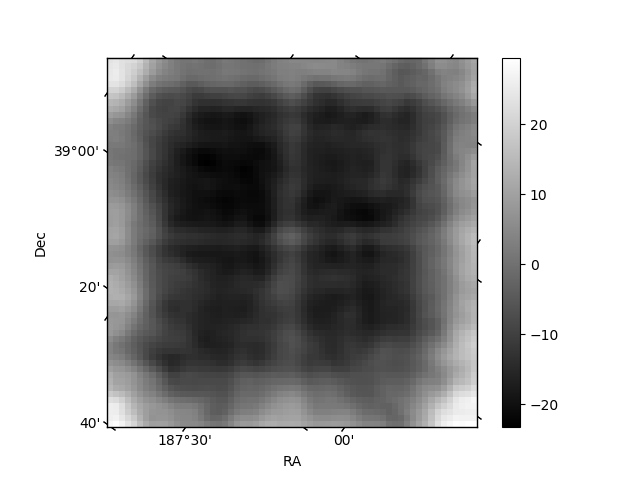
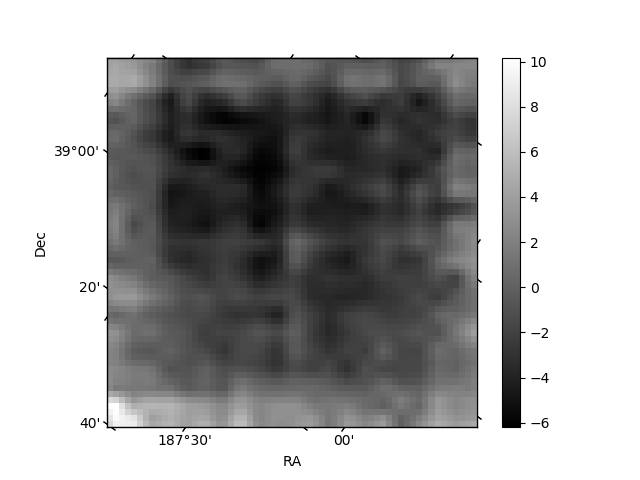
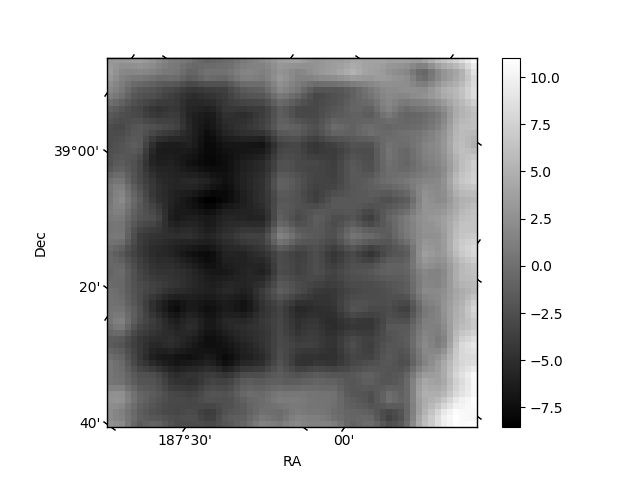
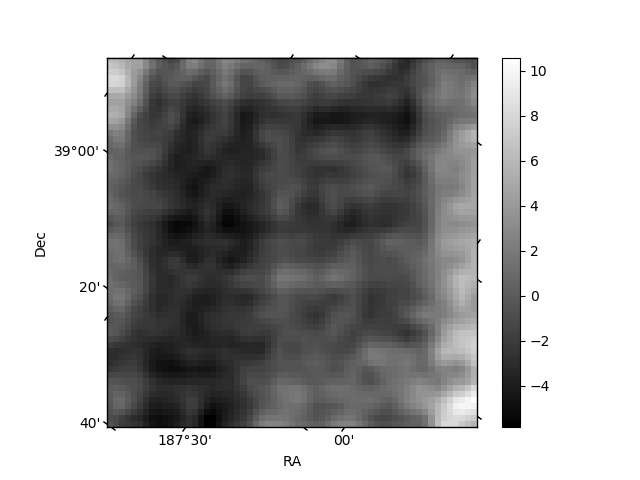
Histogram calculated using DETX and DETY for each event in the final _common_clean file
| Quadrant A | 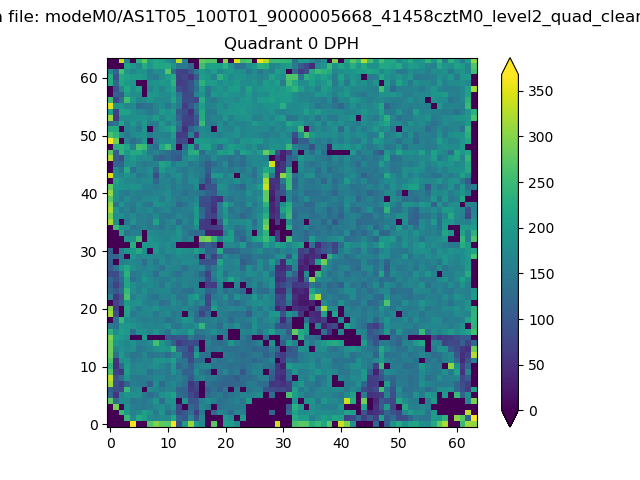 |
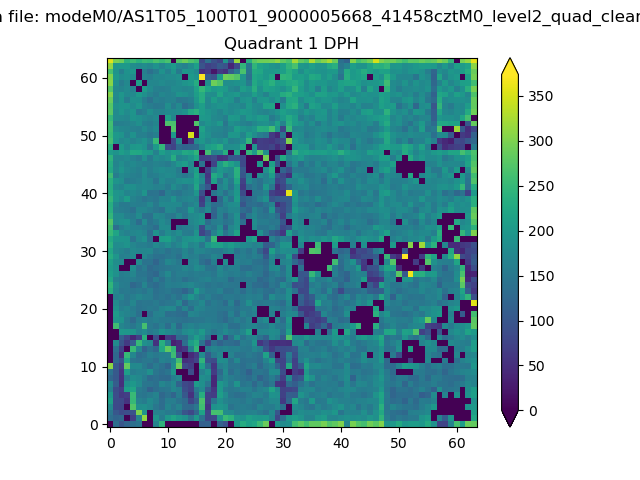 |
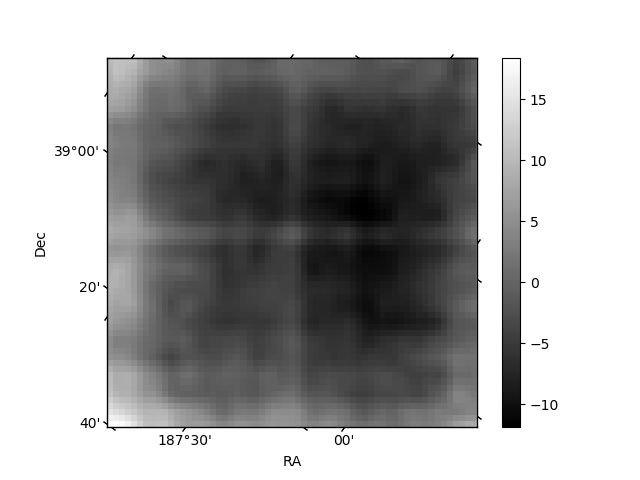
Quadrant B |
|---|---|---|---|
| Quadrant D | 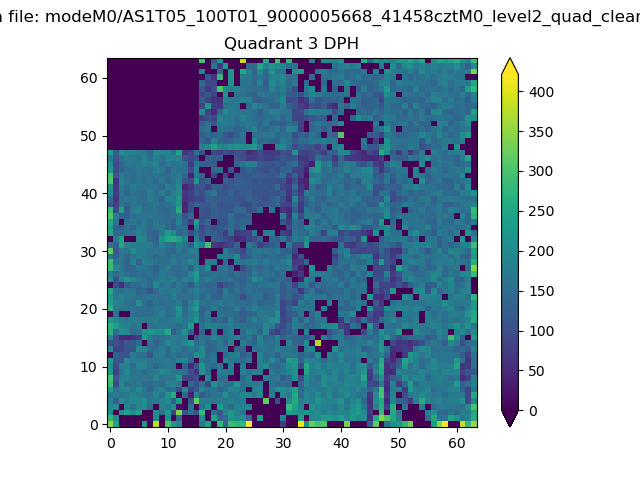 |
 |
Quadrant C |
| Plot type | Count rate plots | Images |
|---|---|---|
| Comparison with Poisson distribution Blue bars denote a histogram of data divided into 1 sec bins. Red curve is a Poisson curve with rate = median count rate of data. |
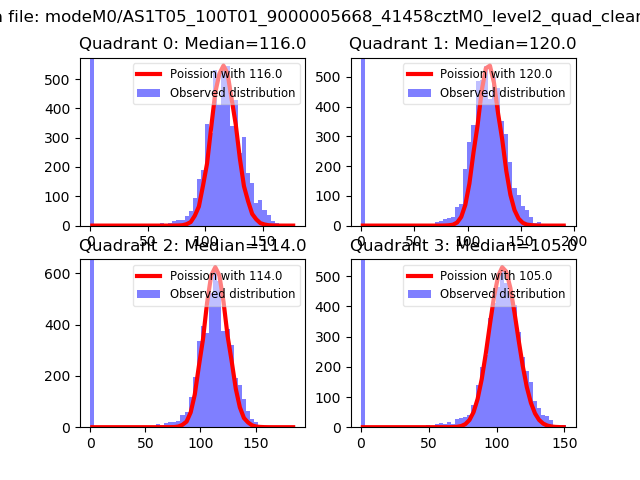 |
 |
| Quadrant-wise count rates Data is divided into 100 sec bins |
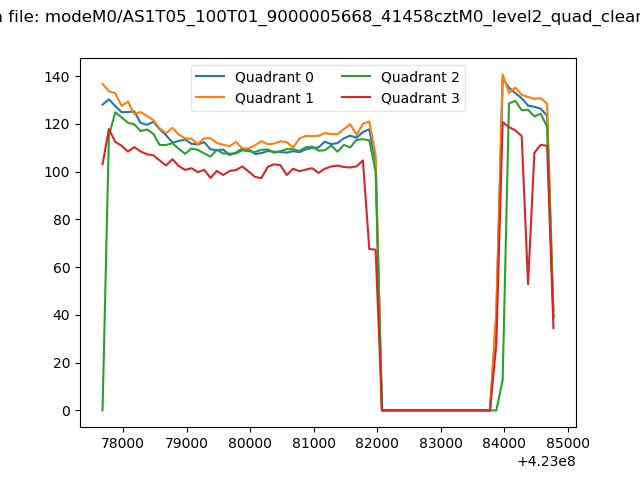 |
|
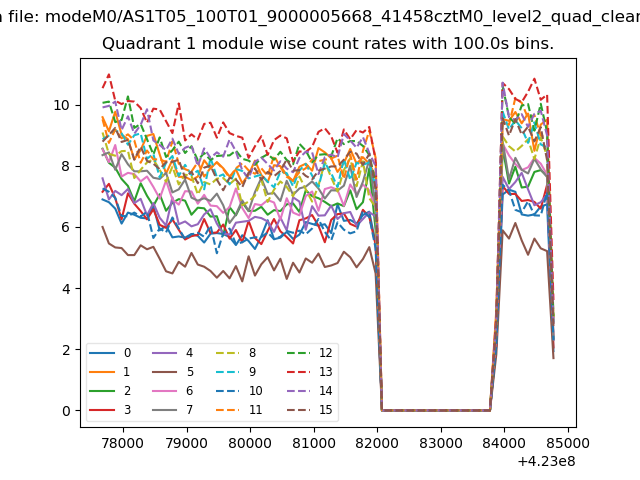
| Module-wise count rates for Quadrant A Data is divided into 100 sec bins |
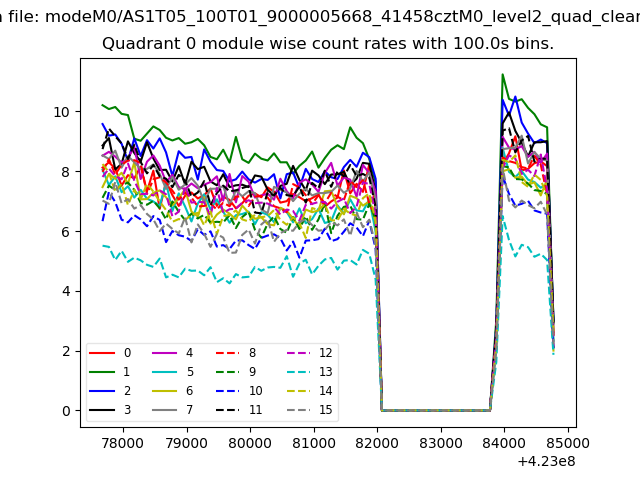 |
 |
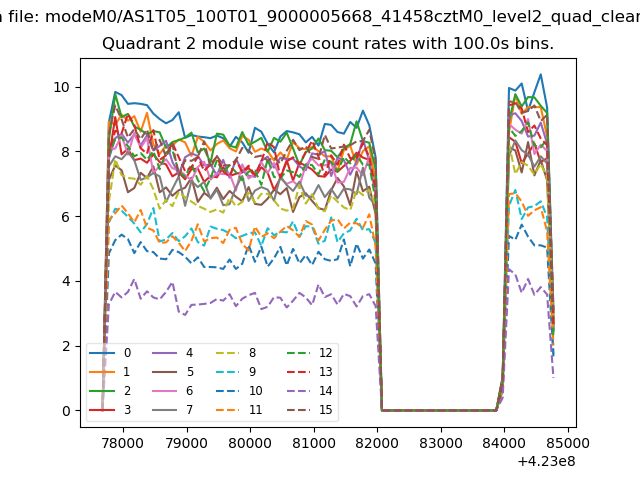
| Module-wise count rates for Quadrant B Data is divided into 100 sec bins |
 |
 |
| Module-wise count rates for Quadrant C Data is divided into 100 sec bins |
 |
 |
| Module-wise count rates for Quadrant D Data is divided into 100 sec bins |
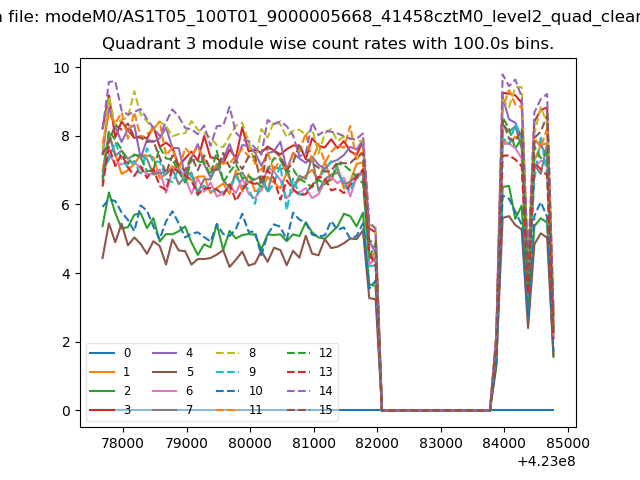 |
 |
| Parameter | Plot |
|---|---|
| CZT HV Monitor | 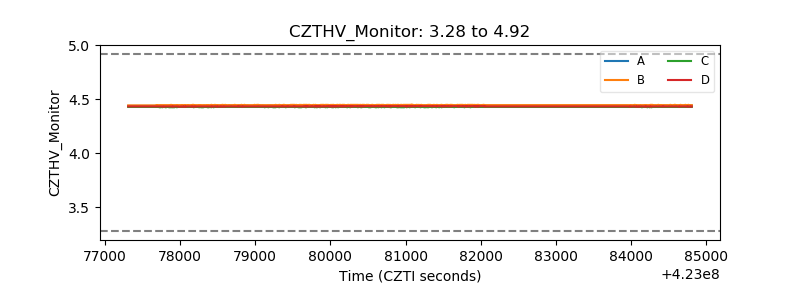 |
| D_VDD | 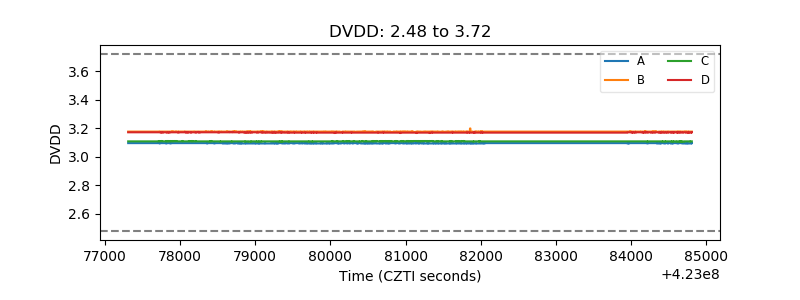 |
| Temperature 1 | 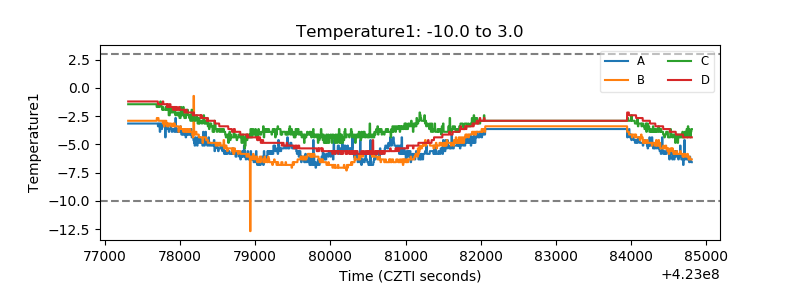 |
| Veto HV Monitor |  |
| Veto LLD | 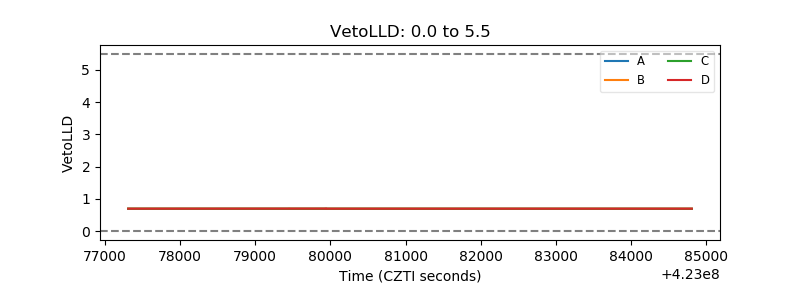 |
| Alpha Counter | 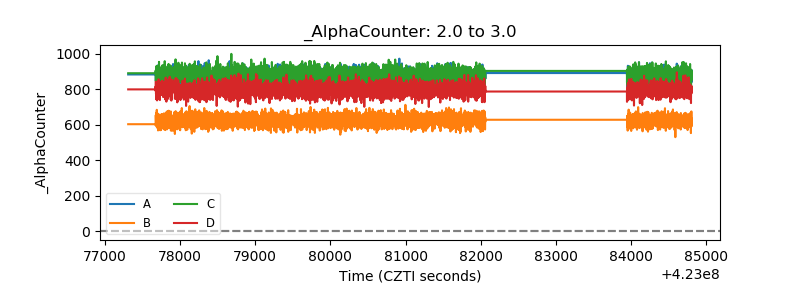 |
| _CPM_Rate | 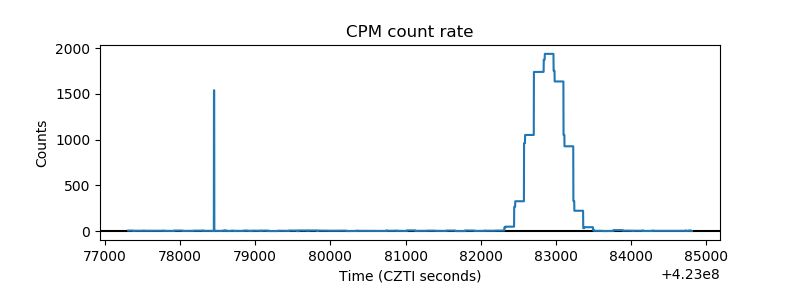 |
| CZT Counter | 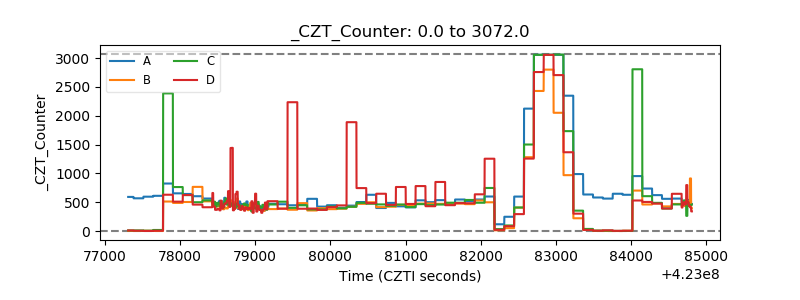 |
| +2.5 Volts monitor | 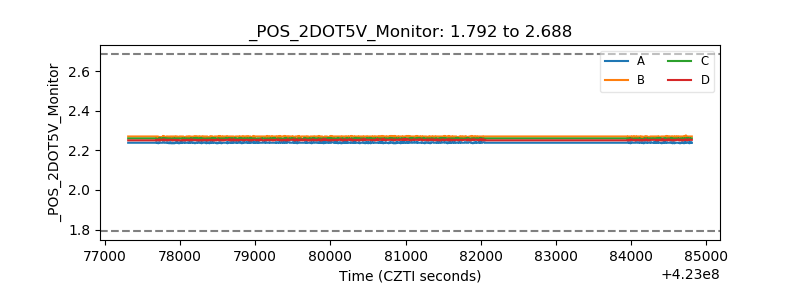 |
| +5 Volts monitor | 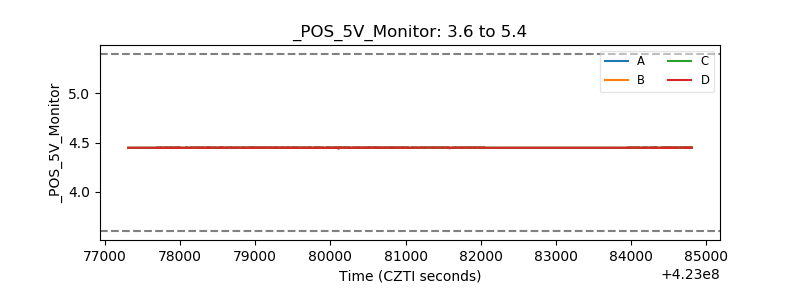 |
| _ROLL_ROT | 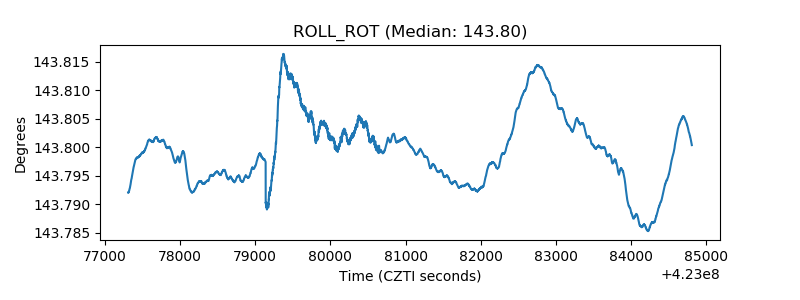 |
| _Roll_DEC | 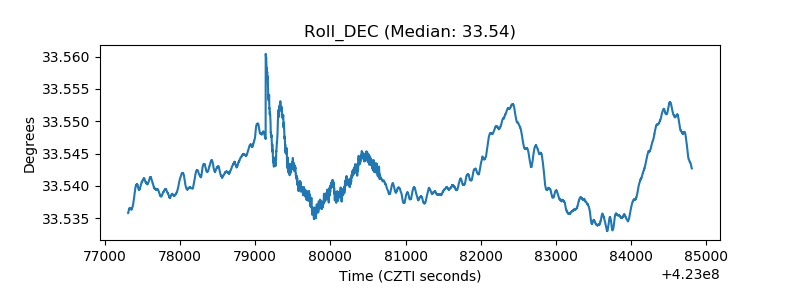 |
| _Roll_RA | 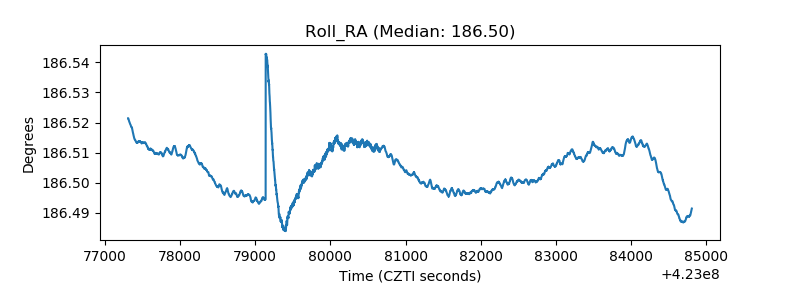 |
| Veto Counter | 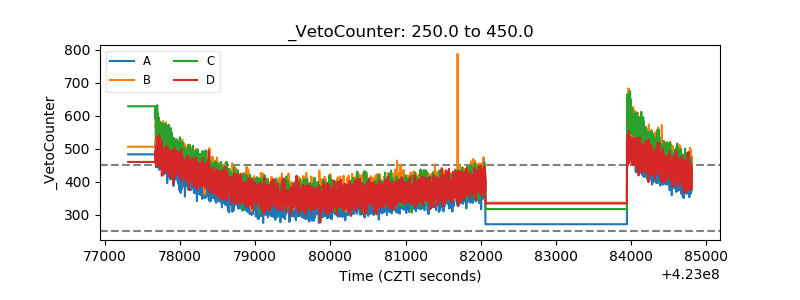 |