| Param | Original file | Final file |
|---|---|---|
| Filename | modeM0/AS1T05_100T01_9000005668_41459cztM0_level2.fits | modeM0/AS1T05_100T01_9000005668_41459cztM0_level2_quad_clean.evt |
| Size (bytes) | 329,106,240 | 87,249,600 |
| Size | 313.9 MB | 83.2 MB |
| Events in quadrant A | 2,732,058 | 601,094 |
| Events in quadrant B | 2,401,984 | 621,836 |
| Events in quadrant C | 3,014,176 | 556,575 |
| Events in quadrant D | 3,642,021 | 509,971 |
| Mode M9 | |||
|---|---|---|---|
| Quadrant | BADHDUFLAG | Total packets | Discarded packets |
| A | 0 | 32 | 0 |
| B | 0 | 32 | 0 |
| C | 0 | 32 | 0 |
| D | 0 | 33 | 0 |
| Mode SS | |||
|---|---|---|---|
| Quadrant | BADHDUFLAG | Total packets | Discarded packets |
| A | 0 | 102 | 0 |
| B | 0 | 102 | 0 |
| C | 0 | 102 | 0 |
| D | 0 | 102 | 0 |
| Mode M0 | |||
|---|---|---|---|
| Quadrant | BADHDUFLAG | Total packets | Discarded packets |
| A | 0 | 11091 | 3 |
| B | 0 | 10474 | 2 |
| C | 0 | 11988 | 2 |
| D | 0 | 14271 | 2 |
| Quadrant | Total seconds | Saturated seconds | Saturation percentage |
|---|---|---|---|
| A | 5031 | 11 | 0.218644% |
| B | 5031 | 16 | 0.318028% |
| C | 5031 | 258 | 5.128205% |
| D | 5031 | 329 | 6.539455% |
Noise dominated data is calculated using 1-second bins in cleaned event files. If a bin has >2000 counts, and if more than 50% of those come from <1% of pixels, then it is considered to be noise-dominated and hence unusable.
| Quadrant | # 1 sec bins | Bins with >0 counts | Bins with >2000 counts | High rate bins dominated by noise | Noise dominated (total time) | Noise dominated (detector-on time) | Marked lightcurve |
|---|---|---|---|---|---|---|---|
| A | 7034 | 5032 | 5 | 5 | 0.07% | 0.10% | 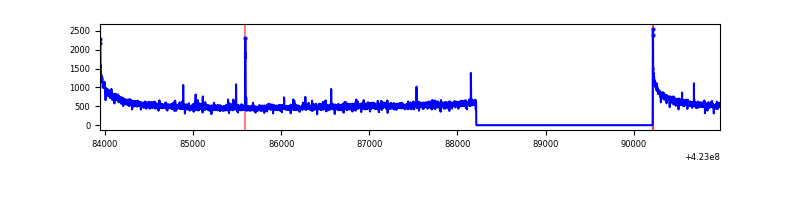 |
| B | 7034 | 5032 | 4 | 4 | 0.06% | 0.08% | 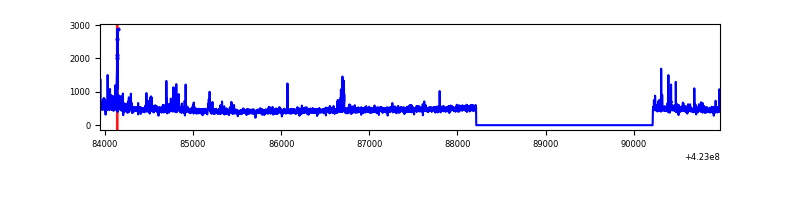 |
| C | 7034 | 5032 | 254 | 254 | 3.61% | 5.05% | 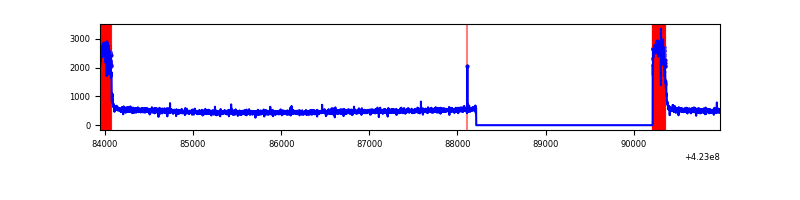 |
| D | 7034 | 5032 | 292 | 292 | 4.15% | 5.80% | 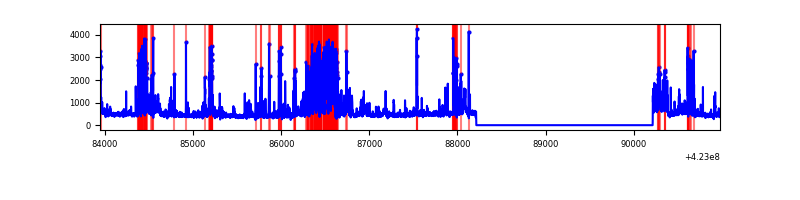 |
Top three noisy pixels from each quadrant. If the there are fewer than three noisy pixels in the level2.evt file, extra rows are filled as -1
| Pixel properties | Quadrant properties | ||||||
|---|---|---|---|---|---|---|---|
| Quadrant | DetID | PixID | Counts | Sigma | Mean | Median | Sigma |
| A | 10 | 83 | 490257 | 4229.72 | 571 | 561 | 115.8 |
| A | 13 | 248 | 22100 | 186.04 | 571 | 561 | 115.8 |
| A | 13 | 254 | 8205 | 66.02 | 571 | 561 | 115.8 |
| B | 0 | 190 | 136242 | 1233.43 | 572 | 557 | 110.0 |
| B | 12 | 111 | 13828 | 120.64 | 572 | 557 | 110.0 |
| B | 11 | 111 | 12482 | 108.4 | 572 | 557 | 110.0 |
| C | 0 | 10 | 706096 | 5590.55 | 539 | 544 | 126.2 |
| C | 15 | 214 | 204385 | 1615.17 | 539 | 544 | 126.2 |
| C | 12 | 249 | 4485 | 31.23 | 539 | 544 | 126.2 |
| D | 13 | 249 | 758091 | 5749.72 | 538 | 523 | 131.8 |
| D | 12 | 233 | 296620 | 2247.29 | 538 | 523 | 131.8 |
| D | 2 | 249 | 243057 | 1840.76 | 538 | 523 | 131.8 |
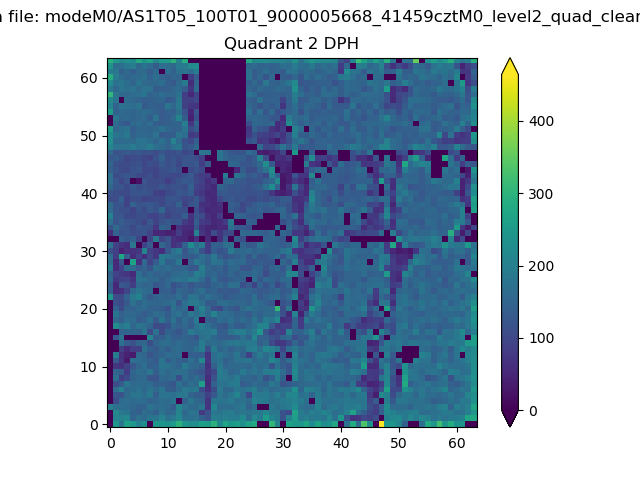
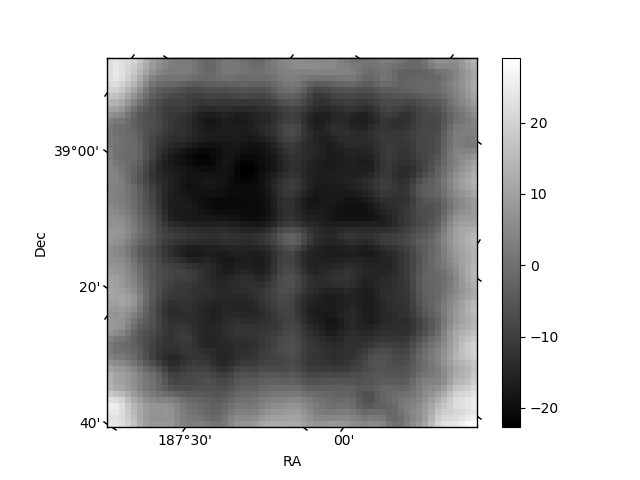
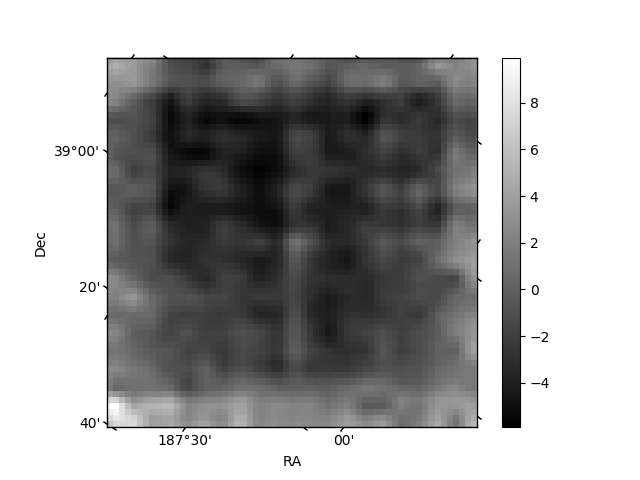
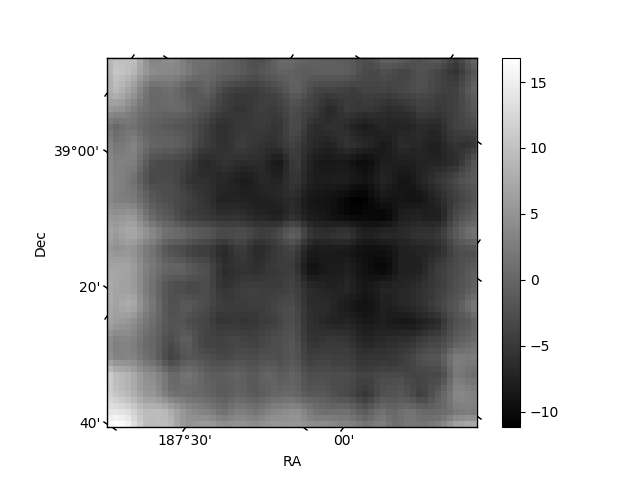
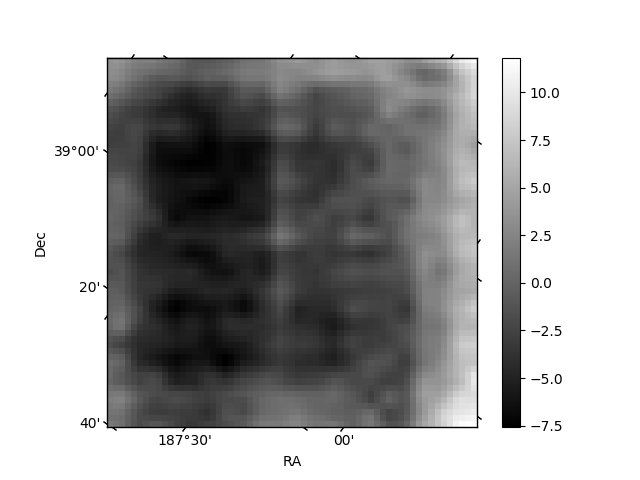
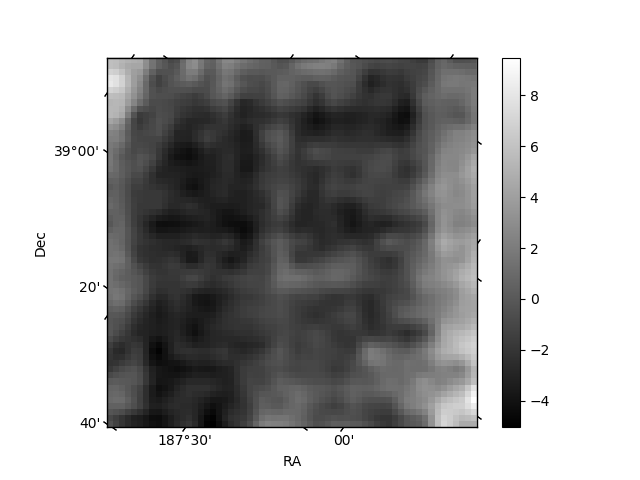
Histogram calculated using DETX and DETY for each event in the final _common_clean file
| Quadrant A | 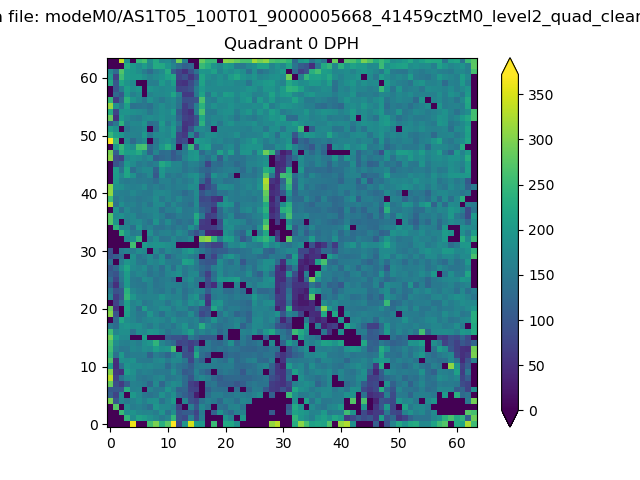 |
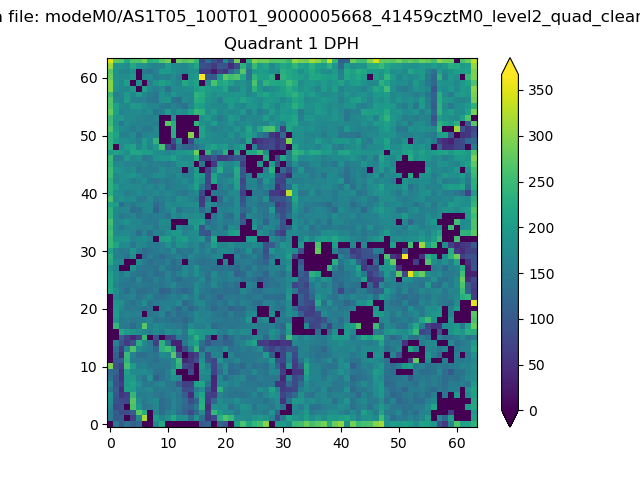 |
Quadrant B |
|---|---|---|---|
| Quadrant D | 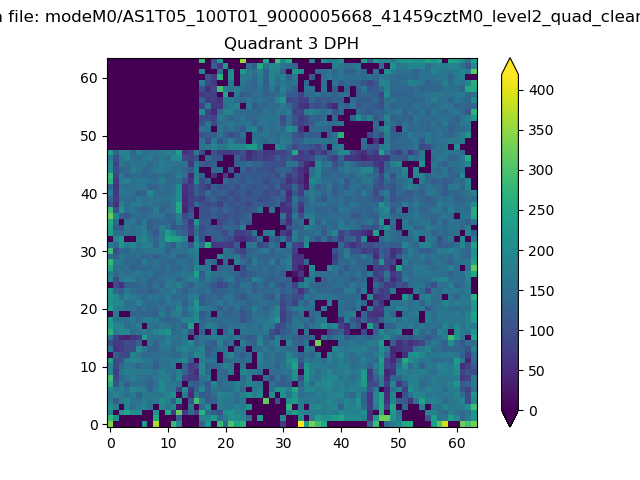 |
 |
Quadrant C |
| Plot type | Count rate plots | Images |
|---|---|---|
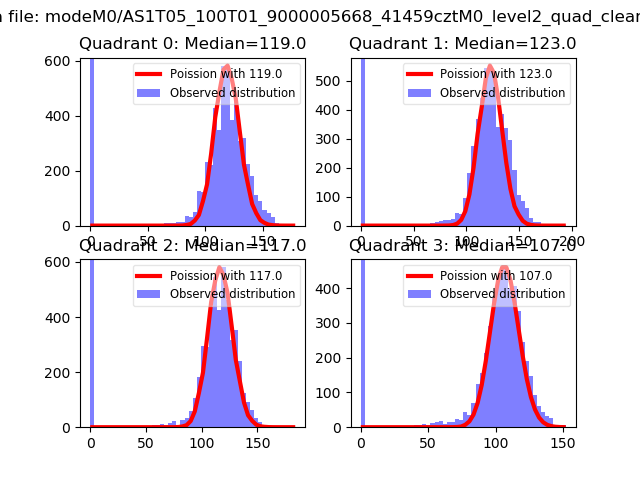
| Comparison with Poisson distribution Blue bars denote a histogram of data divided into 1 sec bins. Red curve is a Poisson curve with rate = median count rate of data. |
 |
 |
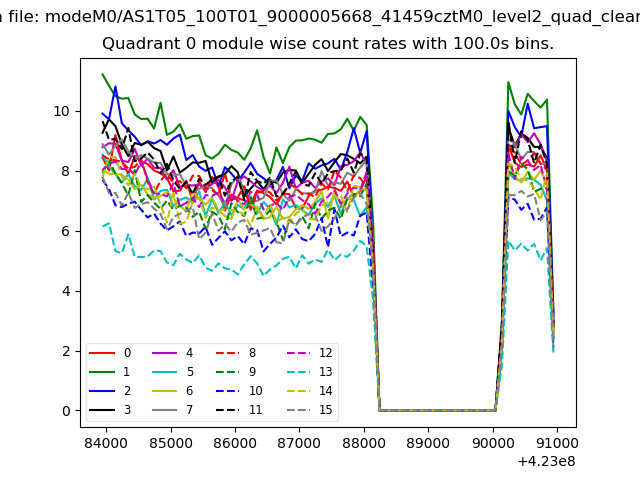
| Quadrant-wise count rates Data is divided into 100 sec bins |
 |
|
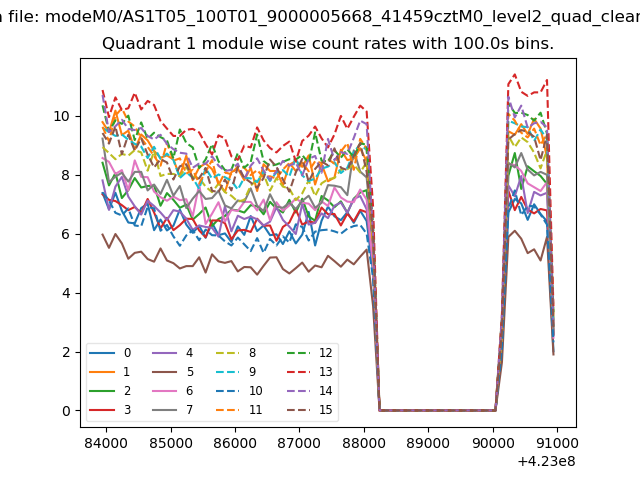
| Module-wise count rates for Quadrant A Data is divided into 100 sec bins |
 |
 |
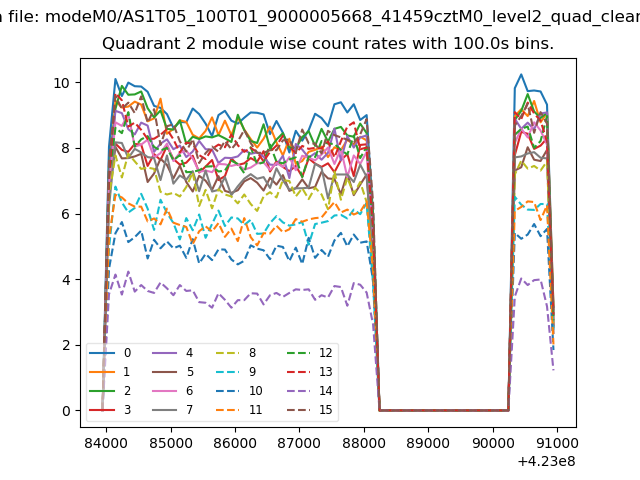
| Module-wise count rates for Quadrant B Data is divided into 100 sec bins |
 |
 |
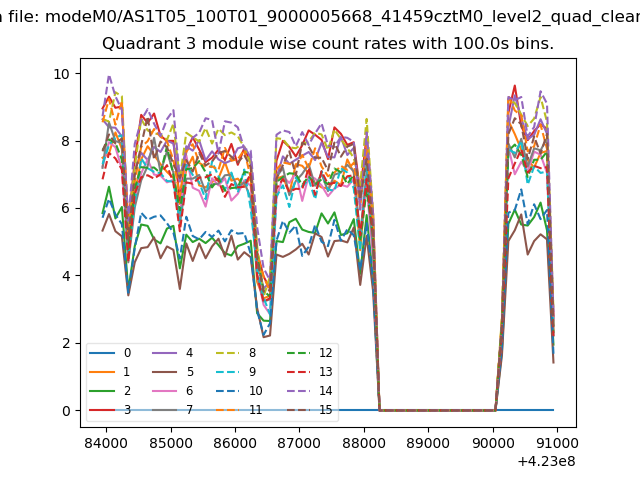
| Module-wise count rates for Quadrant C Data is divided into 100 sec bins |
 |
 |
| Module-wise count rates for Quadrant D Data is divided into 100 sec bins |
 |
 |
| Parameter | Plot |
|---|---|
| CZT HV Monitor | 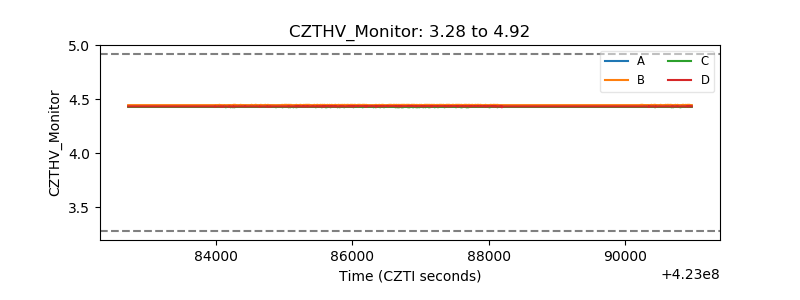 |
| D_VDD | 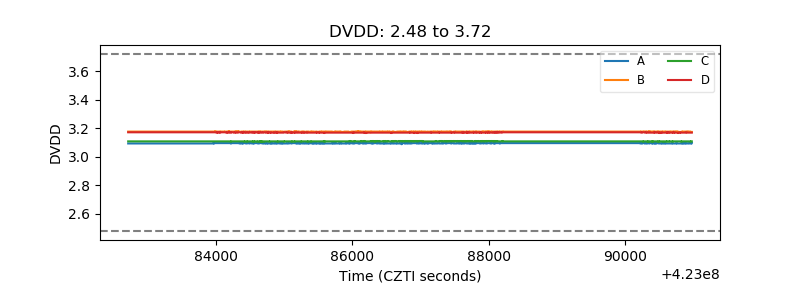 |
| Temperature 1 | 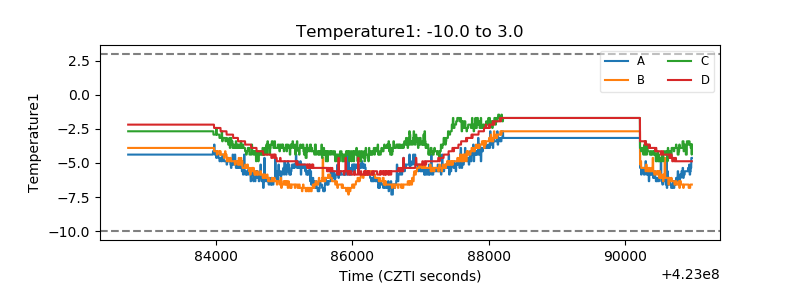 |
| Veto HV Monitor | 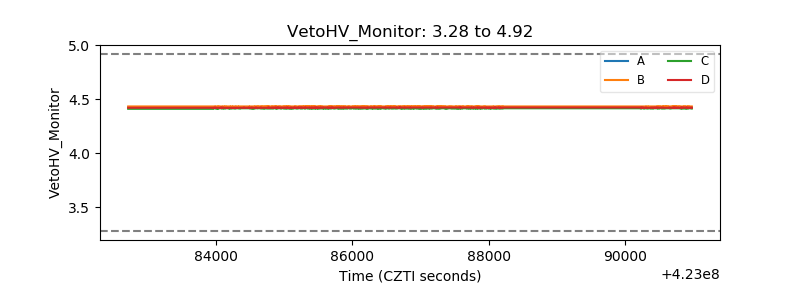 |
| Veto LLD | 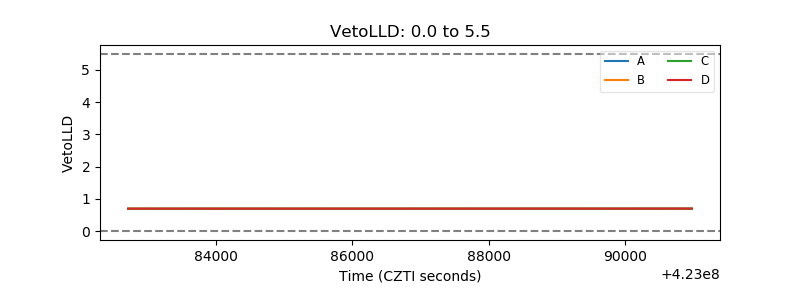 |
| Alpha Counter | 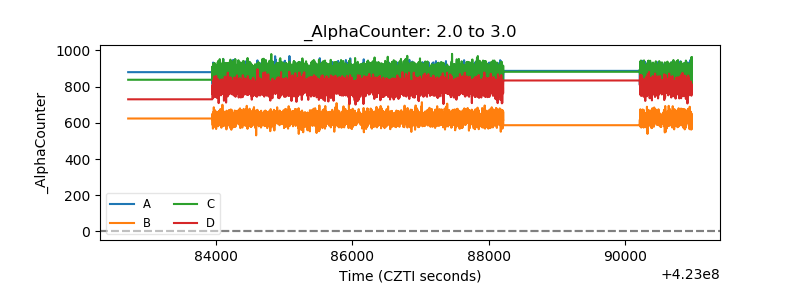 |
| _CPM_Rate | 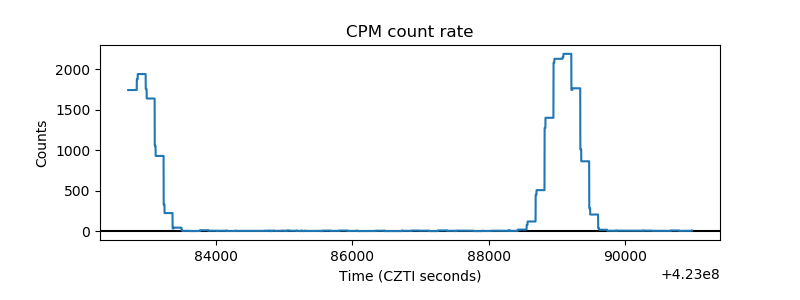 |
| CZT Counter | 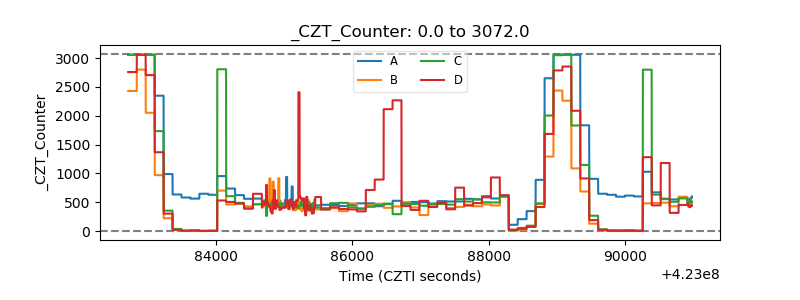 |
| +2.5 Volts monitor | 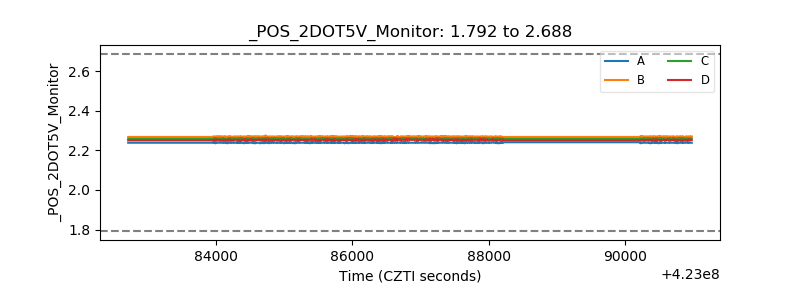 |
| +5 Volts monitor | 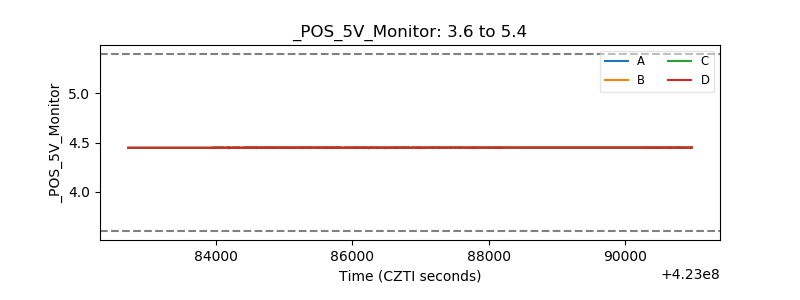 |
| _ROLL_ROT | 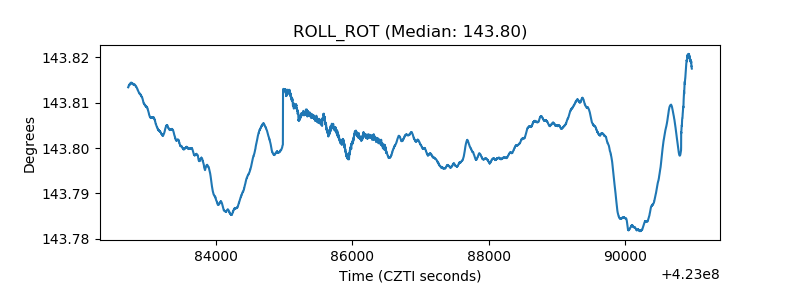 |
| _Roll_DEC | 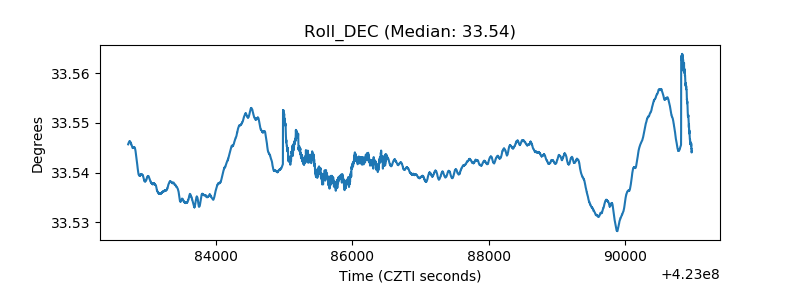 |
| _Roll_RA | 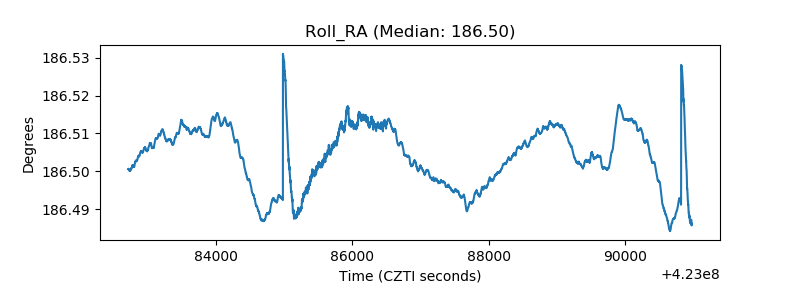 |
| Veto Counter | 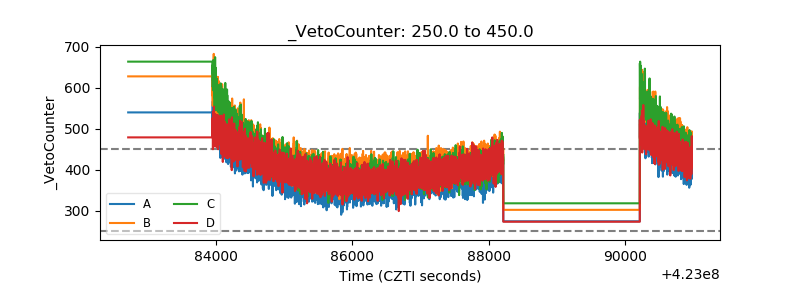 |