| Param | Original file | Final file |
|---|---|---|
| Filename | modeM0/AS1T05_100T01_9000005668_41460cztM0_level2.fits | modeM0/AS1T05_100T01_9000005668_41460cztM0_level2_quad_clean.evt |
| Size (bytes) | 306,138,240 | 83,113,920 |
| Size | 292.0 MB | 79.3 MB |
| Events in quadrant A | 2,629,796 | 568,474 |
| Events in quadrant B | 2,214,941 | 592,827 |
| Events in quadrant C | 2,985,429 | 527,100 |
| Events in quadrant D | 3,129,861 | 493,872 |
| Mode M9 | |||
|---|---|---|---|
| Quadrant | BADHDUFLAG | Total packets | Discarded packets |
| A | 0 | 33 | 0 |
| B | 0 | 33 | 0 |
| C | 0 | 33 | 0 |
| D | 0 | 34 | 0 |
| Mode SS | |||
|---|---|---|---|
| Quadrant | BADHDUFLAG | Total packets | Discarded packets |
| A | 0 | 96 | 0 |
| B | 0 | 96 | 0 |
| C | 0 | 96 | 0 |
| D | 0 | 96 | 0 |
| Mode M0 | |||
|---|---|---|---|
| Quadrant | BADHDUFLAG | Total packets | Discarded packets |
| A | 0 | 10699 | 2 |
| B | 0 | 9712 | 2 |
| C | 0 | 11752 | 2 |
| D | 0 | 12603 | 2 |
| Quadrant | Total seconds | Saturated seconds | Saturation percentage |
|---|---|---|---|
| A | 4771 | 13 | 0.272480% |
| B | 4771 | 9 | 0.188640% |
| C | 4771 | 266 | 5.575351% |
| D | 4771 | 204 | 4.275833% |
Noise dominated data is calculated using 1-second bins in cleaned event files. If a bin has >2000 counts, and if more than 50% of those come from <1% of pixels, then it is considered to be noise-dominated and hence unusable.
| Quadrant | # 1 sec bins | Bins with >0 counts | Bins with >2000 counts | High rate bins dominated by noise | Noise dominated (total time) | Noise dominated (detector-on time) | Marked lightcurve |
|---|---|---|---|---|---|---|---|
| A | 6863 | 4772 | 6 | 6 | 0.09% | 0.13% | 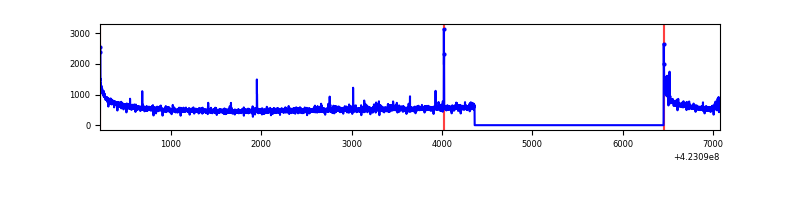 |
| B | 6863 | 4772 | 0 | 0 | 0.00% | 0.00% | 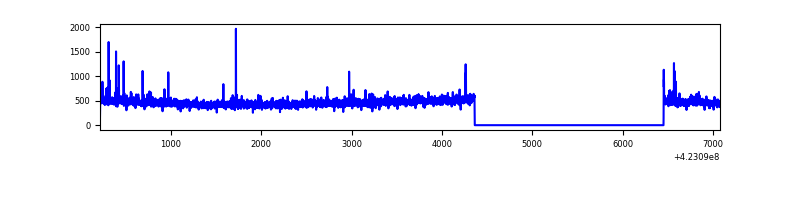 |
| C | 6863 | 4772 | 263 | 263 | 3.83% | 5.51% | 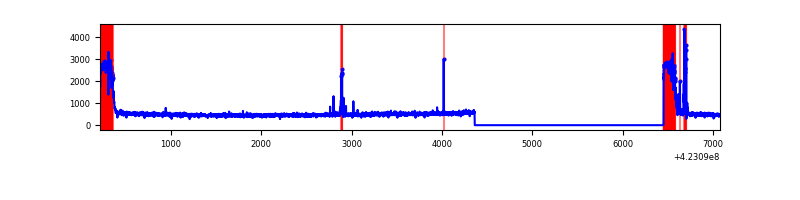 |
| D | 6863 | 4772 | 183 | 183 | 2.67% | 3.83% | 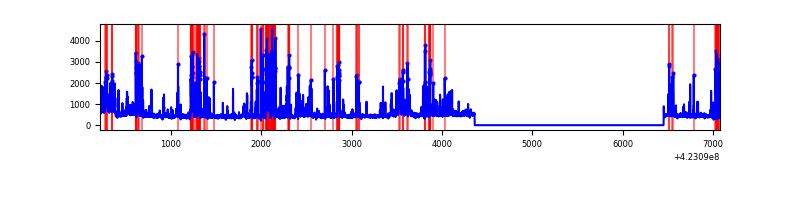 |
Top three noisy pixels from each quadrant. If the there are fewer than three noisy pixels in the level2.evt file, extra rows are filled as -1
| Pixel properties | Quadrant properties | ||||||
|---|---|---|---|---|---|---|---|
| Quadrant | DetID | PixID | Counts | Sigma | Mean | Median | Sigma |
| A | 10 | 83 | 468289 | 4179.4 | 543 | 533 | 111.9 |
| A | 2 | 79 | 49829 | 440.46 | 543 | 533 | 111.9 |
| A | 13 | 254 | 8038 | 67.06 | 543 | 533 | 111.9 |
| B | 0 | 190 | 57024 | 537.75 | 546 | 531 | 105.1 |
| B | 12 | 111 | 13441 | 122.89 | 546 | 531 | 105.1 |
| B | 11 | 111 | 12183 | 110.91 | 546 | 531 | 105.1 |
| C | 0 | 10 | 713583 | 5916.49 | 513 | 516 | 120.5 |
| C | 15 | 214 | 197369 | 1633.34 | 513 | 516 | 120.5 |
| C | 9 | 54 | 64876 | 534.01 | 513 | 516 | 120.5 |
| D | 13 | 249 | 573715 | 4482.09 | 515 | 501 | 127.9 |
| D | 1 | 47 | 293241 | 2289.0 | 515 | 501 | 127.9 |
| D | 12 | 233 | 84123 | 653.86 | 515 | 501 | 127.9 |
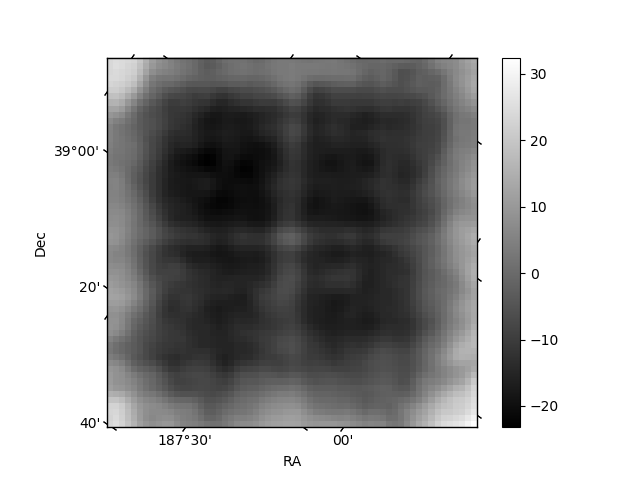
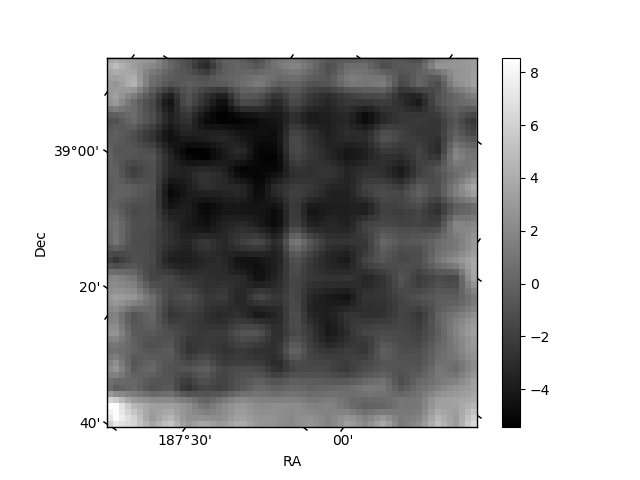
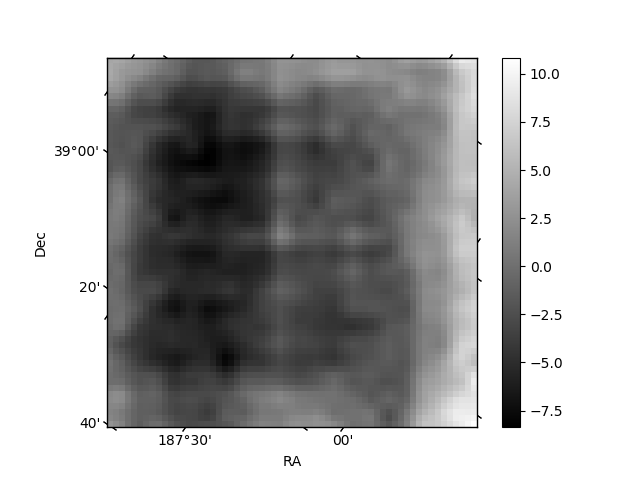
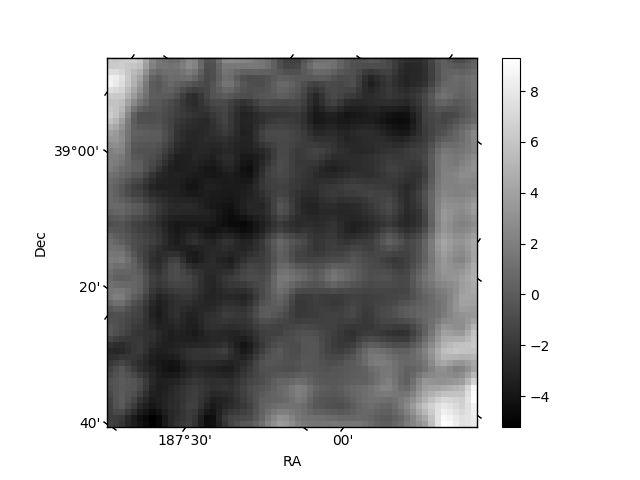
Histogram calculated using DETX and DETY for each event in the final _common_clean file
| Quadrant A | 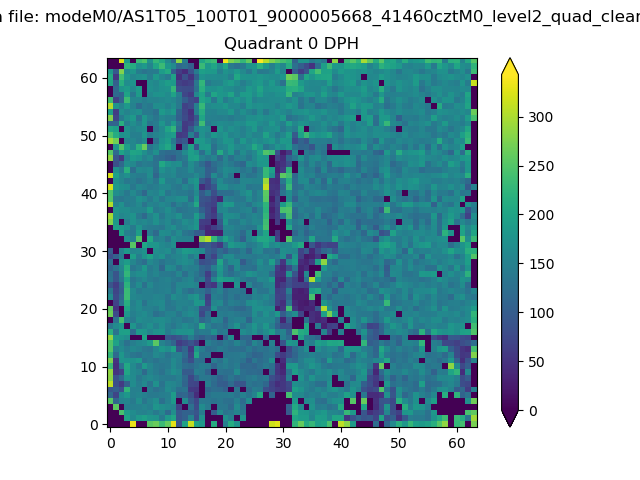 |
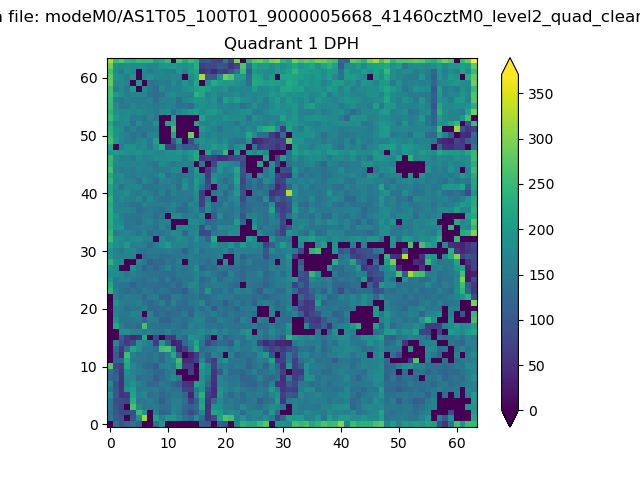 |
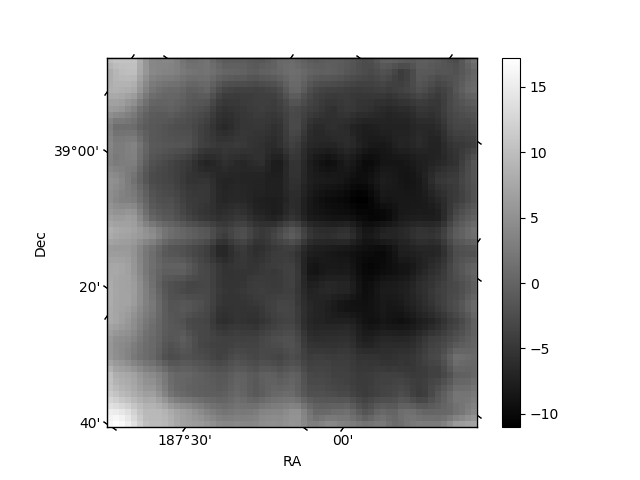
Quadrant B |
|---|---|---|---|
| Quadrant D | 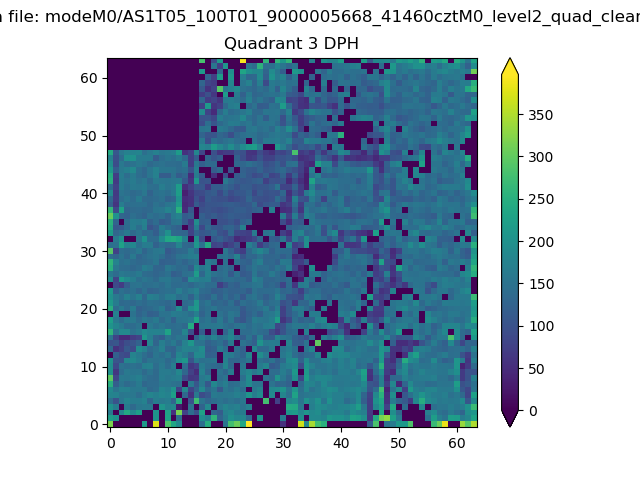 |
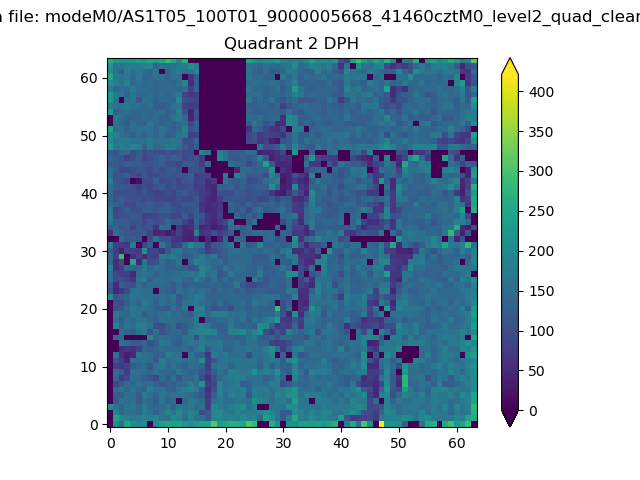 |
Quadrant C |
| Plot type | Count rate plots | Images |
|---|---|---|
| Comparison with Poisson distribution Blue bars denote a histogram of data divided into 1 sec bins. Red curve is a Poisson curve with rate = median count rate of data. |
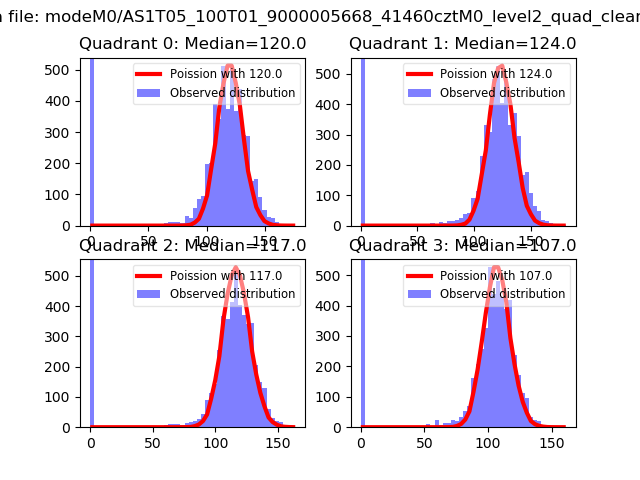 |
 |
| Quadrant-wise count rates Data is divided into 100 sec bins |
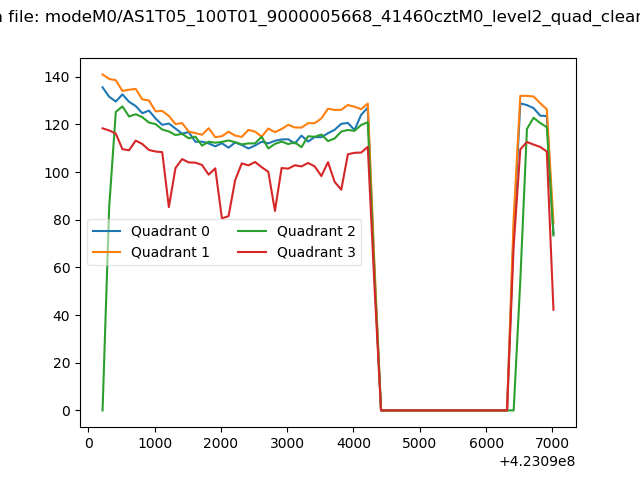 |
|
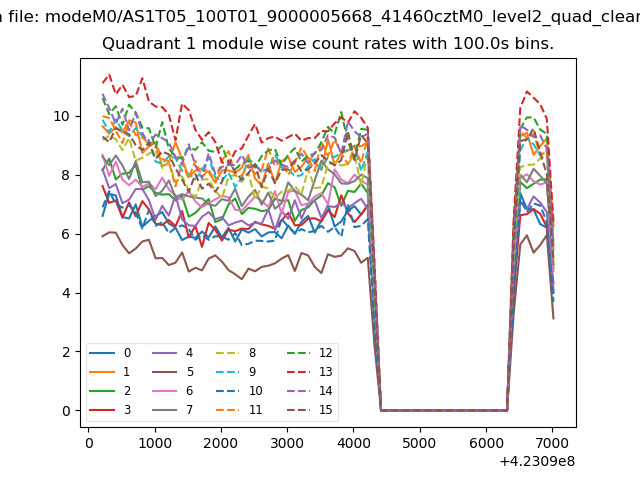
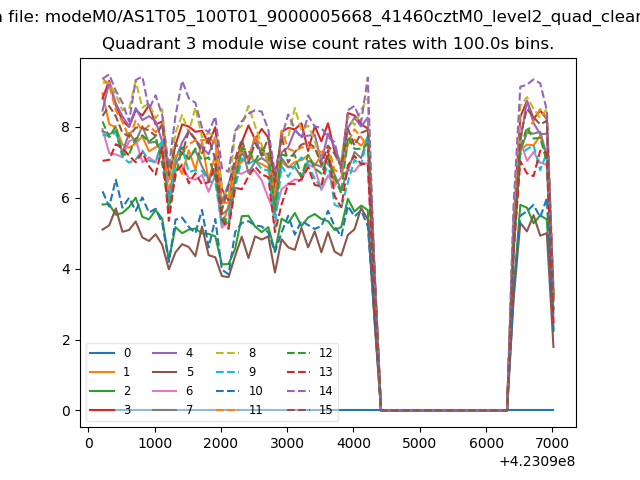
| Module-wise count rates for Quadrant A Data is divided into 100 sec bins |
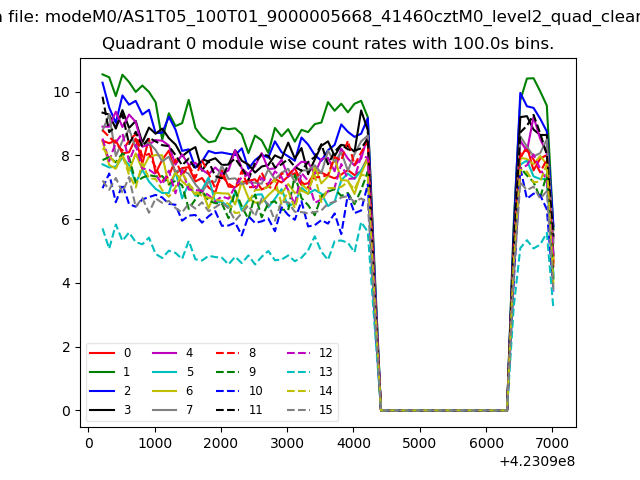 |
 |
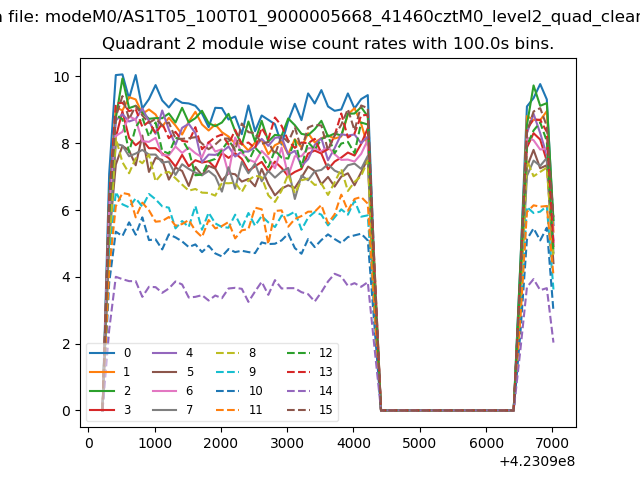
| Module-wise count rates for Quadrant B Data is divided into 100 sec bins |
 |
 |
| Module-wise count rates for Quadrant C Data is divided into 100 sec bins |
 |
 |
| Module-wise count rates for Quadrant D Data is divided into 100 sec bins |
 |
 |
| Parameter | Plot |
|---|---|
| CZT HV Monitor | 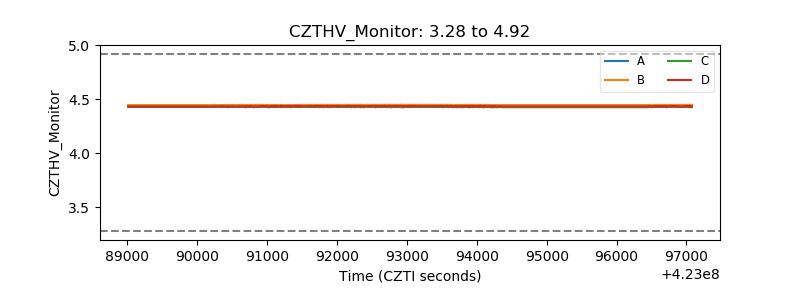 |
| D_VDD | 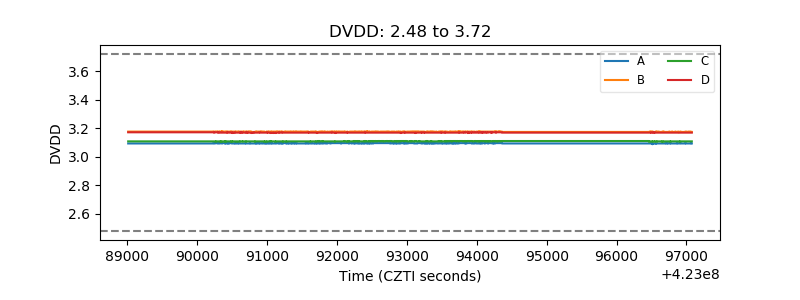 |
| Temperature 1 | 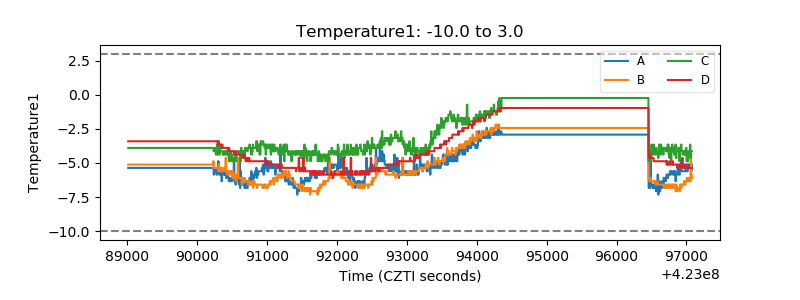 |
| Veto HV Monitor | 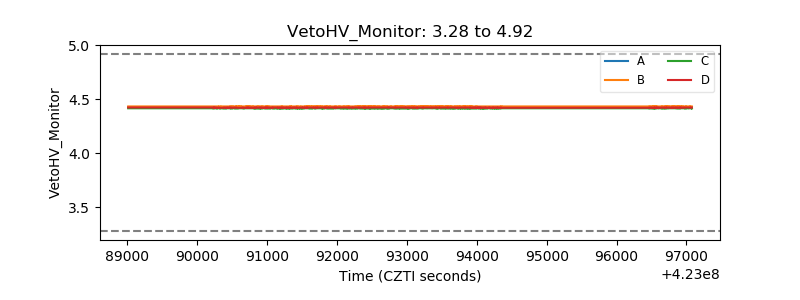 |
| Veto LLD | 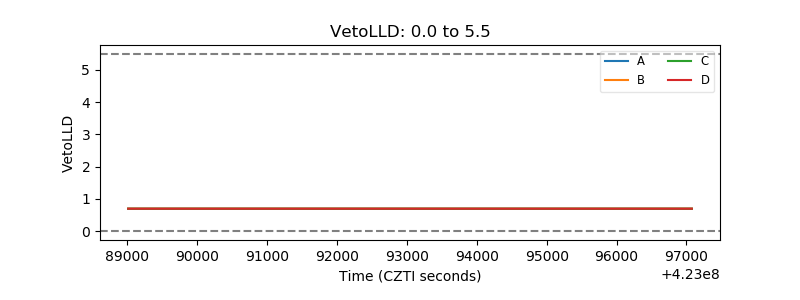 |
| Alpha Counter | 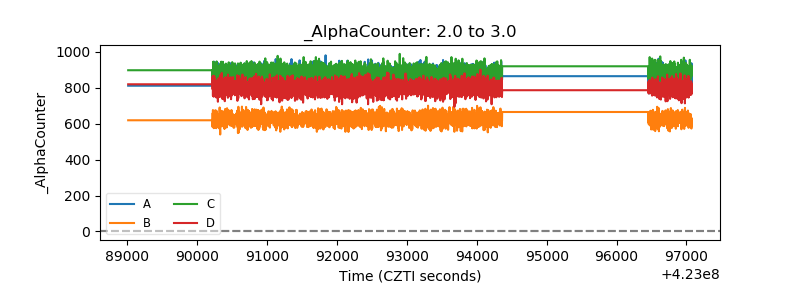 |
| _CPM_Rate | 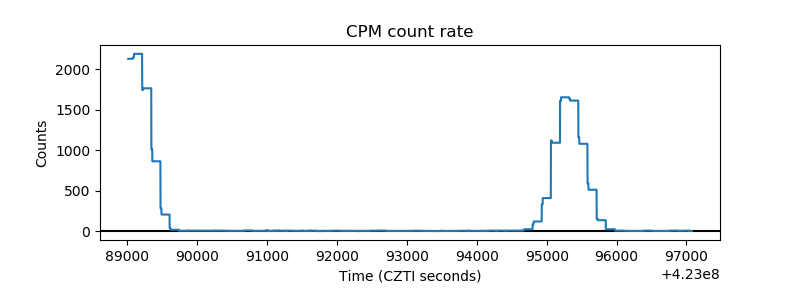 |
| CZT Counter | 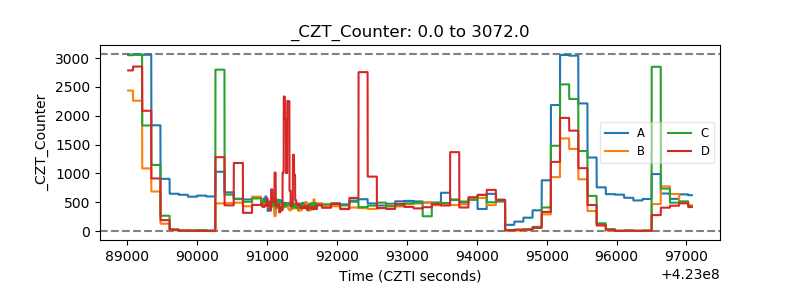 |
| +2.5 Volts monitor | 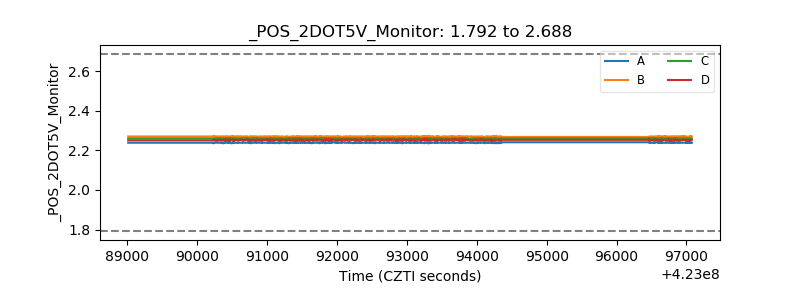 |
| +5 Volts monitor | 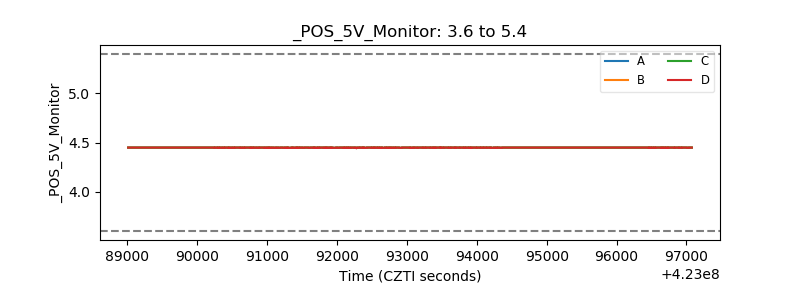 |
| _ROLL_ROT |  |
| _Roll_DEC | 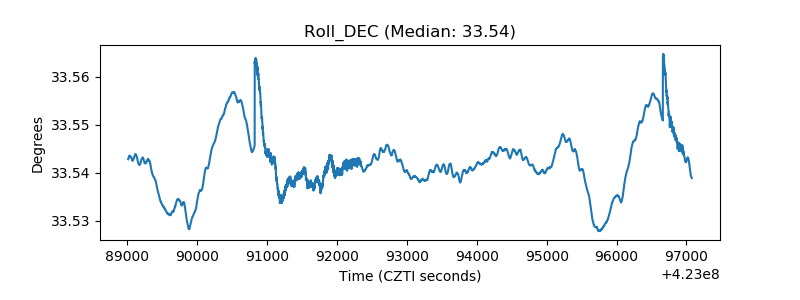 |
| _Roll_RA | 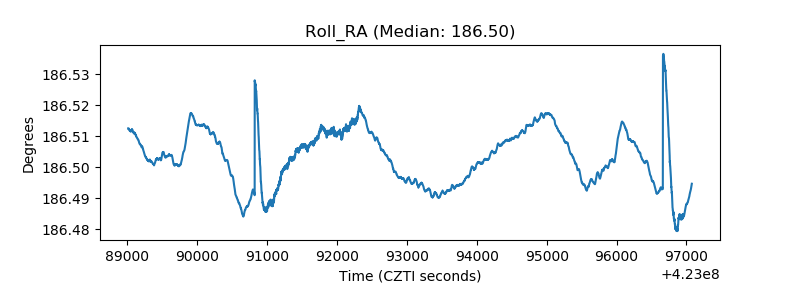 |
| Veto Counter | 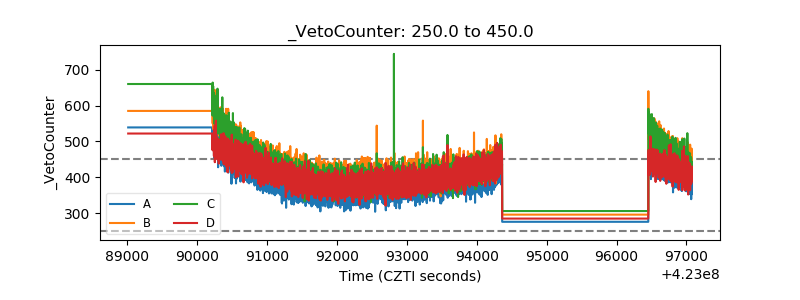 |