| Param | Original file | Final file |
|---|---|---|
| Filename | modeM0/AS1T05_100T01_9000005668_41462cztM0_level2.fits | modeM0/AS1T05_100T01_9000005668_41462cztM0_level2_quad_clean.evt |
| Size (bytes) | 1,046,957,760 | 295,266,240 |
| Size | 998.5 MB | 281.6 MB |
| Events in quadrant A | 9,080,846 | 2,001,471 |
| Events in quadrant B | 7,994,819 | 2,070,649 |
| Events in quadrant C | 9,454,564 | 1,915,425 |
| Events in quadrant D | 10,869,234 | 1,747,076 |
| Mode M9 | |||
|---|---|---|---|
| Quadrant | BADHDUFLAG | Total packets | Discarded packets |
| A | 0 | 77 | 0 |
| B | 0 | 77 | 0 |
| C | 0 | 77 | 0 |
| D | 0 | 77 | 0 |
| Mode SS | |||
|---|---|---|---|
| Quadrant | BADHDUFLAG | Total packets | Discarded packets |
| A | 0 | 358 | 0 |
| B | 0 | 358 | 0 |
| C | 0 | 358 | 0 |
| D | 0 | 358 | 0 |
| Mode M0 | |||
|---|---|---|---|
| Quadrant | BADHDUFLAG | Total packets | Discarded packets |
| A | 0 | 37528 | 4 |
| B | 0 | 35786 | 4 |
| C | 0 | 39113 | 4 |
| D | 0 | 44825 | 4 |
| Quadrant | Total seconds | Saturated seconds | Saturation percentage |
|---|---|---|---|
| A | 17494 | 31 | 0.177204% |
| B | 17494 | 37 | 0.211501% |
| C | 17494 | 503 | 2.875272% |
| D | 17494 | 662 | 3.784155% |
Noise dominated data is calculated using 1-second bins in cleaned event files. If a bin has >2000 counts, and if more than 50% of those come from <1% of pixels, then it is considered to be noise-dominated and hence unusable.
| Quadrant | # 1 sec bins | Bins with >0 counts | Bins with >2000 counts | High rate bins dominated by noise | Noise dominated (total time) | Noise dominated (detector-on time) | Marked lightcurve |
|---|---|---|---|---|---|---|---|
| A | 25234 | 17498 | 11 | 11 | 0.04% | 0.06% | 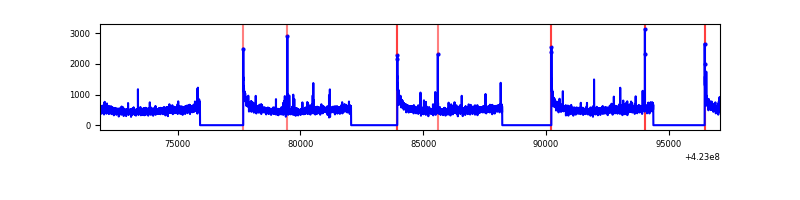 |
| B | 25234 | 17498 | 5 | 5 | 0.02% | 0.03% | 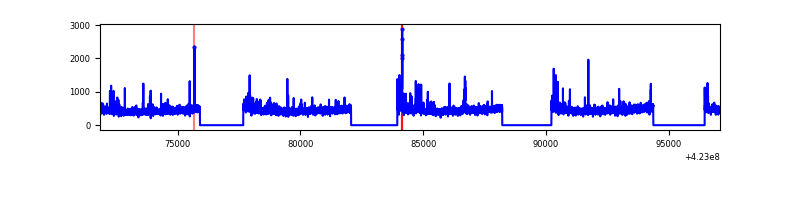 |
| C | 25234 | 17498 | 495 | 495 | 1.96% | 2.83% | 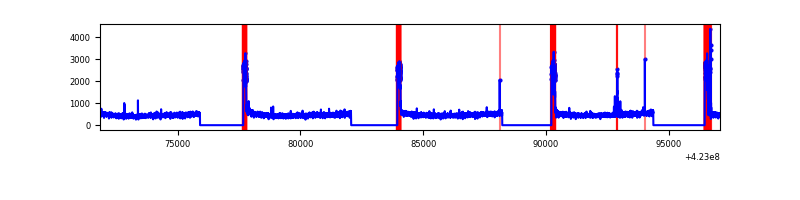 |
| D | 25234 | 17498 | 592 | 592 | 2.35% | 3.38% | 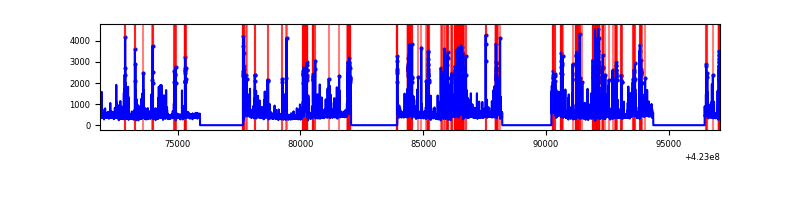 |
Top three noisy pixels from each quadrant. If the there are fewer than three noisy pixels in the level2.evt file, extra rows are filled as -1
| Pixel properties | Quadrant properties | ||||||
|---|---|---|---|---|---|---|---|
| Quadrant | DetID | PixID | Counts | Sigma | Mean | Median | Sigma |
| A | 10 | 83 | 1434435 | 3646.16 | 1941 | 1905 | 392.9 |
| A | 2 | 79 | 90566 | 225.67 | 1941 | 1905 | 392.9 |
| A | 13 | 248 | 51976 | 127.44 | 1941 | 1905 | 392.9 |
| B | 0 | 190 | 307228 | 824.7 | 1945 | 1892 | 370.2 |
| B | 12 | 111 | 47628 | 123.53 | 1945 | 1892 | 370.2 |
| B | 11 | 111 | 43717 | 112.97 | 1945 | 1892 | 370.2 |
| C | 0 | 10 | 1374529 | 3168.53 | 1865 | 1878 | 433.2 |
| C | 15 | 214 | 709113 | 1632.53 | 1865 | 1878 | 433.2 |
| C | 9 | 54 | 83119 | 187.53 | 1865 | 1878 | 433.2 |
| D | 13 | 249 | 1772203 | 3922.38 | 1855 | 1804 | 451.4 |
| D | 1 | 47 | 887519 | 1962.33 | 1855 | 1804 | 451.4 |
| D | 12 | 233 | 511730 | 1129.76 | 1855 | 1804 | 451.4 |
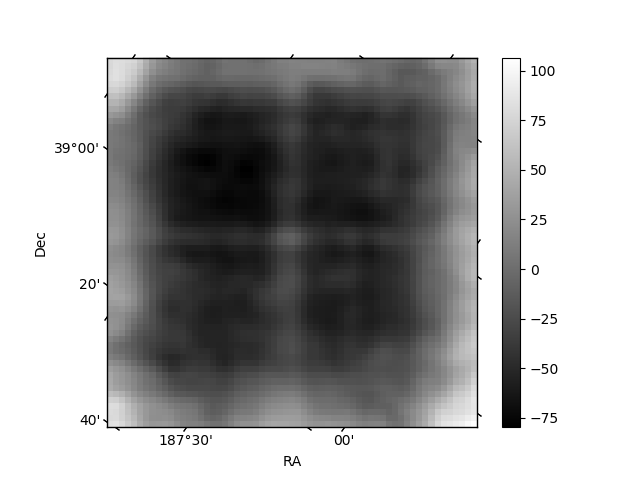
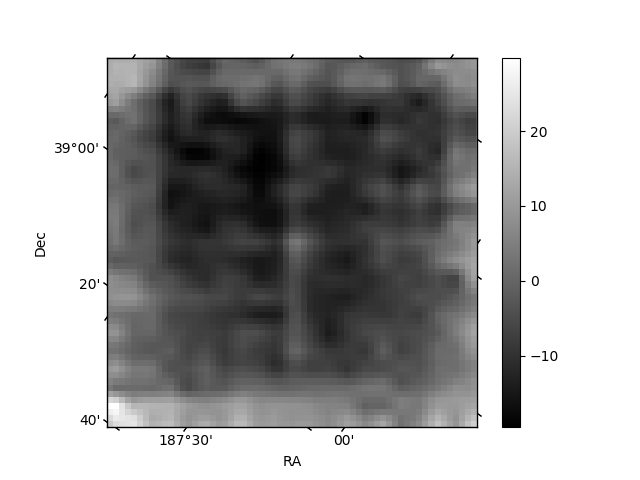
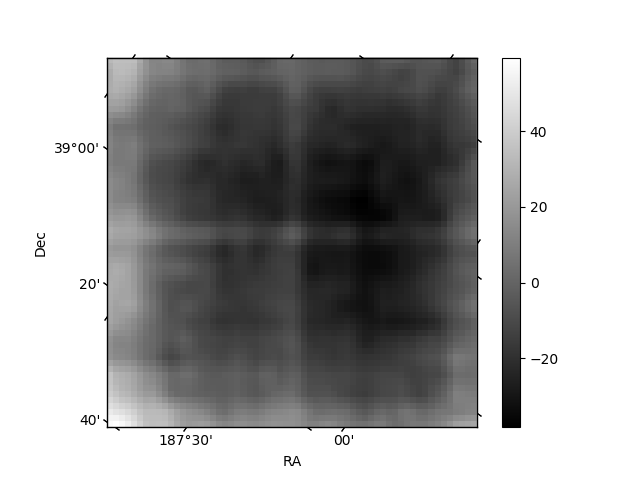
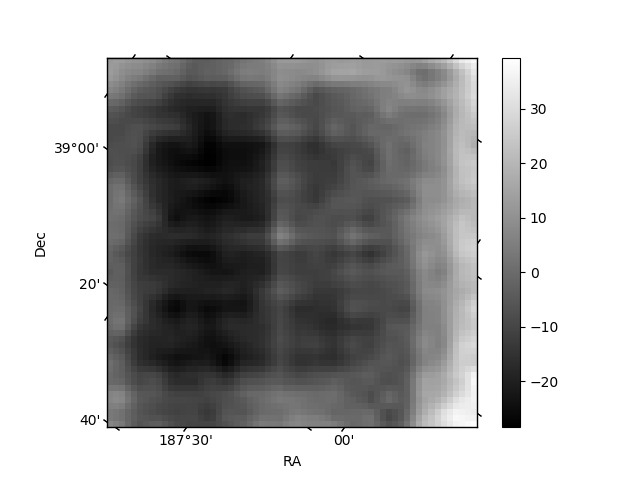
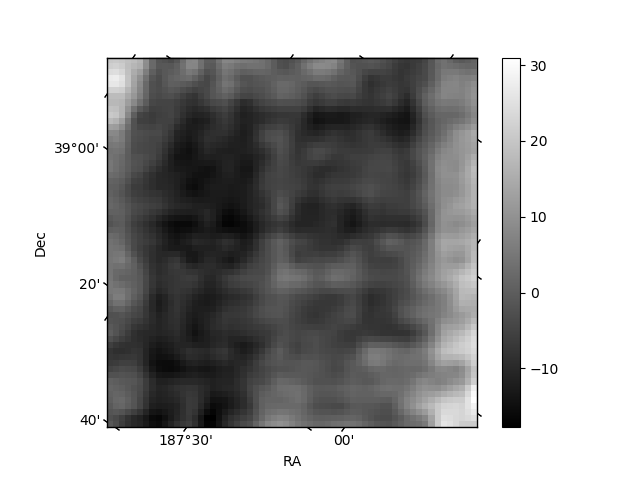
Histogram calculated using DETX and DETY for each event in the final _common_clean file
| Quadrant A | 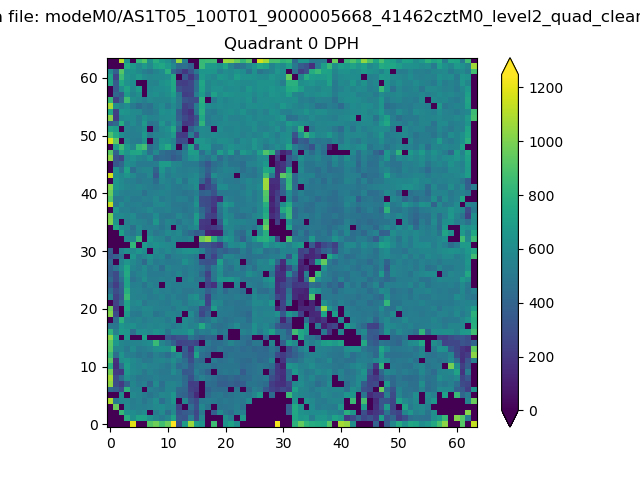 |
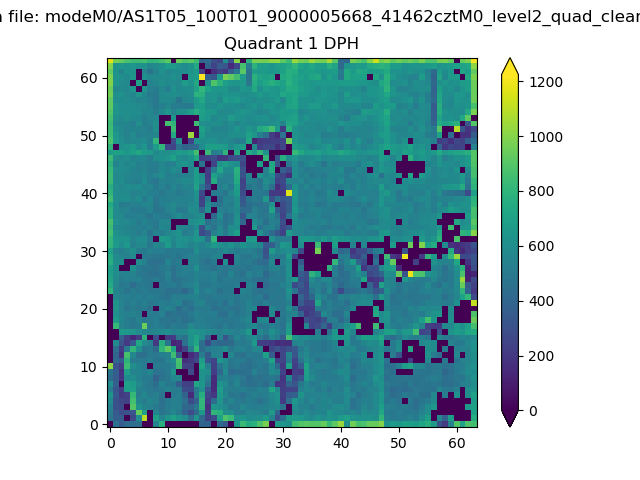 |
Quadrant B |
|---|---|---|---|
| Quadrant D | 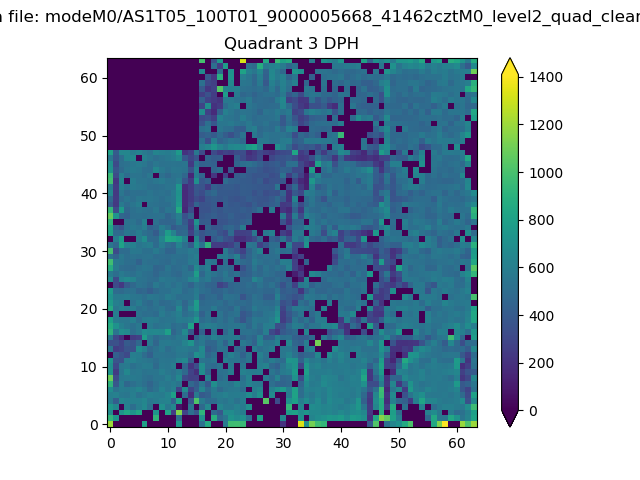 |
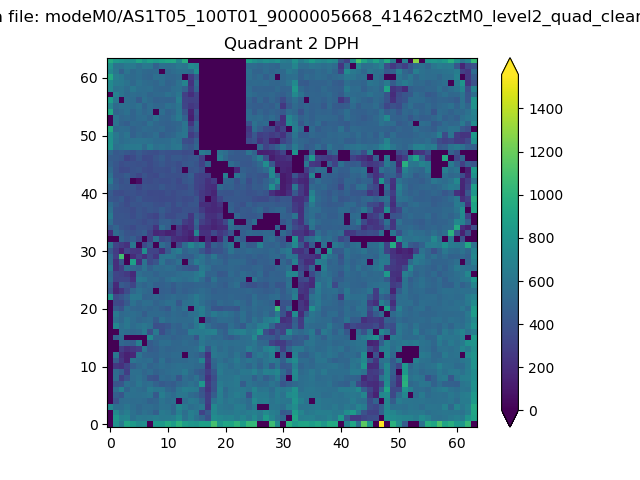 |
Quadrant C |
| Plot type | Count rate plots | Images |
|---|---|---|
| Comparison with Poisson distribution Blue bars denote a histogram of data divided into 1 sec bins. Red curve is a Poisson curve with rate = median count rate of data. |
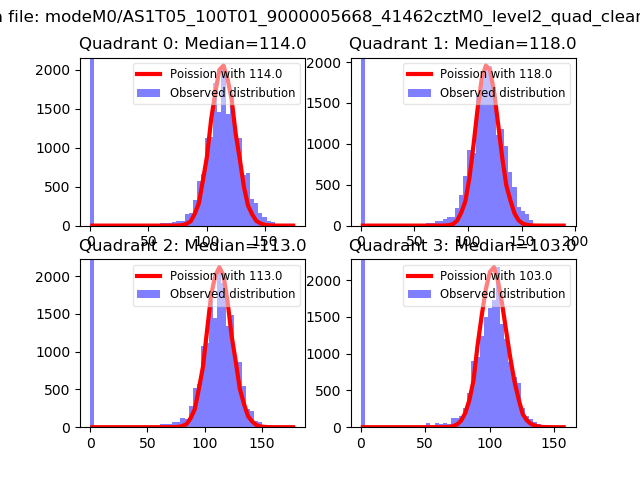 |
 |
| Quadrant-wise count rates Data is divided into 100 sec bins |
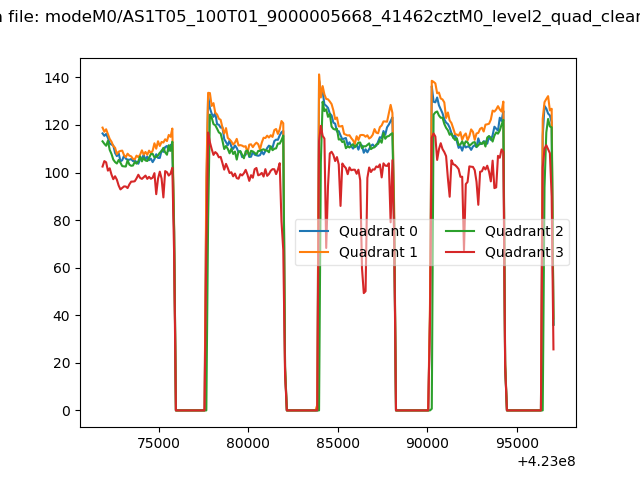 |
|
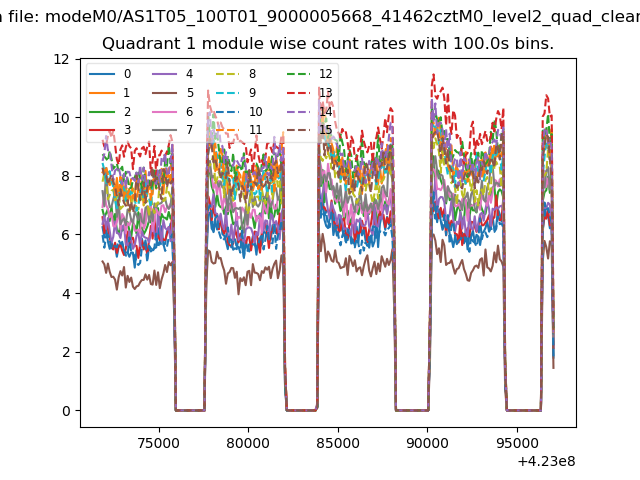
| Module-wise count rates for Quadrant A Data is divided into 100 sec bins |
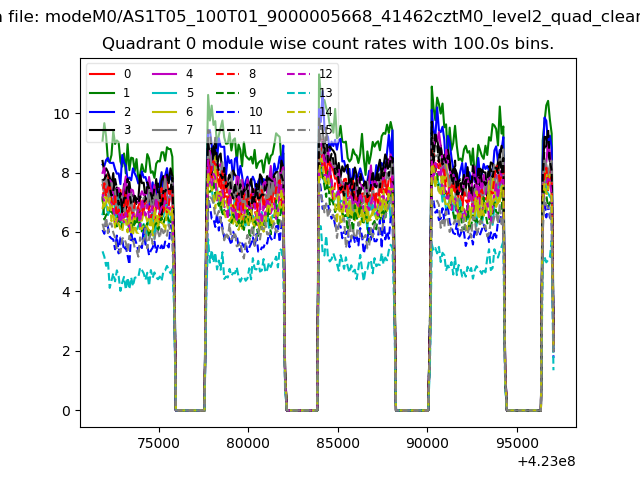 |
 |
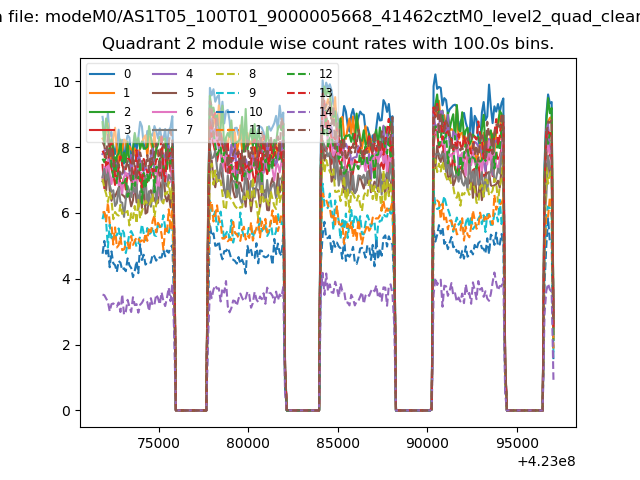
| Module-wise count rates for Quadrant B Data is divided into 100 sec bins |
 |
 |
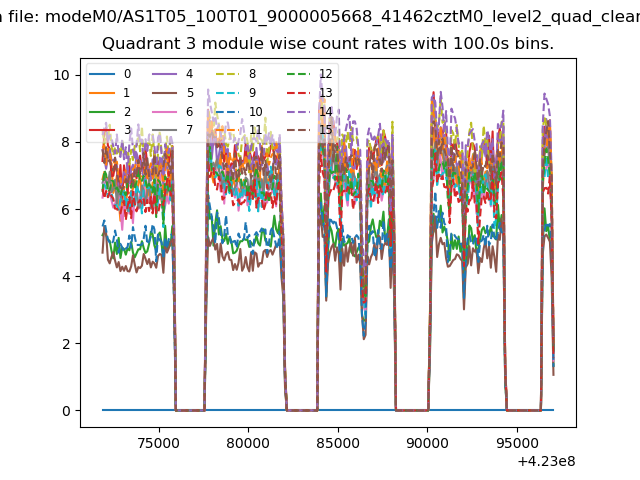
| Module-wise count rates for Quadrant C Data is divided into 100 sec bins |
 |
 |
| Module-wise count rates for Quadrant D Data is divided into 100 sec bins |
 |
 |
| Parameter | Plot |
|---|---|
| CZT HV Monitor | 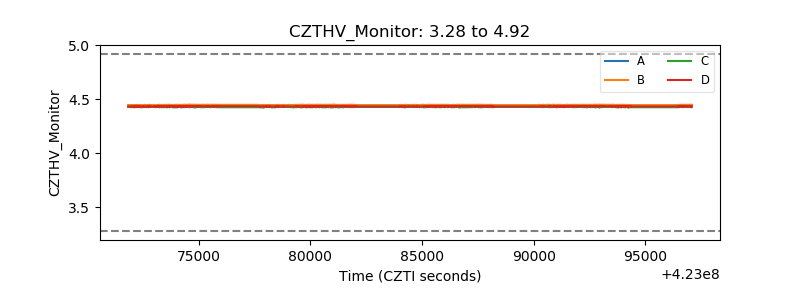 |
| D_VDD | 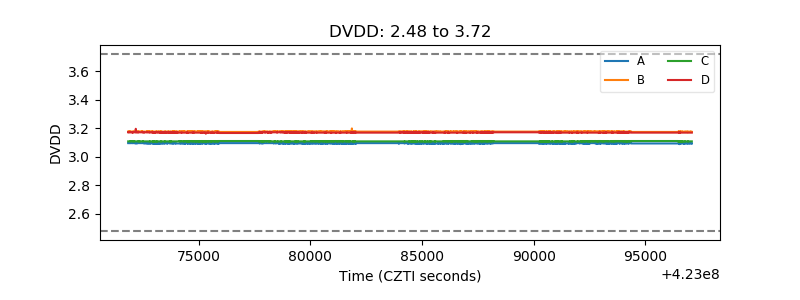 |
| Temperature 1 | 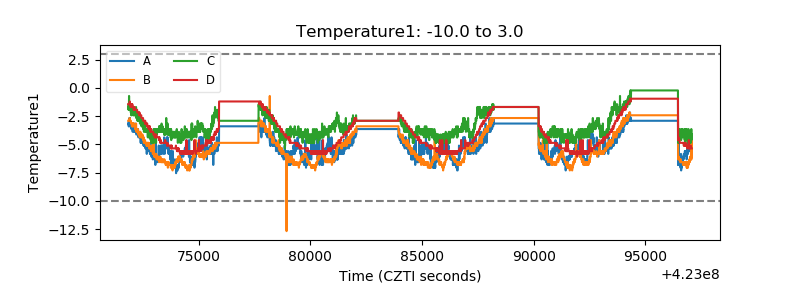 |
| Veto HV Monitor | 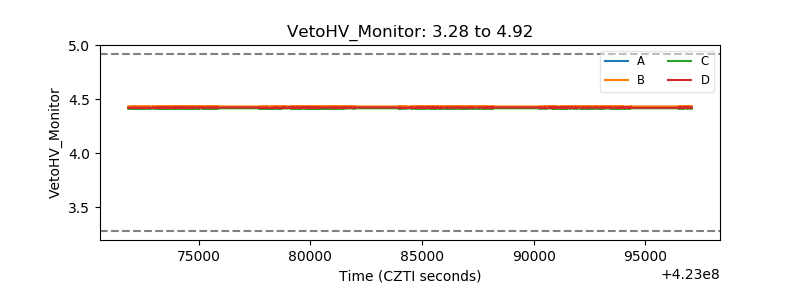 |
| Veto LLD | 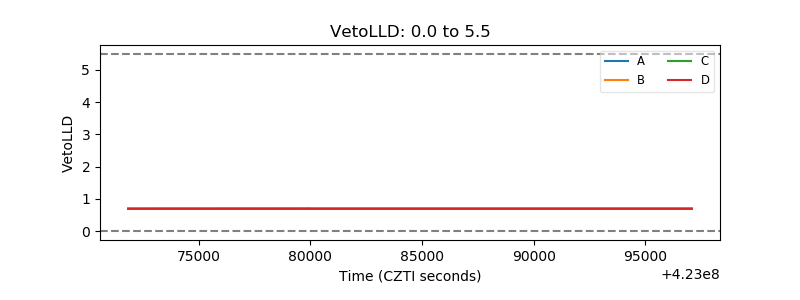 |
| Alpha Counter | 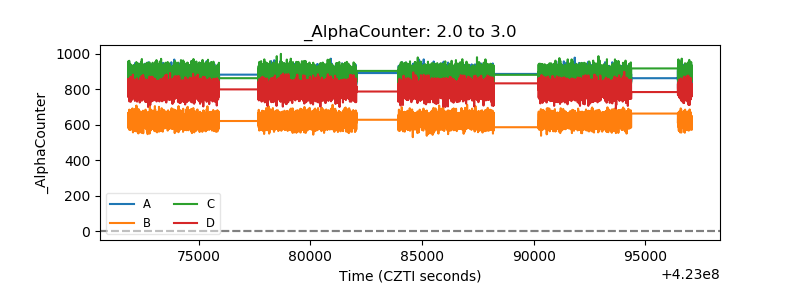 |
| _CPM_Rate | 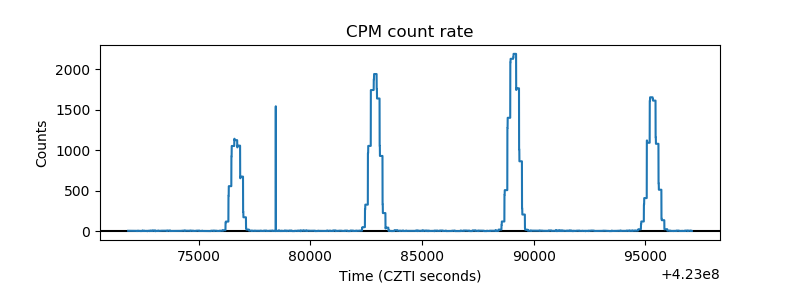 |
| CZT Counter | 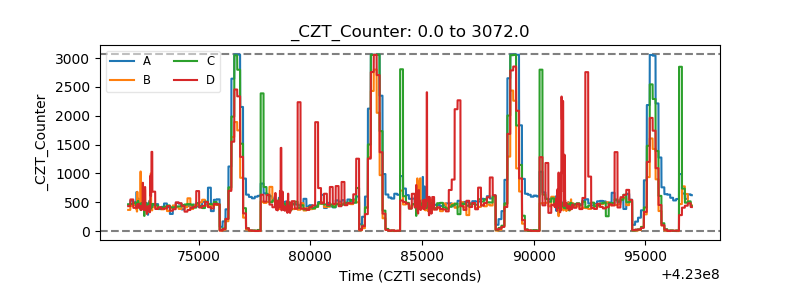 |
| +2.5 Volts monitor | 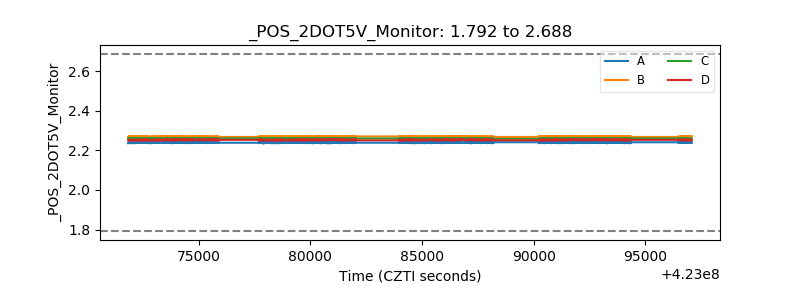 |
| +5 Volts monitor | 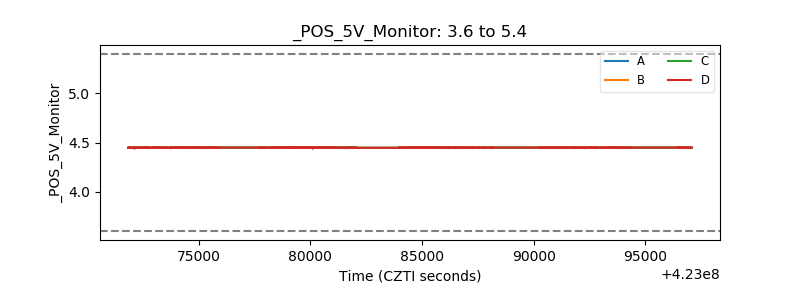 |
| _ROLL_ROT | 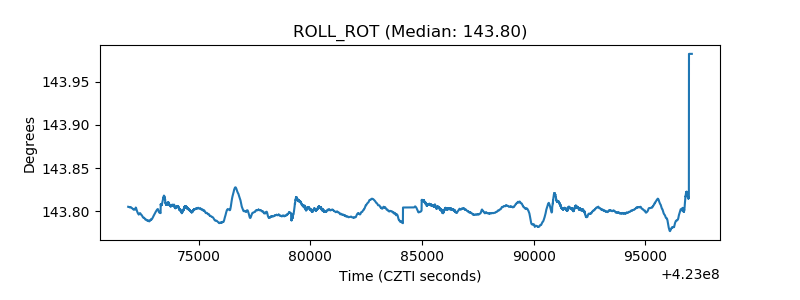 |
| _Roll_DEC | 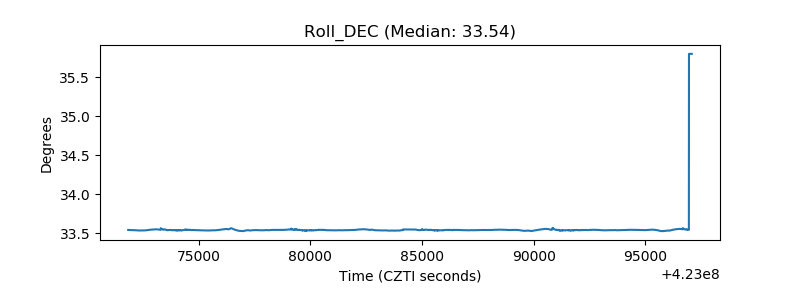 |
| _Roll_RA | 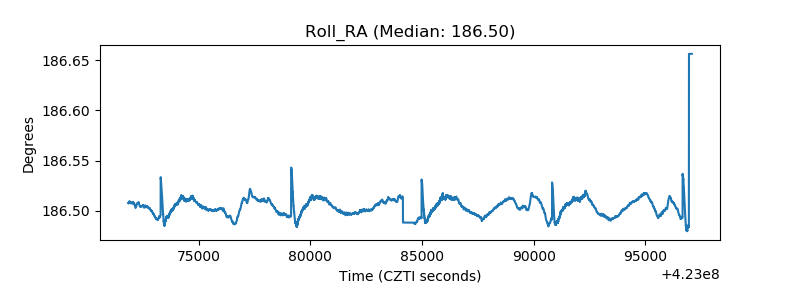 |
| Veto Counter | 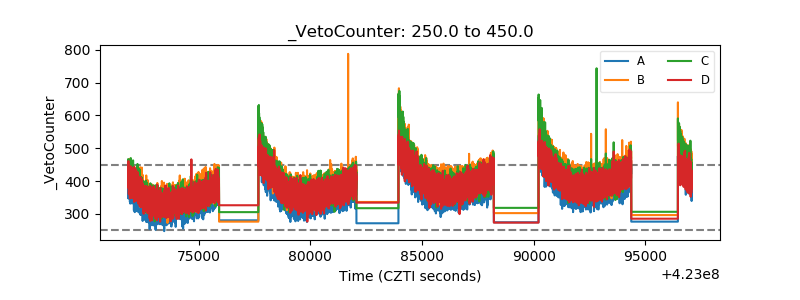 |