| Param | Original file | Final file |
|---|---|---|
| Filename | modeM0/AS1C06_010T05_9000005670_41461cztM0_level2.fits | modeM0/AS1C06_010T05_9000005670_41461cztM0_level2_quad_clean.evt |
| Size (bytes) | 207,737,280 | 60,361,920 |
| Size | 198.1 MB | 57.6 MB |
| Events in quadrant A | 1,850,480 | 406,640 |
| Events in quadrant B | 1,618,365 | 421,573 |
| Events in quadrant C | 1,922,189 | 387,763 |
| Events in quadrant D | 2,018,156 | 358,798 |
| Mode M9 | |||
|---|---|---|---|
| Quadrant | BADHDUFLAG | Total packets | Discarded packets |
| A | 0 | 22 | 0 |
| B | 0 | 22 | 0 |
| C | 0 | 22 | 0 |
| D | 0 | 22 | 0 |
| Mode SS | |||
|---|---|---|---|
| Quadrant | BADHDUFLAG | Total packets | Discarded packets |
| A | 0 | 72 | 0 |
| B | 0 | 72 | 0 |
| C | 0 | 72 | 0 |
| D | 0 | 72 | 0 |
| Mode M0 | |||
|---|---|---|---|
| Quadrant | BADHDUFLAG | Total packets | Discarded packets |
| A | 0 | 7707 | 2 |
| B | 0 | 7363 | 1 |
| C | 0 | 8084 | 1 |
| D | 0 | 8701 | 1 |
| Quadrant | Total seconds | Saturated seconds | Saturation percentage |
|---|---|---|---|
| A | 3580 | 7 | 0.195531% |
| B | 3580 | 2 | 0.055866% |
| C | 3580 | 123 | 3.435754% |
| D | 3580 | 120 | 3.351955% |
Noise dominated data is calculated using 1-second bins in cleaned event files. If a bin has >2000 counts, and if more than 50% of those come from <1% of pixels, then it is considered to be noise-dominated and hence unusable.
| Quadrant | # 1 sec bins | Bins with >0 counts | Bins with >2000 counts | High rate bins dominated by noise | Noise dominated (total time) | Noise dominated (detector-on time) | Marked lightcurve |
|---|---|---|---|---|---|---|---|
| A | 5703 | 3581 | 1 | 1 | 0.02% | 0.03% | 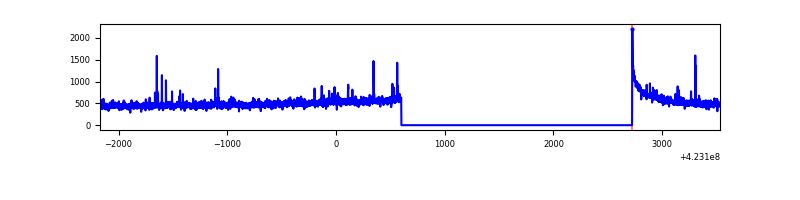 |
| B | 5703 | 3581 | 1 | 1 | 0.02% | 0.03% | 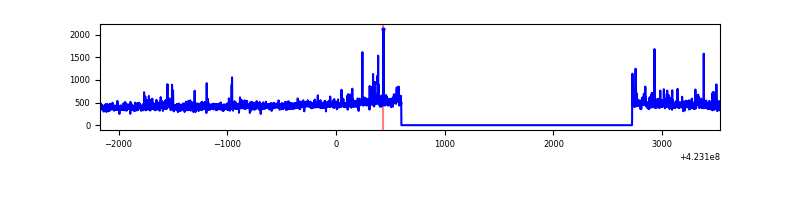 |
| C | 5703 | 3581 | 121 | 121 | 2.12% | 3.38% | 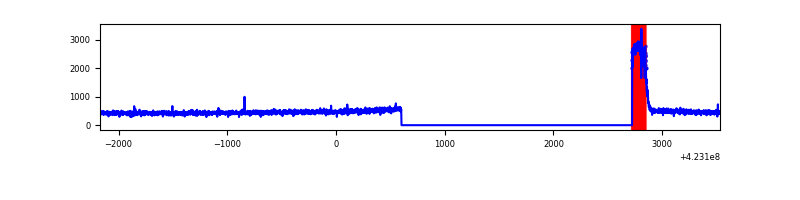 |
| D | 5703 | 3581 | 97 | 97 | 1.70% | 2.71% | 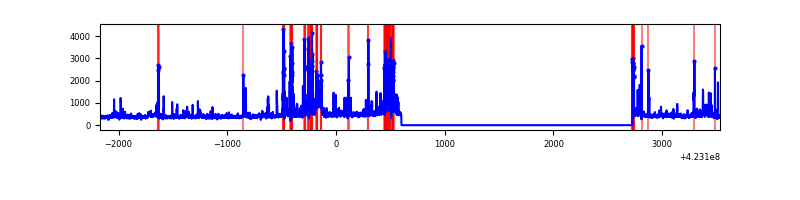 |
Top three noisy pixels from each quadrant. If the there are fewer than three noisy pixels in the level2.evt file, extra rows are filled as -1
| Pixel properties | Quadrant properties | ||||||
|---|---|---|---|---|---|---|---|
| Quadrant | DetID | PixID | Counts | Sigma | Mean | Median | Sigma |
| A | 10 | 83 | 314153 | 3943.24 | 385 | 378 | 79.6 |
| A | 2 | 79 | 26657 | 330.25 | 385 | 378 | 79.6 |
| A | 13 | 248 | 17313 | 212.82 | 385 | 378 | 79.6 |
| B | 0 | 190 | 84547 | 1132.78 | 385 | 374 | 74.3 |
| B | 5 | 255 | 11435 | 148.86 | 385 | 374 | 74.3 |
| B | 12 | 111 | 9356 | 120.88 | 385 | 374 | 74.3 |
| C | 0 | 10 | 358814 | 4229.29 | 363 | 366 | 84.8 |
| C | 15 | 214 | 144965 | 1706.11 | 363 | 366 | 84.8 |
| C | 13 | 61 | 2593 | 26.28 | 363 | 366 | 84.8 |
| D | 5 | 222 | 200171 | 2246.81 | 364 | 354 | 88.9 |
| D | 12 | 233 | 137002 | 1536.52 | 364 | 354 | 88.9 |
| D | 1 | 47 | 115089 | 1290.12 | 364 | 354 | 88.9 |
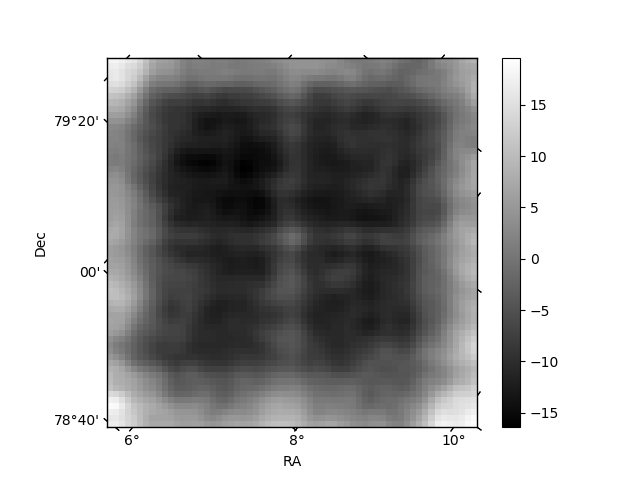
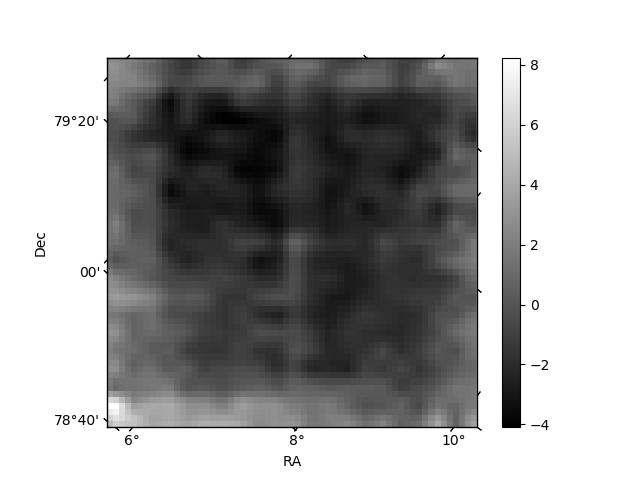
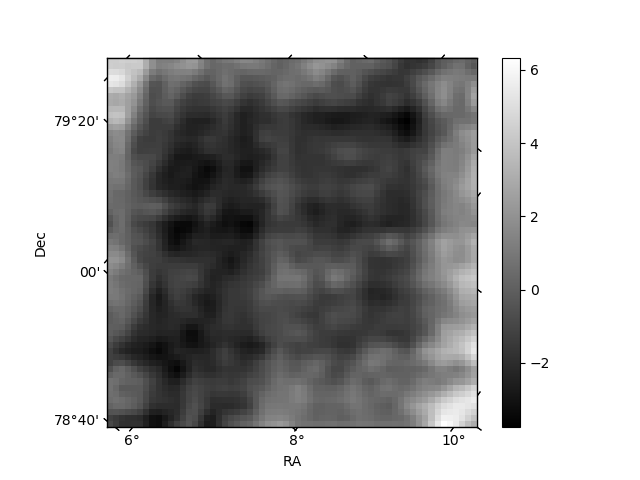
Histogram calculated using DETX and DETY for each event in the final _common_clean file
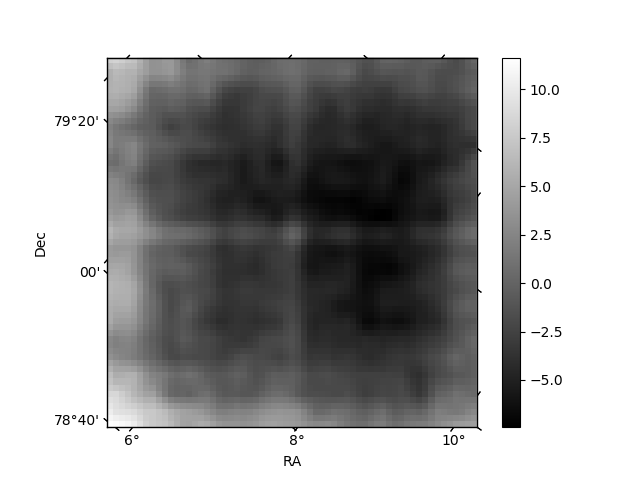
| Quadrant A | 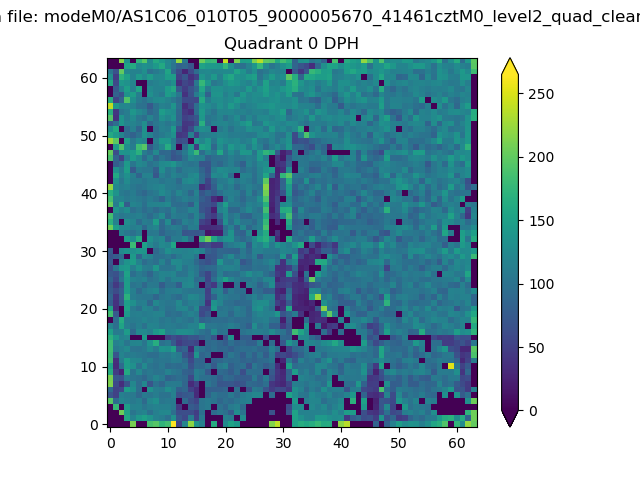 |
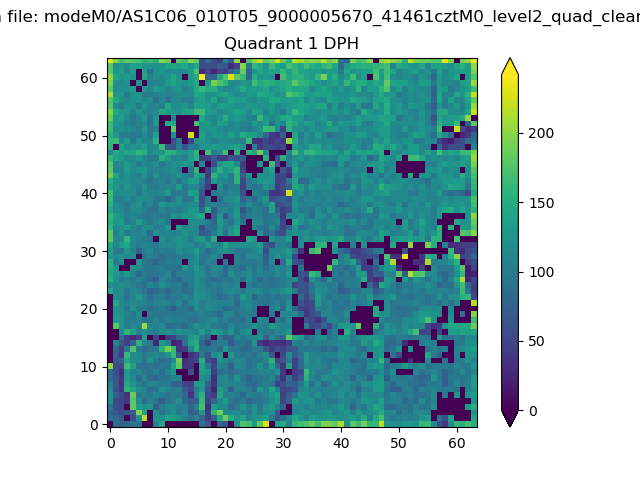 |
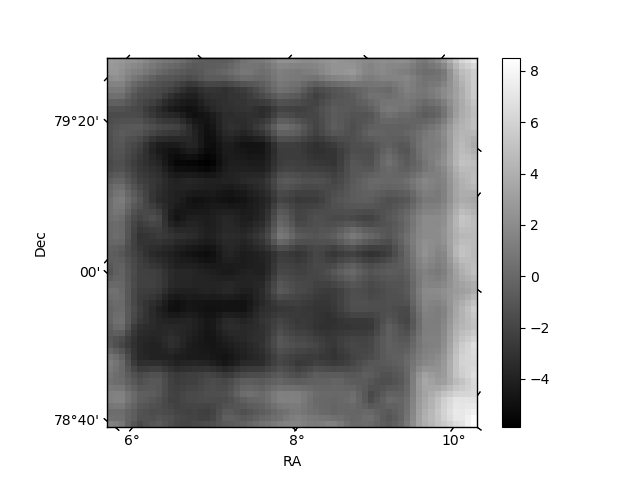
Quadrant B |
|---|---|---|---|
| Quadrant D | 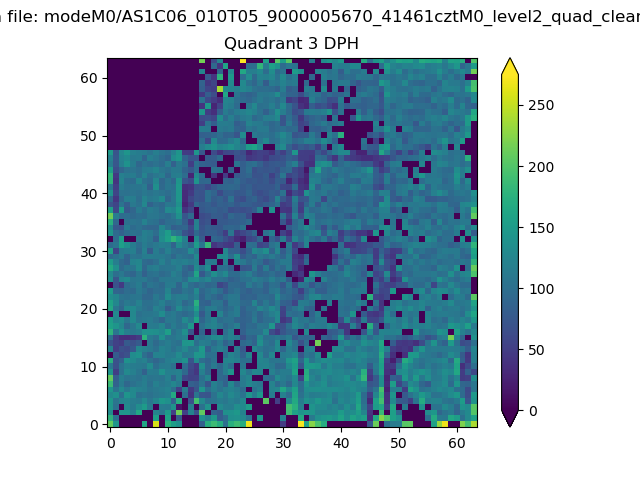 |
 |
Quadrant C |
| Plot type | Count rate plots | Images |
|---|---|---|
| Comparison with Poisson distribution Blue bars denote a histogram of data divided into 1 sec bins. Red curve is a Poisson curve with rate = median count rate of data. |
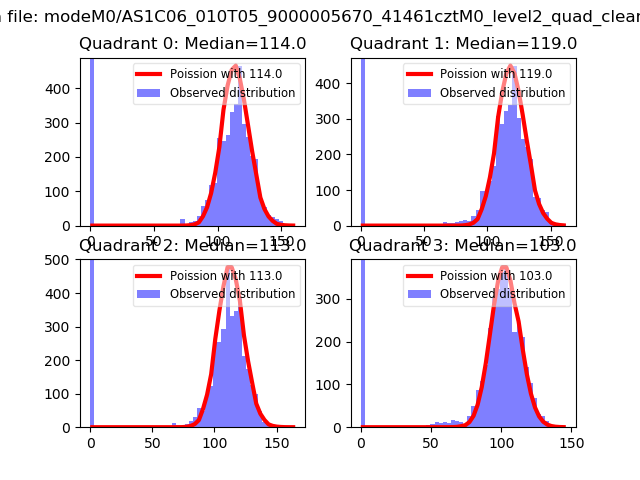 |
 |
| Quadrant-wise count rates Data is divided into 100 sec bins |
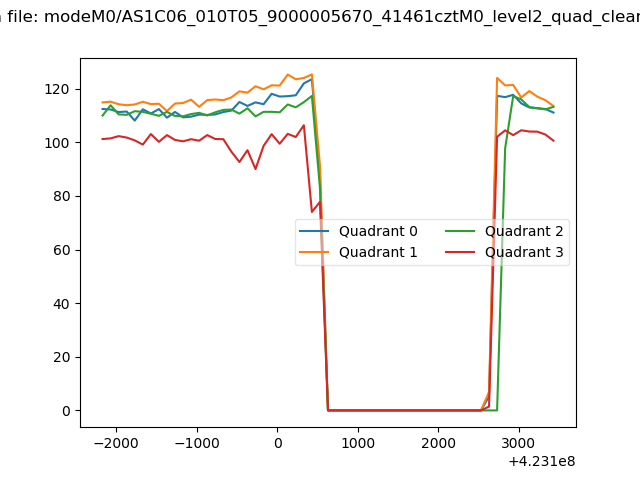 |
|
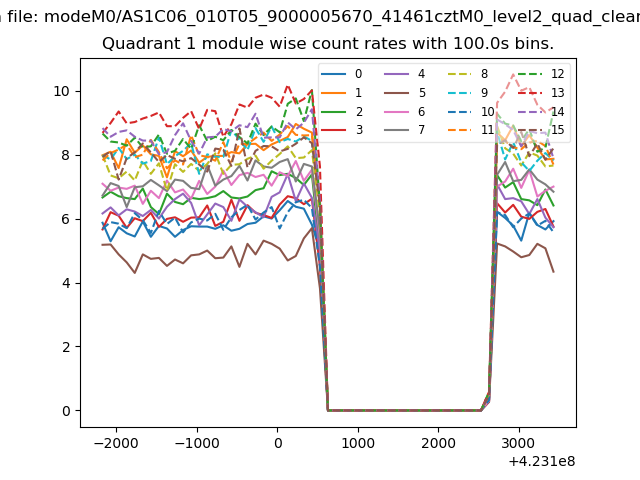
| Module-wise count rates for Quadrant A Data is divided into 100 sec bins |
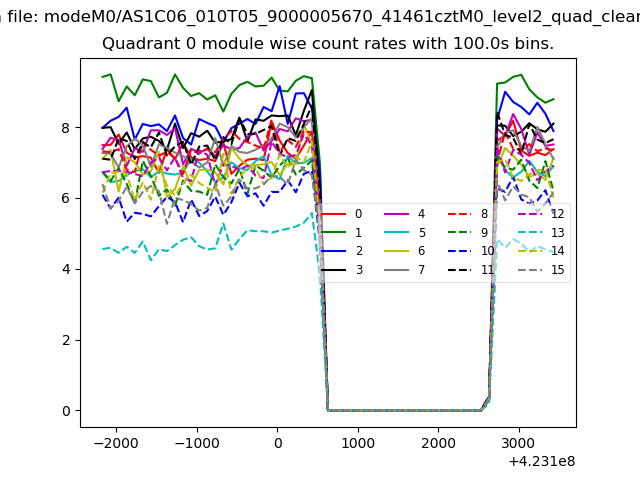 |
 |
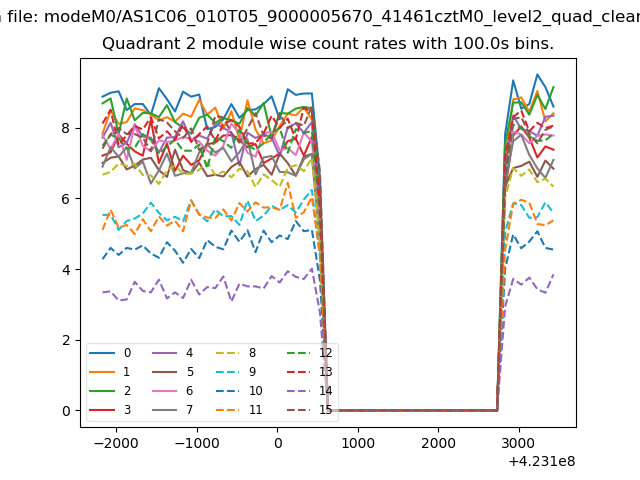
| Module-wise count rates for Quadrant B Data is divided into 100 sec bins |
 |
 |
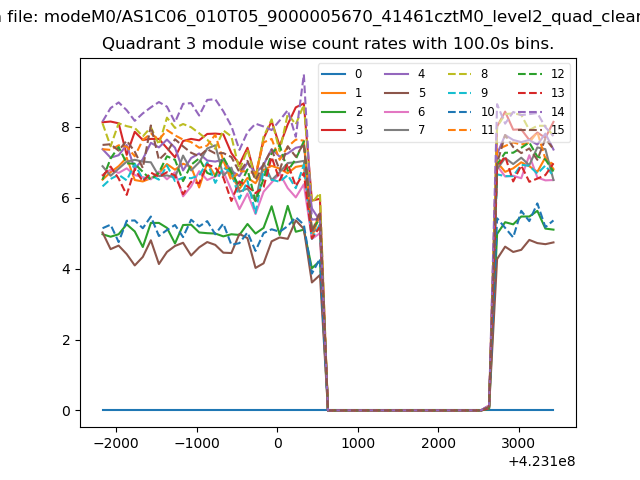
| Module-wise count rates for Quadrant C Data is divided into 100 sec bins |
 |
 |
| Module-wise count rates for Quadrant D Data is divided into 100 sec bins |
 |
 |
| Parameter | Plot |
|---|---|
| CZT HV Monitor | 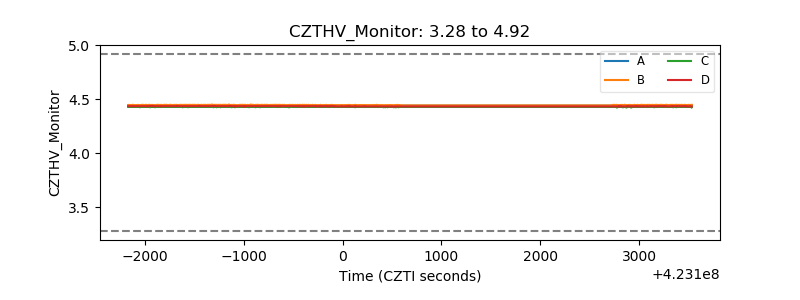 |
| D_VDD | 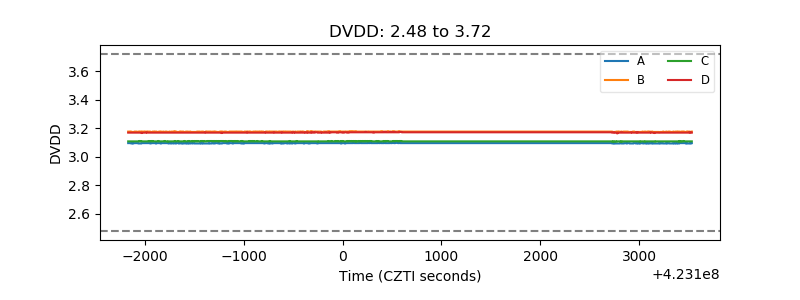 |
| Temperature 1 | 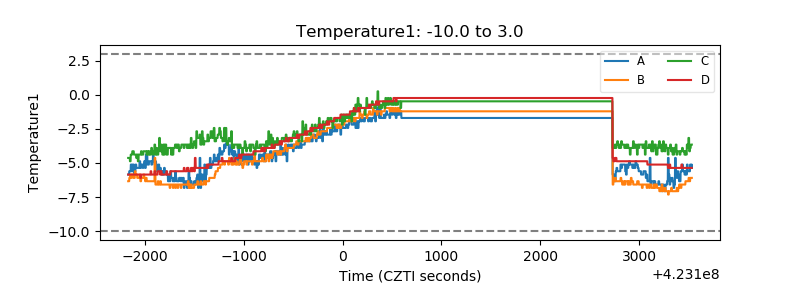 |
| Veto HV Monitor | 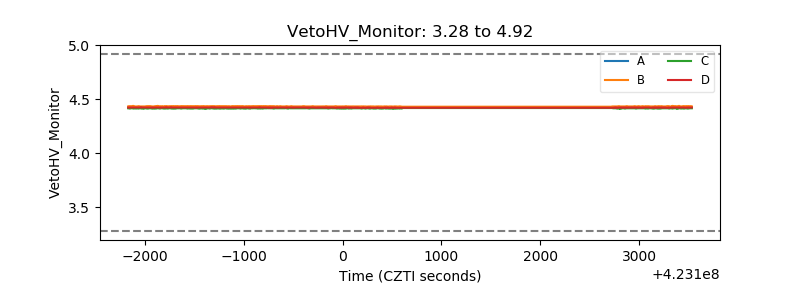 |
| Veto LLD | 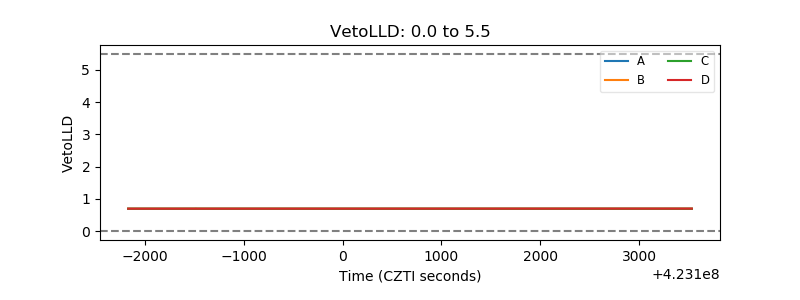 |
| Alpha Counter | 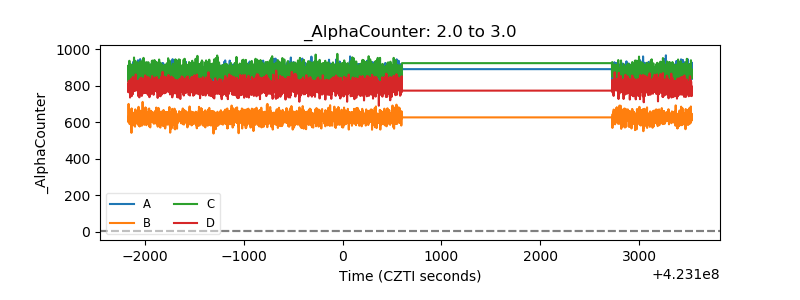 |
| _CPM_Rate | 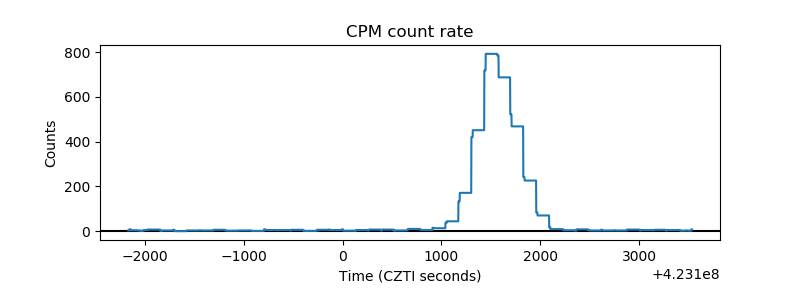 |
| CZT Counter | 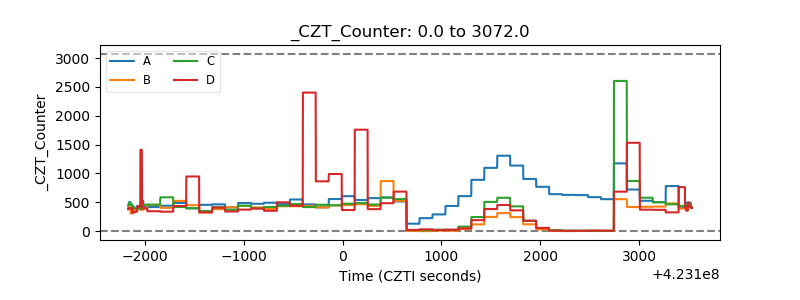 |
| +2.5 Volts monitor | 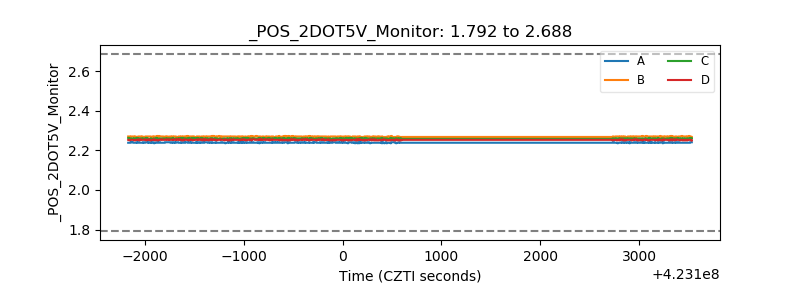 |
| +5 Volts monitor |  |
| _ROLL_ROT | 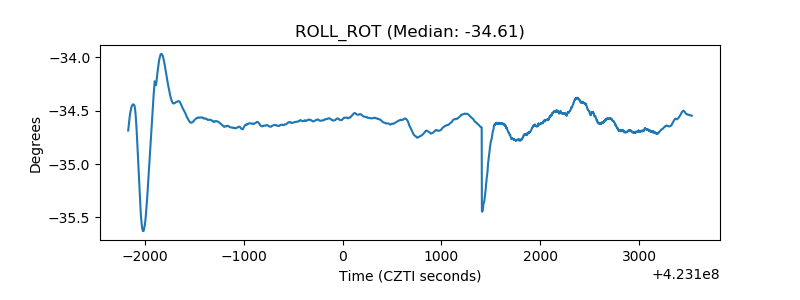 |
| _Roll_DEC | 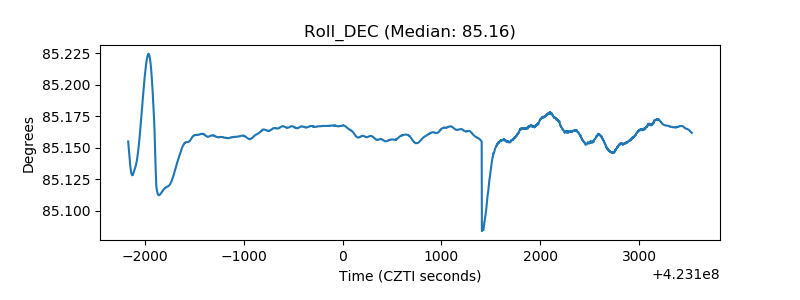 |
| _Roll_RA | 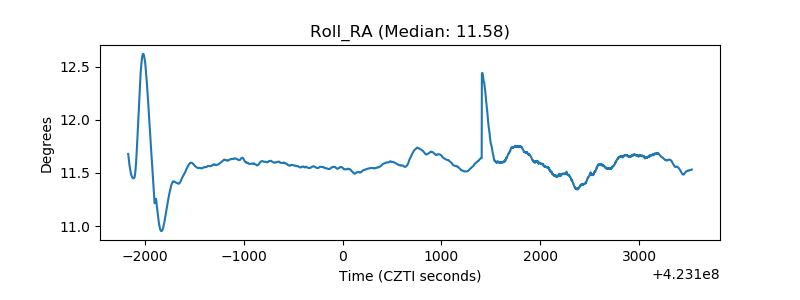 |
| Veto Counter | 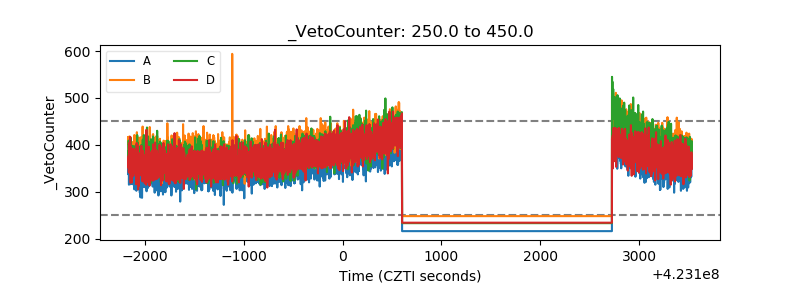 |