| Param | Original file | Final file |
|---|---|---|
| Filename | modeM0/AS1C06_010T05_9000005670_41462cztM0_level2.fits | modeM0/AS1C06_010T05_9000005670_41462cztM0_level2_quad_clean.evt |
| Size (bytes) | 466,453,440 | 134,533,440 |
| Size | 444.8 MB | 128.3 MB |
| Events in quadrant A | 4,168,253 | 902,252 |
| Events in quadrant B | 3,702,294 | 934,973 |
| Events in quadrant C | 4,253,246 | 868,218 |
| Events in quadrant D | 4,508,841 | 802,451 |
| Mode M9 | |||
|---|---|---|---|
| Quadrant | BADHDUFLAG | Total packets | Discarded packets |
| A | 0 | 43 | 0 |
| B | 0 | 43 | 0 |
| C | 0 | 43 | 0 |
| D | 0 | 43 | 0 |
| Mode SS | |||
|---|---|---|---|
| Quadrant | BADHDUFLAG | Total packets | Discarded packets |
| A | 0 | 164 | 0 |
| B | 0 | 164 | 0 |
| C | 0 | 164 | 0 |
| D | 0 | 164 | 0 |
| Mode M0 | |||
|---|---|---|---|
| Quadrant | BADHDUFLAG | Total packets | Discarded packets |
| A | 0 | 17489 | 3 |
| B | 0 | 16982 | 4 |
| C | 0 | 18211 | 2 |
| D | 0 | 19519 | 2 |
| Quadrant | Total seconds | Saturated seconds | Saturation percentage |
|---|---|---|---|
| A | 8152 | 17 | 0.208538% |
| B | 8151 | 14 | 0.171758% |
| C | 8152 | 250 | 3.066732% |
| D | 8152 | 184 | 2.257115% |
Noise dominated data is calculated using 1-second bins in cleaned event files. If a bin has >2000 counts, and if more than 50% of those come from <1% of pixels, then it is considered to be noise-dominated and hence unusable.
| Quadrant | # 1 sec bins | Bins with >0 counts | Bins with >2000 counts | High rate bins dominated by noise | Noise dominated (total time) | Noise dominated (detector-on time) | Marked lightcurve |
|---|---|---|---|---|---|---|---|
| A | 12368 | 8154 | 6 | 6 | 0.05% | 0.07% | 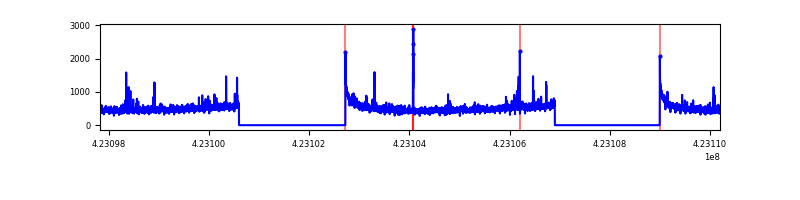 |
| B | 12368 | 8154 | 4 | 4 | 0.03% | 0.05% | 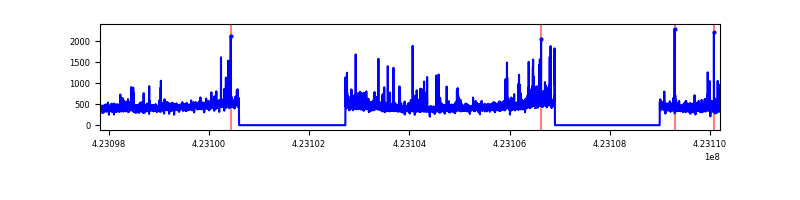 |
| C | 12368 | 8154 | 242 | 242 | 1.96% | 2.97% | 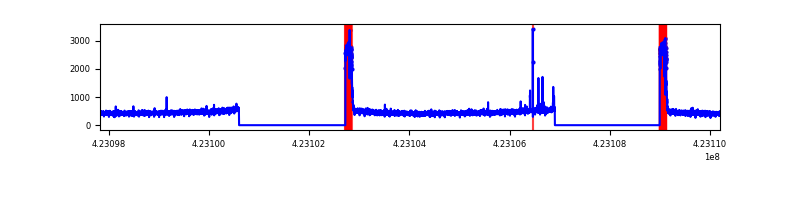 |
| D | 12368 | 8154 | 155 | 155 | 1.25% | 1.90% | 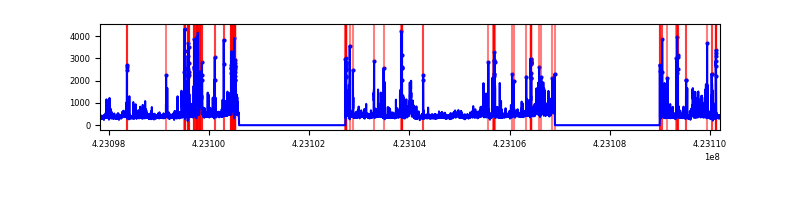 |
Top three noisy pixels from each quadrant. If the there are fewer than three noisy pixels in the level2.evt file, extra rows are filled as -1
| Pixel properties | Quadrant properties | ||||||
|---|---|---|---|---|---|---|---|
| Quadrant | DetID | PixID | Counts | Sigma | Mean | Median | Sigma |
| A | 10 | 83 | 699030 | 3969.79 | 864 | 847 | 175.9 |
| A | 2 | 79 | 76463 | 429.94 | 864 | 847 | 175.9 |
| A | 13 | 248 | 48280 | 269.7 | 864 | 847 | 175.9 |
| B | 0 | 190 | 223500 | 1365.94 | 862 | 837 | 163.0 |
| B | 5 | 255 | 67051 | 406.19 | 862 | 837 | 163.0 |
| B | 12 | 111 | 20710 | 121.91 | 862 | 837 | 163.0 |
| C | 0 | 10 | 711121 | 3773.18 | 817 | 821 | 188.2 |
| C | 15 | 214 | 330762 | 1752.68 | 817 | 821 | 188.2 |
| C | 12 | 249 | 24899 | 127.9 | 817 | 821 | 188.2 |
| D | 1 | 47 | 359772 | 1808.5 | 821 | 799 | 198.5 |
| D | 5 | 222 | 316141 | 1588.68 | 821 | 799 | 198.5 |
| D | 12 | 233 | 179910 | 902.36 | 821 | 799 | 198.5 |
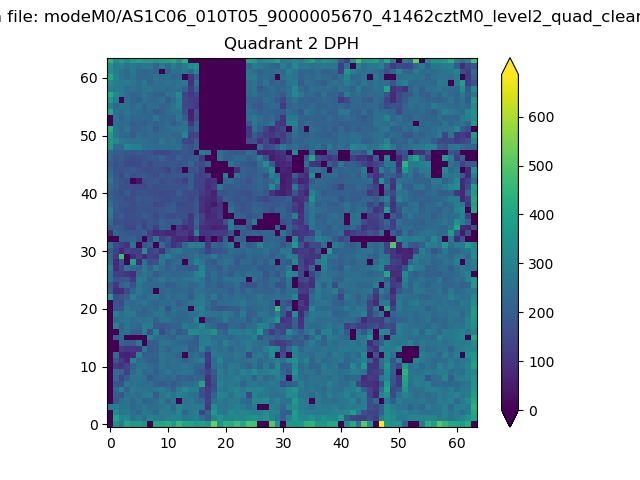
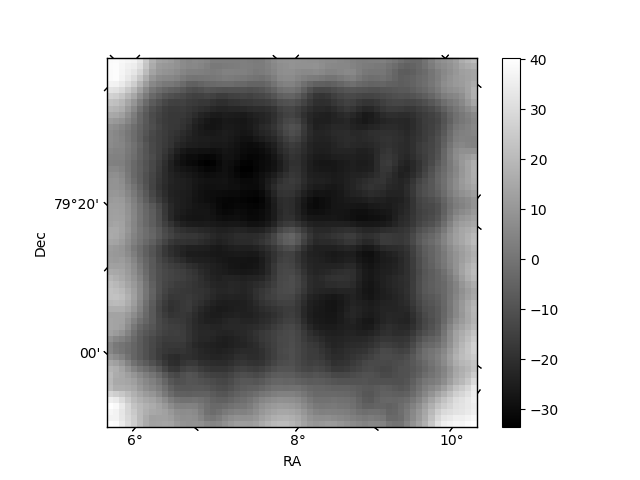
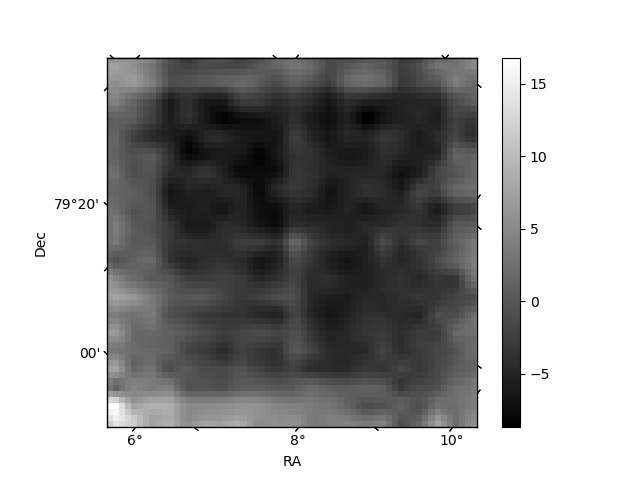
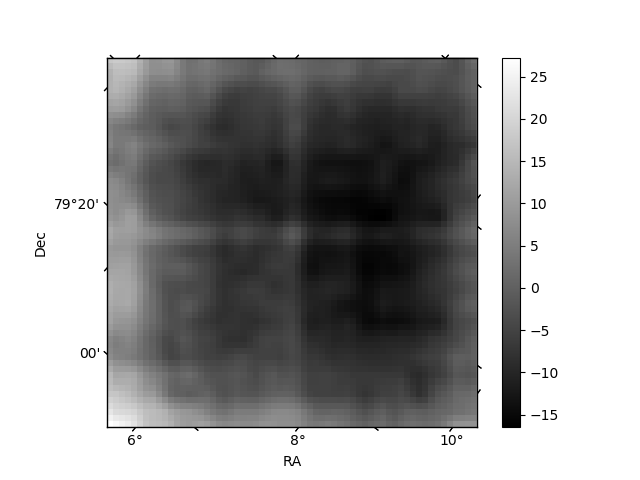
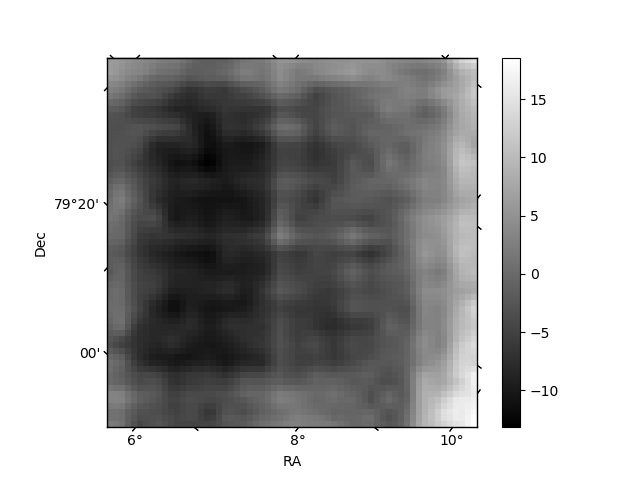
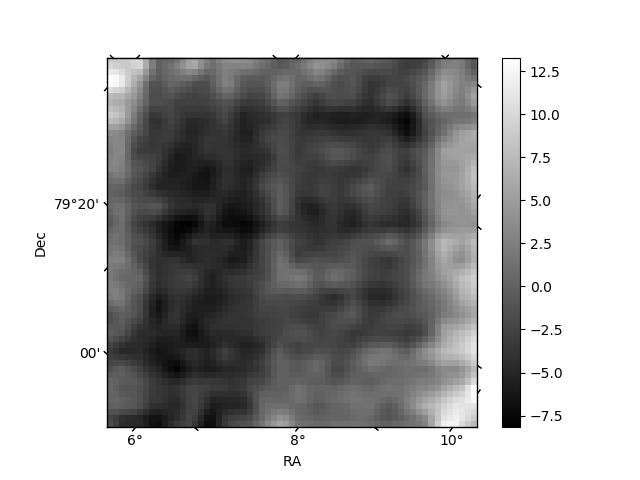
Histogram calculated using DETX and DETY for each event in the final _common_clean file
| Quadrant A | 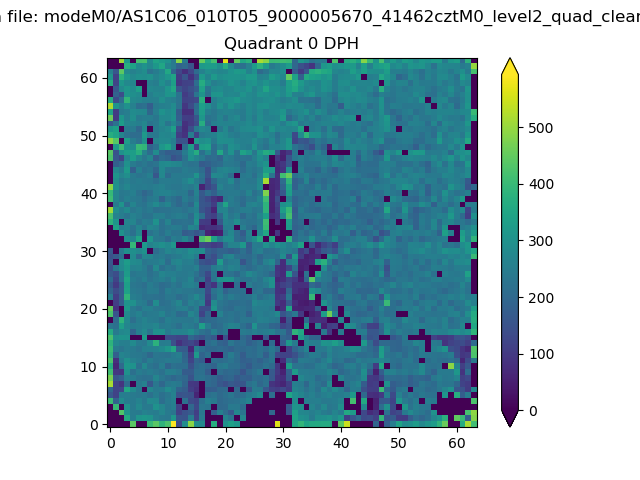 |
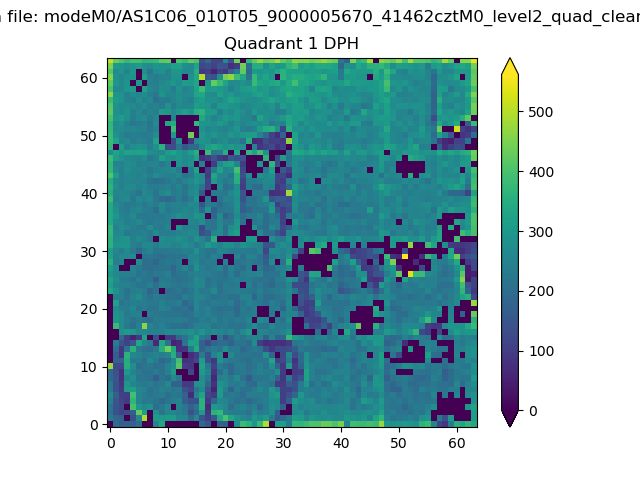 |
Quadrant B |
|---|---|---|---|
| Quadrant D | 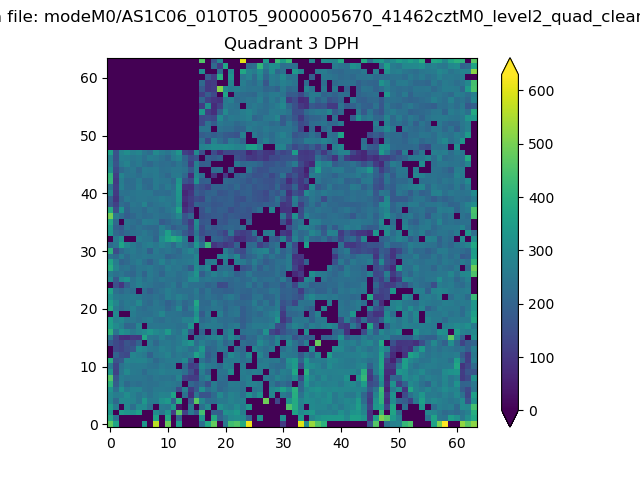 |
 |
Quadrant C |
| Plot type | Count rate plots | Images |
|---|---|---|
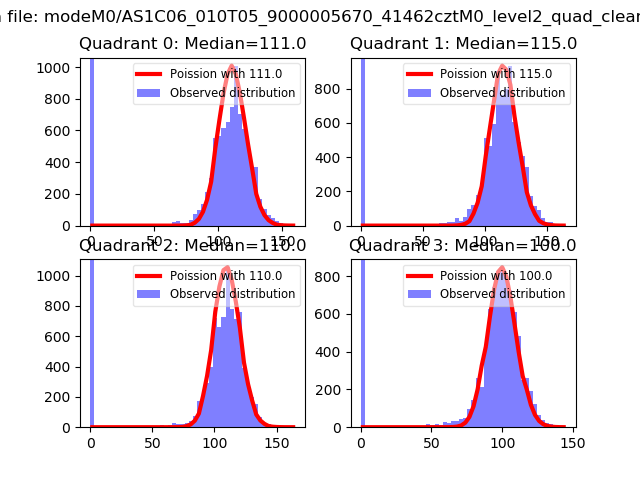
| Comparison with Poisson distribution Blue bars denote a histogram of data divided into 1 sec bins. Red curve is a Poisson curve with rate = median count rate of data. |
 |
 |
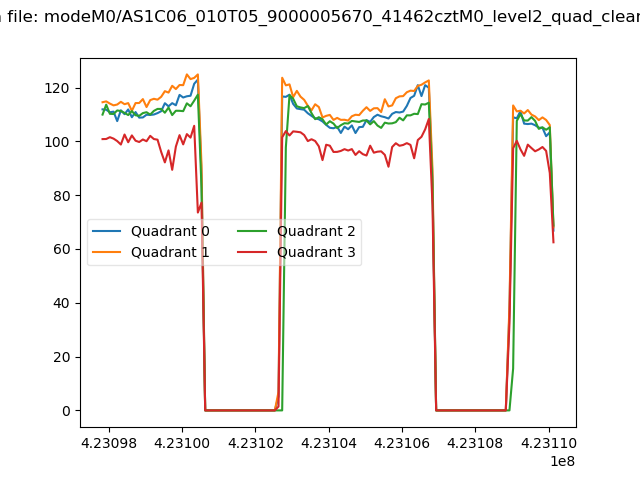
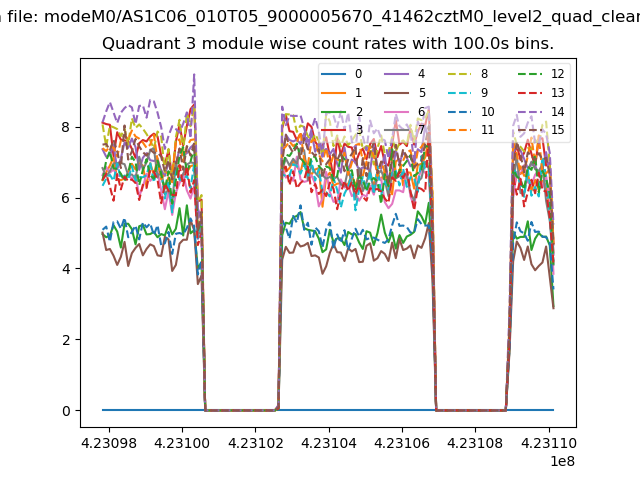
| Quadrant-wise count rates Data is divided into 100 sec bins |
 |
|
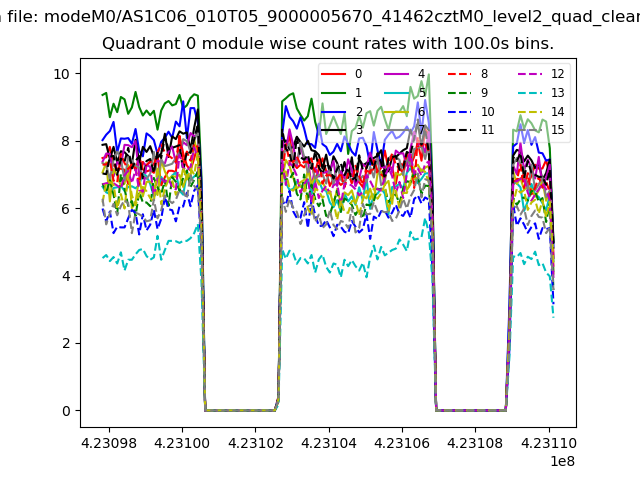
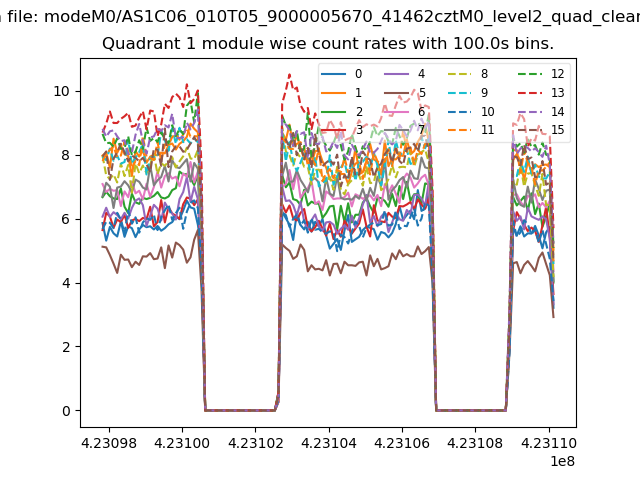
| Module-wise count rates for Quadrant A Data is divided into 100 sec bins |
 |
 |
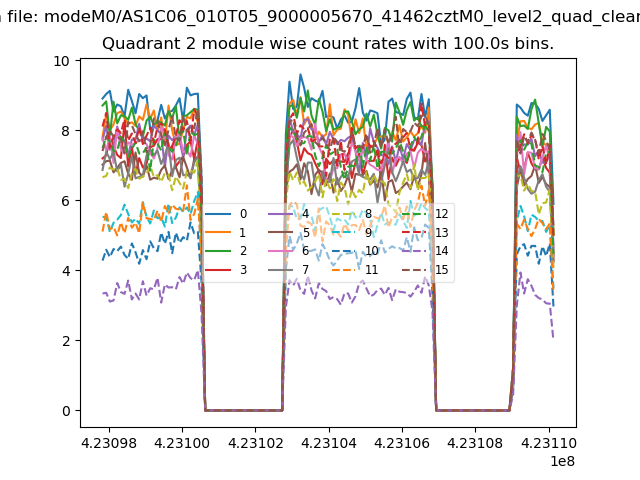
| Module-wise count rates for Quadrant B Data is divided into 100 sec bins |
 |
 |
| Module-wise count rates for Quadrant C Data is divided into 100 sec bins |
 |
 |
| Module-wise count rates for Quadrant D Data is divided into 100 sec bins |
 |
 |
| Parameter | Plot |
|---|---|
| CZT HV Monitor | 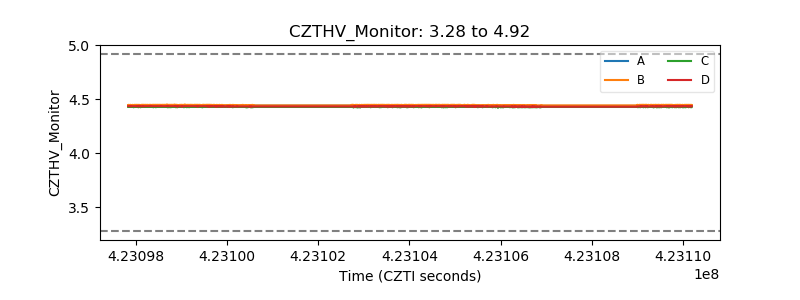 |
| D_VDD | 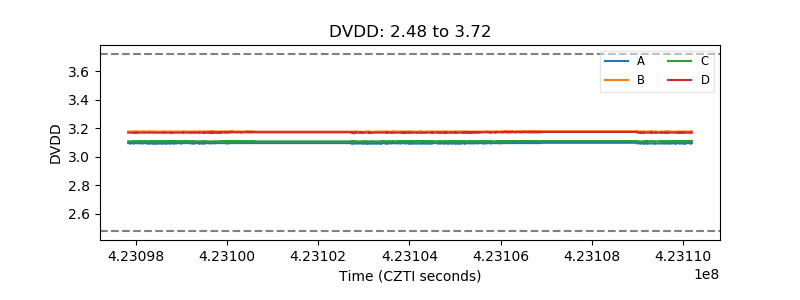 |
| Temperature 1 | 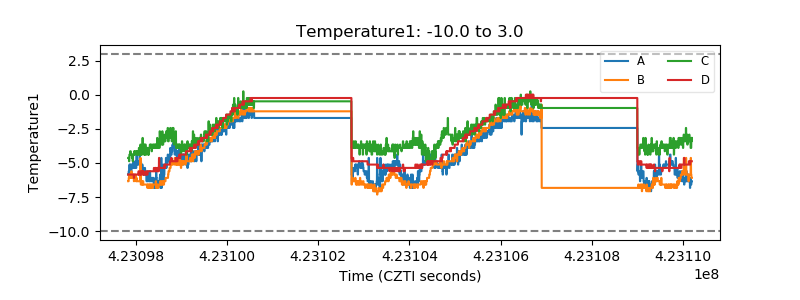 |
| Veto HV Monitor | 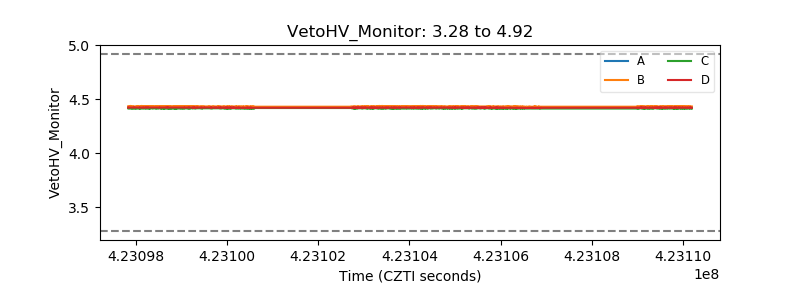 |
| Veto LLD | 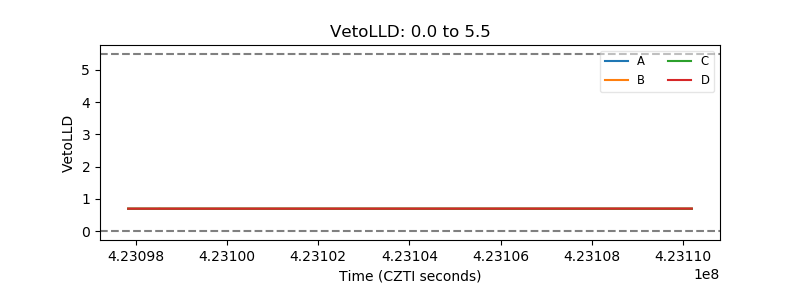 |
| Alpha Counter | 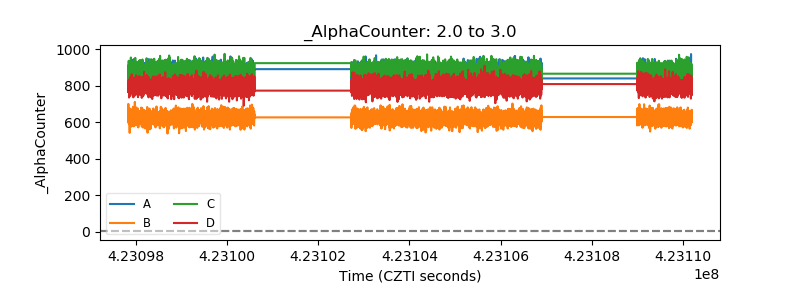 |
| _CPM_Rate | 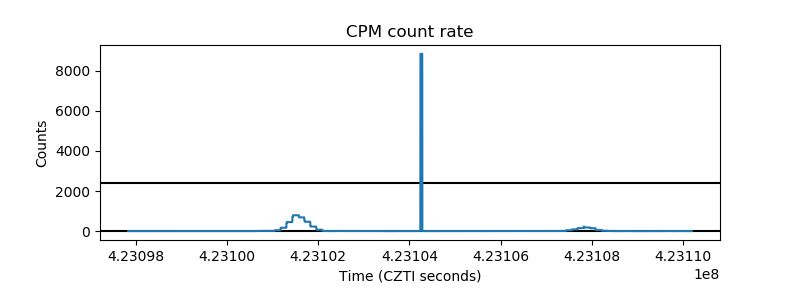 |
| CZT Counter |  |
| +2.5 Volts monitor | 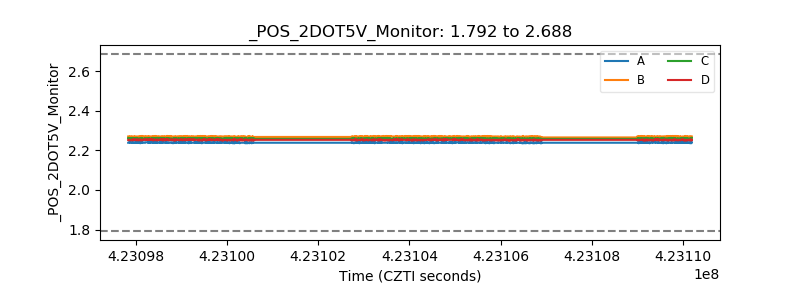 |
| +5 Volts monitor | 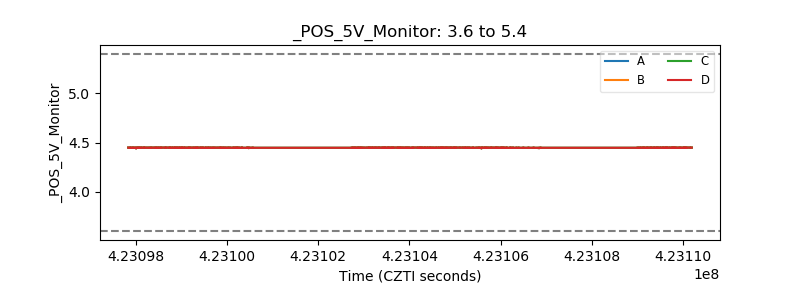 |
| _ROLL_ROT | 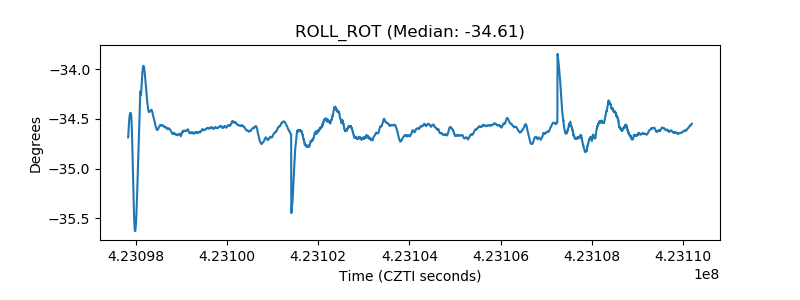 |
| _Roll_DEC | 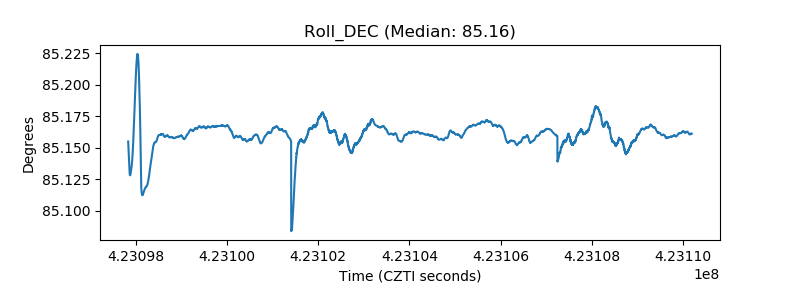 |
| _Roll_RA | 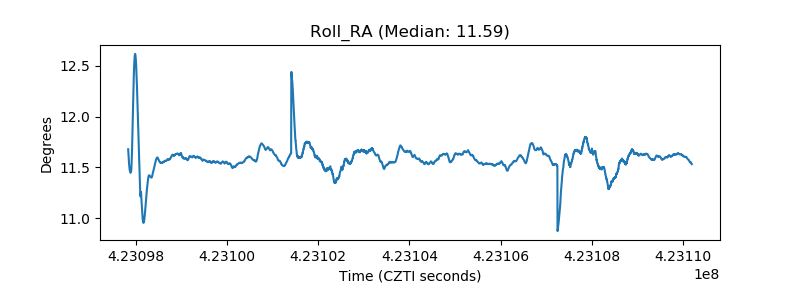 |
| Veto Counter | 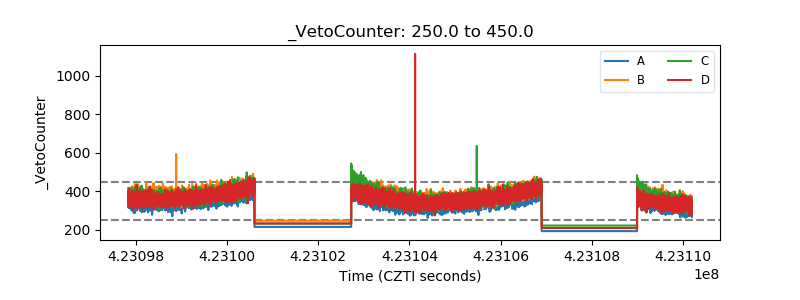 |