| Param | Original file | Final file |
|---|---|---|
| Filename | modeM0/AS1C06_010T05_9000005670_41463cztM0_level2.fits | modeM0/AS1C06_010T05_9000005670_41463cztM0_level2_quad_clean.evt |
| Size (bytes) | 331,145,280 | 85,697,280 |
| Size | 315.8 MB | 81.7 MB |
| Events in quadrant A | 2,821,403 | 578,698 |
| Events in quadrant B | 2,389,983 | 596,613 |
| Events in quadrant C | 2,969,557 | 542,257 |
| Events in quadrant D | 3,658,623 | 500,900 |
| Mode M9 | |||
|---|---|---|---|
| Quadrant | BADHDUFLAG | Total packets | Discarded packets |
| A | 0 | 31 | 0 |
| B | 0 | 31 | 0 |
| C | 0 | 31 | 0 |
| D | 0 | 32 | 0 |
| Mode SS | |||
|---|---|---|---|
| Quadrant | BADHDUFLAG | Total packets | Discarded packets |
| A | 0 | 112 | 0 |
| B | 0 | 112 | 0 |
| C | 0 | 112 | 0 |
| D | 0 | 112 | 0 |
| Mode M0 | |||
|---|---|---|---|
| Quadrant | BADHDUFLAG | Total packets | Discarded packets |
| A | 0 | 11611 | 3 |
| B | 0 | 11089 | 2 |
| C | 0 | 12498 | 2 |
| D | 0 | 14789 | 2 |
| Quadrant | Total seconds | Saturated seconds | Saturation percentage |
|---|---|---|---|
| A | 5366 | 13 | 0.242266% |
| B | 5366 | 9 | 0.167723% |
| C | 5366 | 243 | 4.528513% |
| D | 5366 | 285 | 5.311219% |
Noise dominated data is calculated using 1-second bins in cleaned event files. If a bin has >2000 counts, and if more than 50% of those come from <1% of pixels, then it is considered to be noise-dominated and hence unusable.
| Quadrant | # 1 sec bins | Bins with >0 counts | Bins with >2000 counts | High rate bins dominated by noise | Noise dominated (total time) | Noise dominated (detector-on time) | Marked lightcurve |
|---|---|---|---|---|---|---|---|
| A | 7219 | 5367 | 7 | 7 | 0.10% | 0.13% | 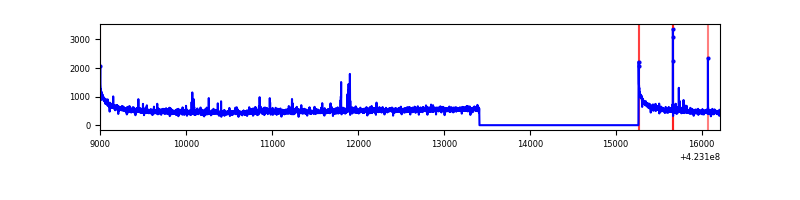 |
| B | 7219 | 5367 | 2 | 2 | 0.03% | 0.04% | 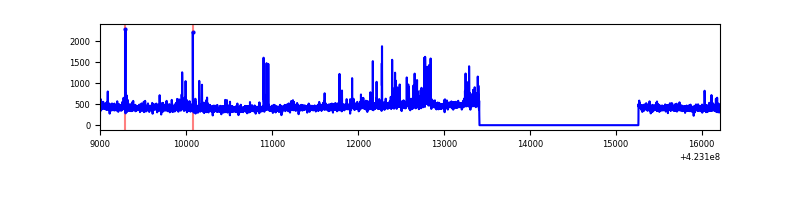 |
| C | 7219 | 5367 | 235 | 235 | 3.26% | 4.38% | 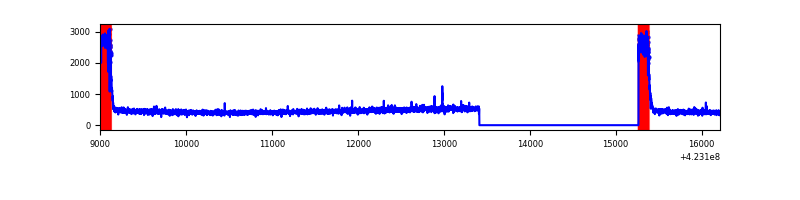 |
| D | 7219 | 5367 | 251 | 251 | 3.48% | 4.68% |  |
Top three noisy pixels from each quadrant. If the there are fewer than three noisy pixels in the level2.evt file, extra rows are filled as -1
| Pixel properties | Quadrant properties | ||||||
|---|---|---|---|---|---|---|---|
| Quadrant | DetID | PixID | Counts | Sigma | Mean | Median | Sigma |
| A | 10 | 83 | 543786 | 4730.73 | 562 | 551 | 114.8 |
| A | 2 | 79 | 58246 | 502.43 | 562 | 551 | 114.8 |
| A | 13 | 248 | 36215 | 310.58 | 562 | 551 | 114.8 |
| B | 0 | 190 | 110147 | 1022.55 | 561 | 547 | 107.2 |
| B | 5 | 255 | 45902 | 423.16 | 561 | 547 | 107.2 |
| B | 12 | 111 | 13479 | 120.65 | 561 | 547 | 107.2 |
| C | 0 | 10 | 664924 | 5384.73 | 530 | 532 | 123.4 |
| C | 15 | 214 | 220119 | 1779.7 | 530 | 532 | 123.4 |
| C | 15 | 111 | 6809 | 50.87 | 530 | 532 | 123.4 |
| D | 1 | 52 | 571348 | 4365.43 | 532 | 516 | 130.8 |
| D | 1 | 47 | 373025 | 2848.76 | 532 | 516 | 130.8 |
| D | 13 | 249 | 211465 | 1613.23 | 532 | 516 | 130.8 |
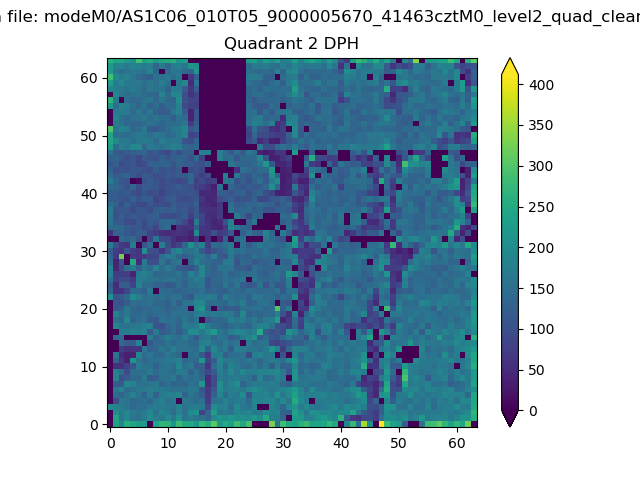
Histogram calculated using DETX and DETY for each event in the final _common_clean file
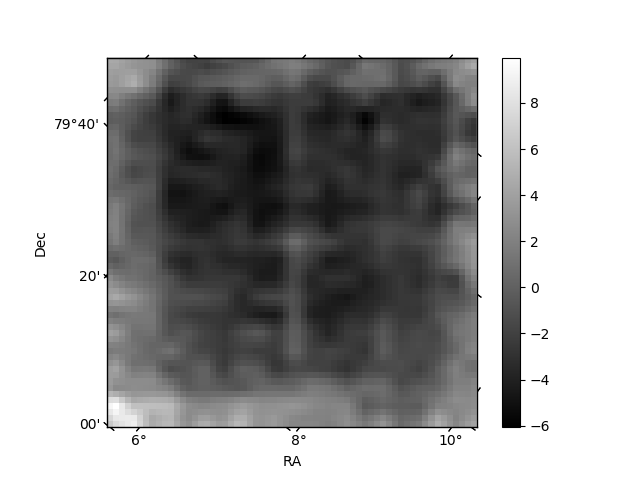
| Quadrant A |  |
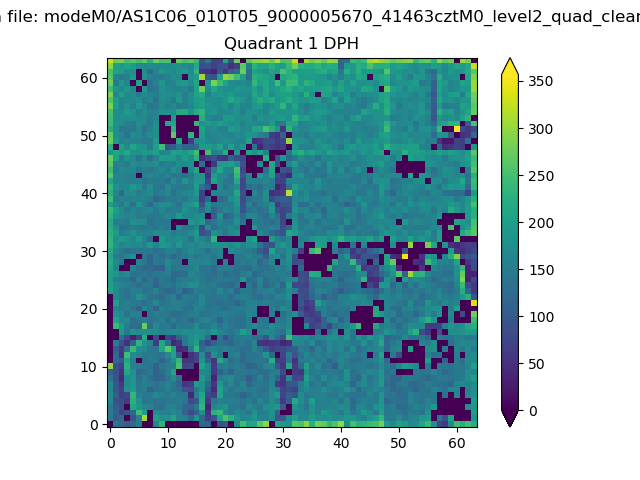 |
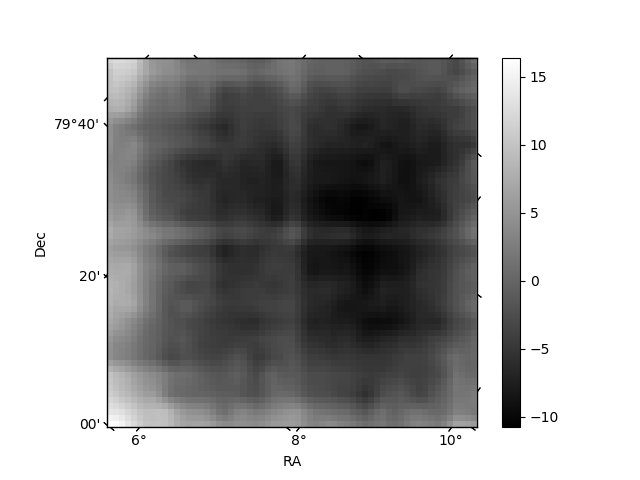
Quadrant B |
|---|---|---|---|
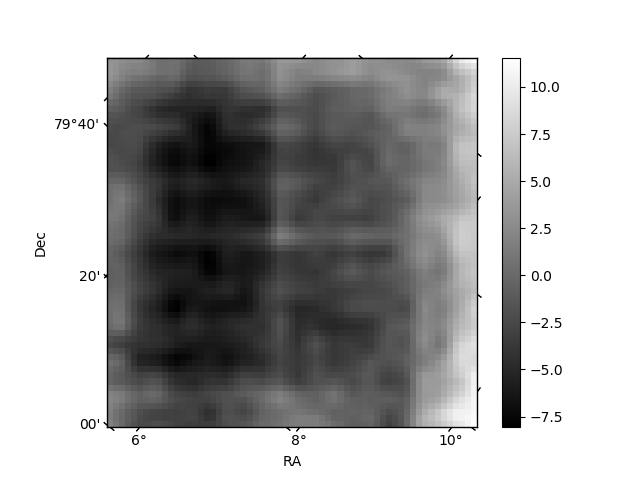
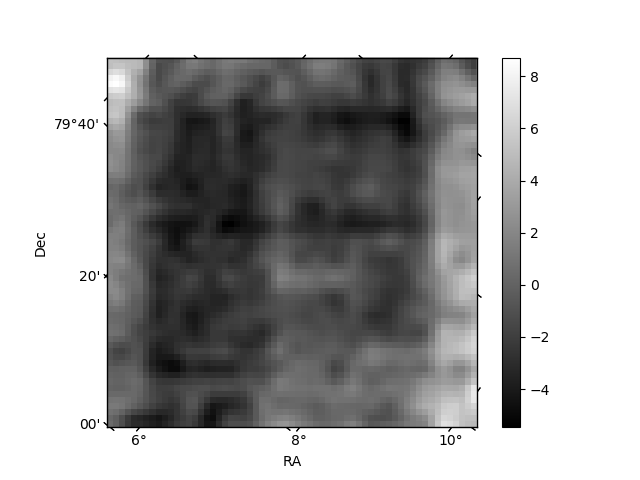
| Quadrant D |  |
 |
Quadrant C |
| Plot type | Count rate plots | Images |
|---|---|---|
| Comparison with Poisson distribution Blue bars denote a histogram of data divided into 1 sec bins. Red curve is a Poisson curve with rate = median count rate of data. |
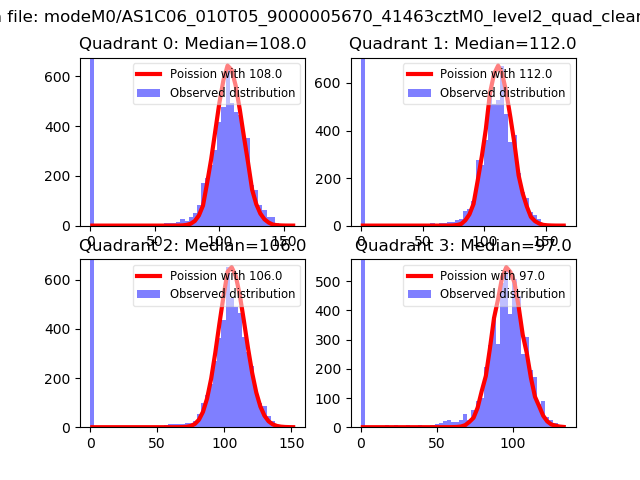 |
 |
| Quadrant-wise count rates Data is divided into 100 sec bins |
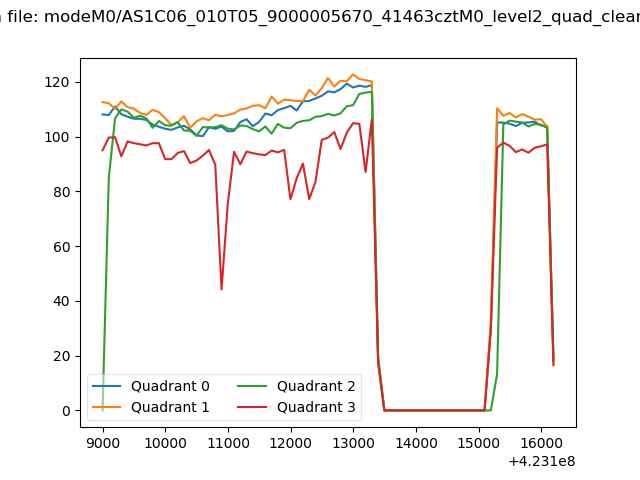 |
|
| Module-wise count rates for Quadrant A Data is divided into 100 sec bins |
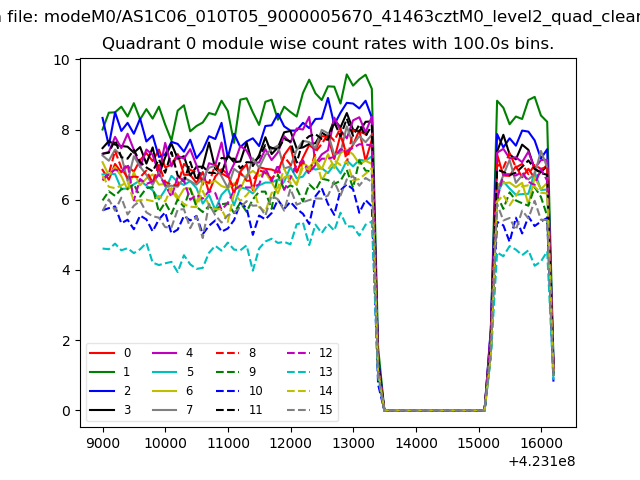 |
 |
| Module-wise count rates for Quadrant B Data is divided into 100 sec bins |
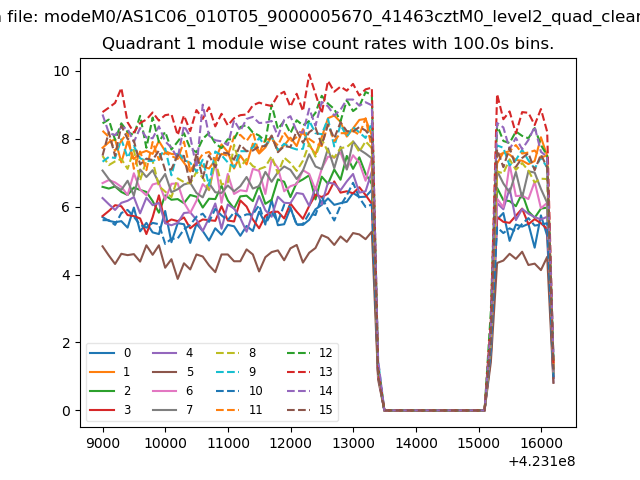 |
 |
| Module-wise count rates for Quadrant C Data is divided into 100 sec bins |
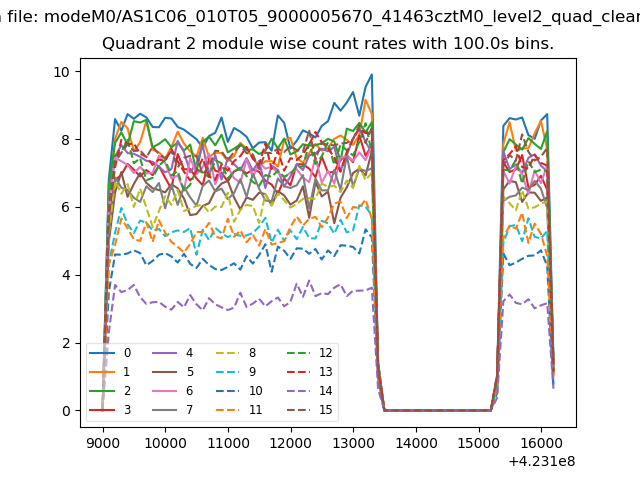 |
 |
| Module-wise count rates for Quadrant D Data is divided into 100 sec bins |
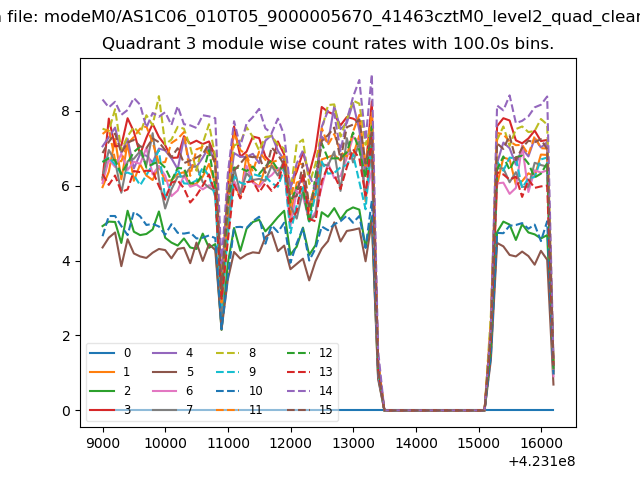 |
 |
| Parameter | Plot |
|---|---|
| CZT HV Monitor | 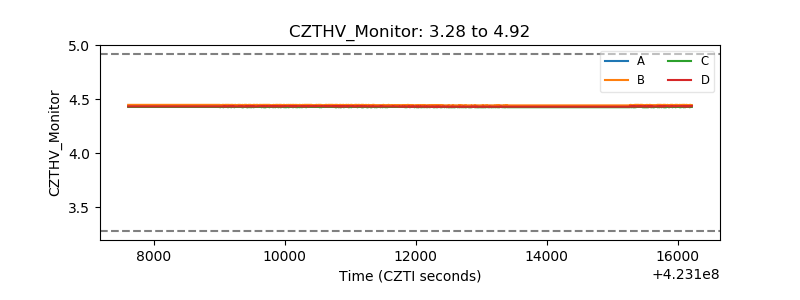 |
| D_VDD | 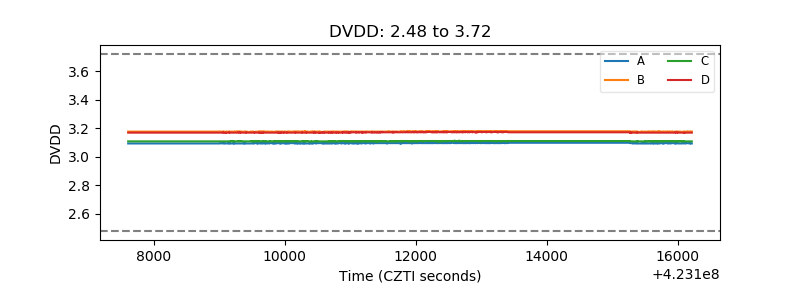 |
| Temperature 1 | 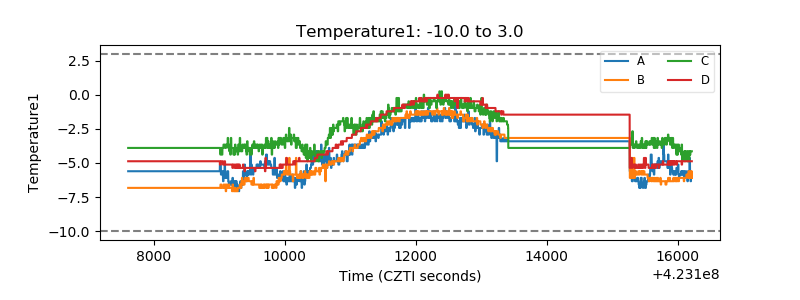 |
| Veto HV Monitor |  |
| Veto LLD | 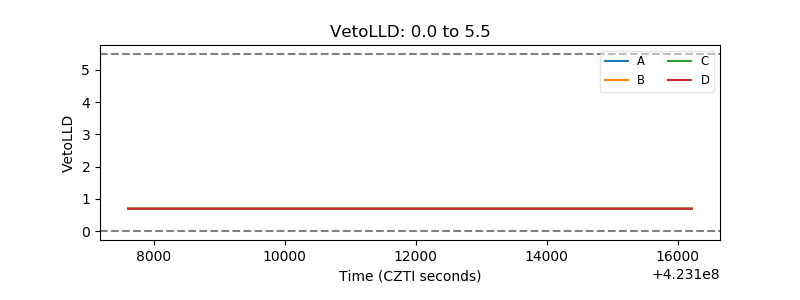 |
| Alpha Counter | 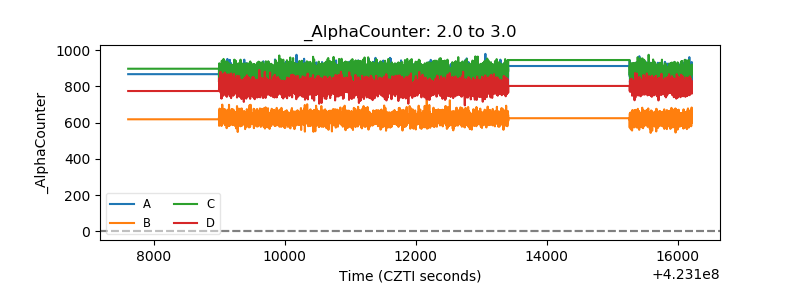 |
| _CPM_Rate |  |
| CZT Counter | 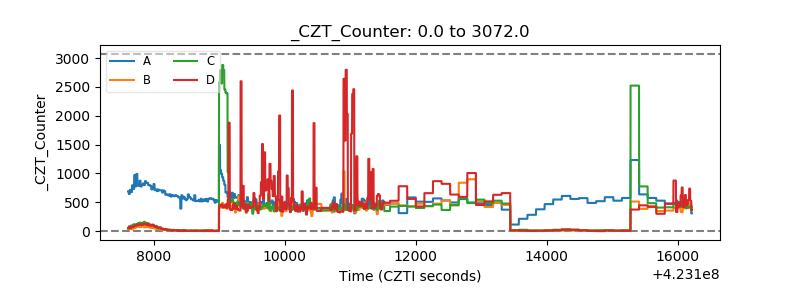 |
| +2.5 Volts monitor | 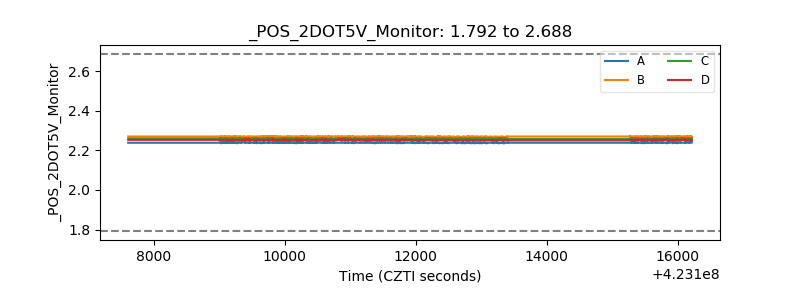 |
| +5 Volts monitor | 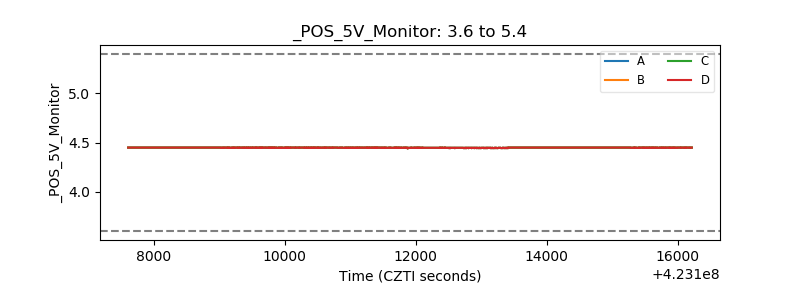 |
| _ROLL_ROT | 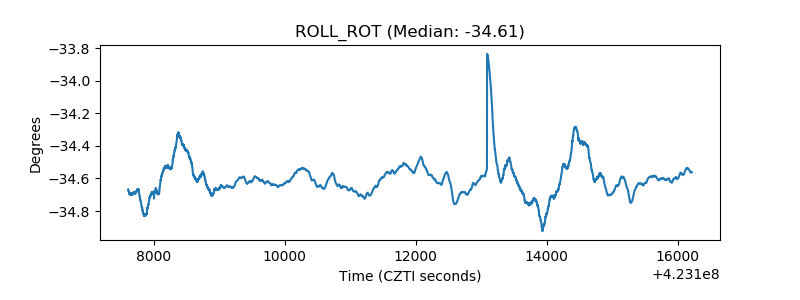 |
| _Roll_DEC | 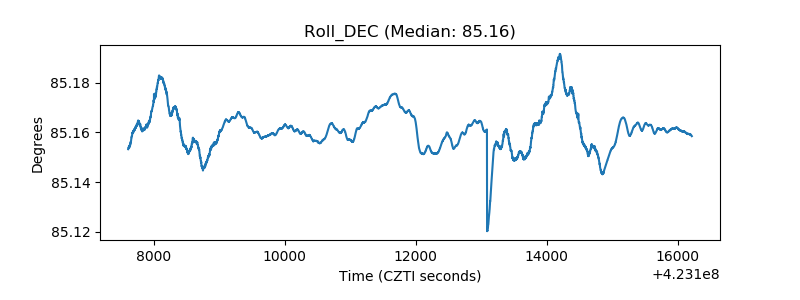 |
| _Roll_RA | 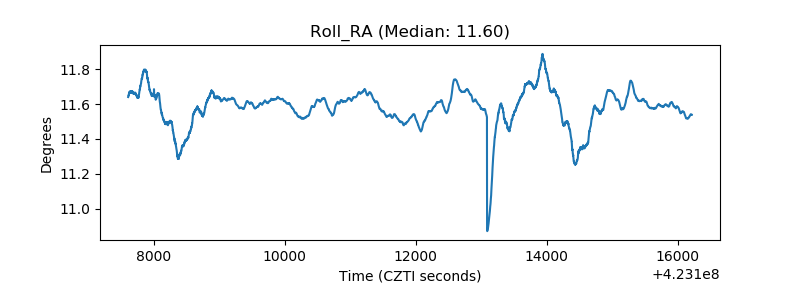 |
| Veto Counter | 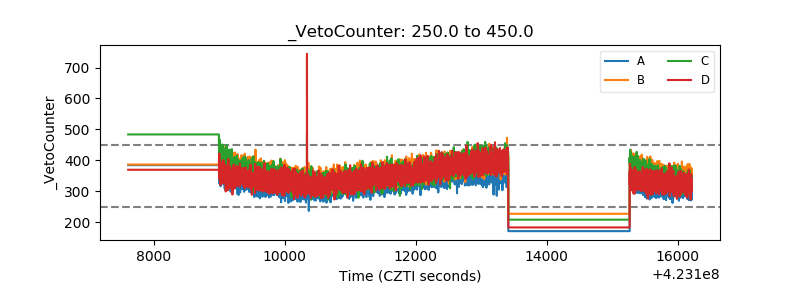 |