| Param | Original file | Final file |
|---|---|---|
| Filename | modeM0/AS1C06_010T05_9000005670_41464cztM0_level2.fits | modeM0/AS1C06_010T05_9000005670_41464cztM0_level2_quad_clean.evt |
| Size (bytes) | 314,930,880 | 86,509,440 |
| Size | 300.3 MB | 82.5 MB |
| Events in quadrant A | 2,781,792 | 578,460 |
| Events in quadrant B | 2,519,547 | 594,718 |
| Events in quadrant C | 2,729,560 | 554,551 |
| Events in quadrant D | 3,206,011 | 513,600 |
| Mode M9 | |||
|---|---|---|---|
| Quadrant | BADHDUFLAG | Total packets | Discarded packets |
| A | 0 | 15 | 0 |
| B | 0 | 15 | 0 |
| C | 0 | 15 | 0 |
| D | 0 | 15 | 0 |
| Mode SS | |||
|---|---|---|---|
| Quadrant | BADHDUFLAG | Total packets | Discarded packets |
| A | 0 | 110 | 0 |
| B | 0 | 110 | 0 |
| C | 0 | 110 | 0 |
| D | 0 | 110 | 0 |
| Mode M0 | |||
|---|---|---|---|
| Quadrant | BADHDUFLAG | Total packets | Discarded packets |
| A | 0 | 11422 | 2 |
| B | 0 | 11484 | 1 |
| C | 0 | 11720 | 1 |
| D | 0 | 13413 | 1 |
| Quadrant | Total seconds | Saturated seconds | Saturation percentage |
|---|---|---|---|
| A | 5399 | 22 | 0.407483% |
| B | 5399 | 10 | 0.185219% |
| C | 5399 | 109 | 2.018892% |
| D | 5399 | 85 | 1.574366% |
Noise dominated data is calculated using 1-second bins in cleaned event files. If a bin has >2000 counts, and if more than 50% of those come from <1% of pixels, then it is considered to be noise-dominated and hence unusable.
| Quadrant | # 1 sec bins | Bins with >0 counts | Bins with >2000 counts | High rate bins dominated by noise | Noise dominated (total time) | Noise dominated (detector-on time) | Marked lightcurve |
|---|---|---|---|---|---|---|---|
| A | 6922 | 5400 | 15 | 15 | 0.22% | 0.28% | 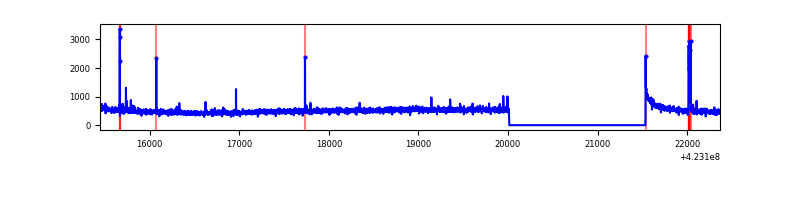 |
| B | 6922 | 5400 | 2 | 2 | 0.03% | 0.04% | 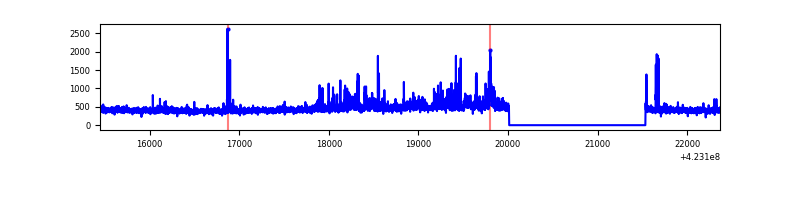 |
| C | 6922 | 5400 | 109 | 109 | 1.57% | 2.02% | 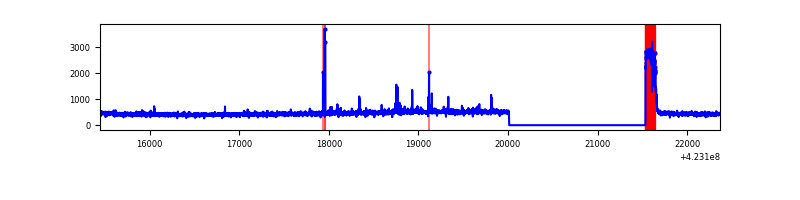 |
| D | 6922 | 5400 | 74 | 74 | 1.07% | 1.37% | 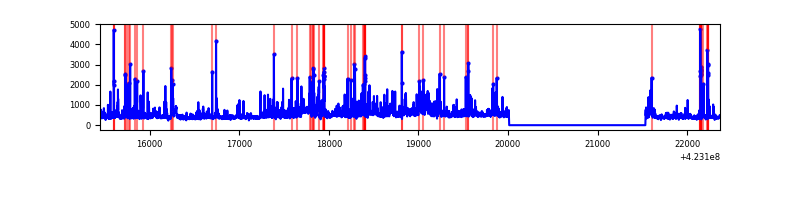 |
Top three noisy pixels from each quadrant. If the there are fewer than three noisy pixels in the level2.evt file, extra rows are filled as -1
| Pixel properties | Quadrant properties | ||||||
|---|---|---|---|---|---|---|---|
| Quadrant | DetID | PixID | Counts | Sigma | Mean | Median | Sigma |
| A | 10 | 83 | 492425 | 4166.63 | 574 | 563 | 118.0 |
| A | 13 | 248 | 60933 | 511.4 | 574 | 563 | 118.0 |
| A | 2 | 79 | 10137 | 81.1 | 574 | 563 | 118.0 |
| B | 0 | 190 | 135231 | 1217.05 | 569 | 553 | 110.7 |
| B | 5 | 255 | 124555 | 1120.57 | 569 | 553 | 110.7 |
| B | 12 | 111 | 13906 | 120.67 | 569 | 553 | 110.7 |
| C | 0 | 10 | 315865 | 2478.88 | 548 | 550 | 127.2 |
| C | 15 | 214 | 224125 | 1757.66 | 548 | 550 | 127.2 |
| C | 15 | 111 | 26281 | 202.29 | 548 | 550 | 127.2 |
| D | 1 | 47 | 266377 | 1955.1 | 553 | 536 | 136.0 |
| D | 13 | 249 | 229105 | 1680.98 | 553 | 536 | 136.0 |
| D | 5 | 222 | 156207 | 1144.86 | 553 | 536 | 136.0 |
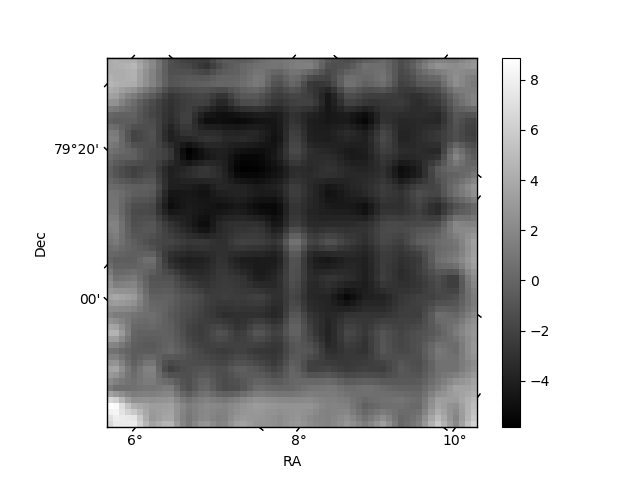
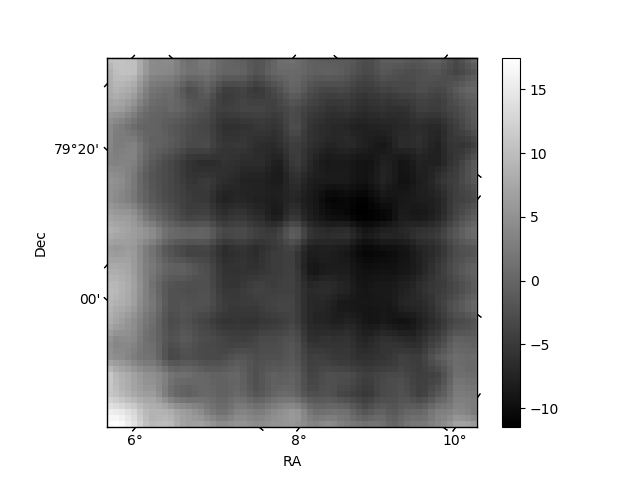
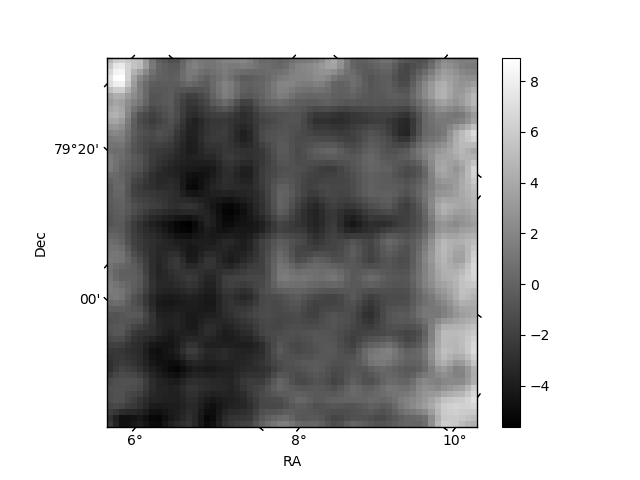
Histogram calculated using DETX and DETY for each event in the final _common_clean file
| Quadrant A | 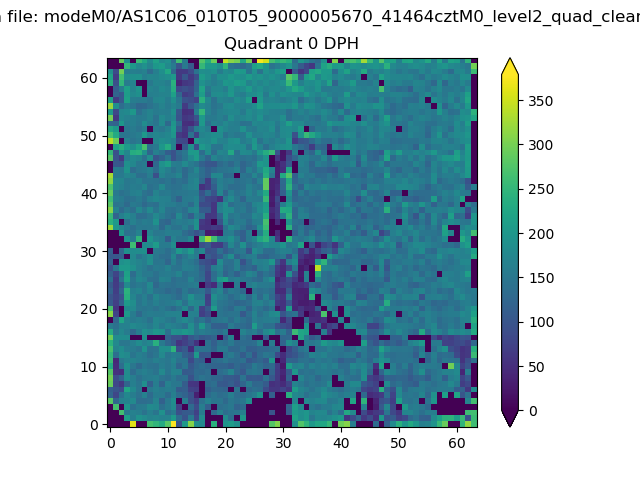 |
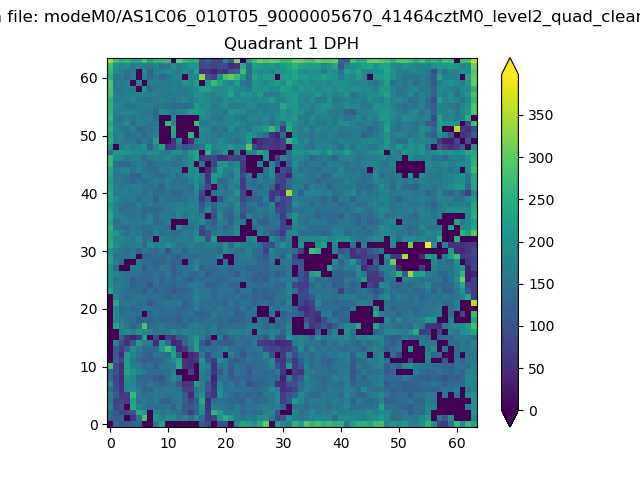 |
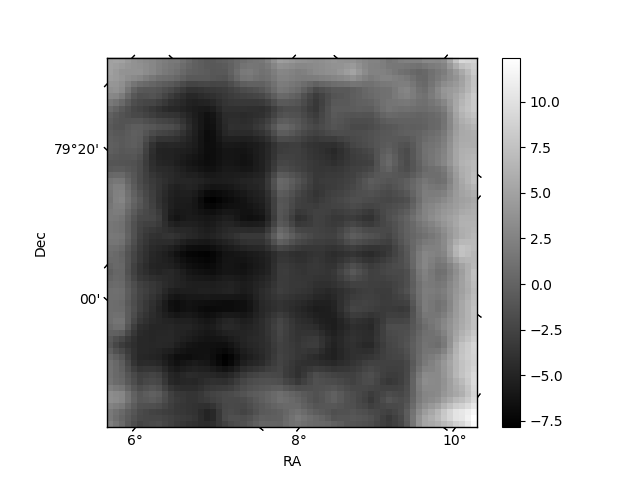
Quadrant B |
|---|---|---|---|
| Quadrant D | 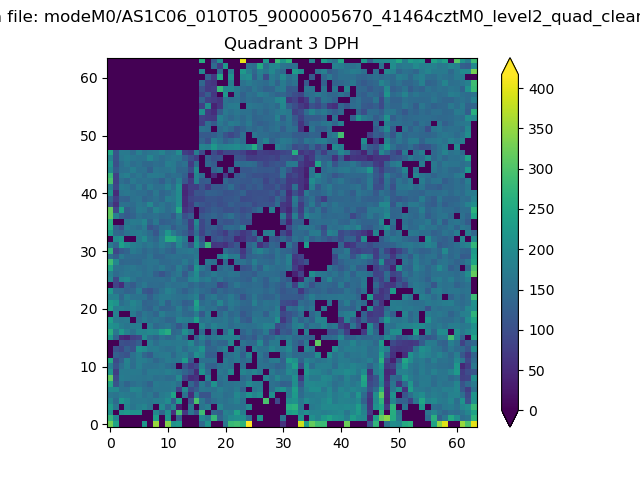 |
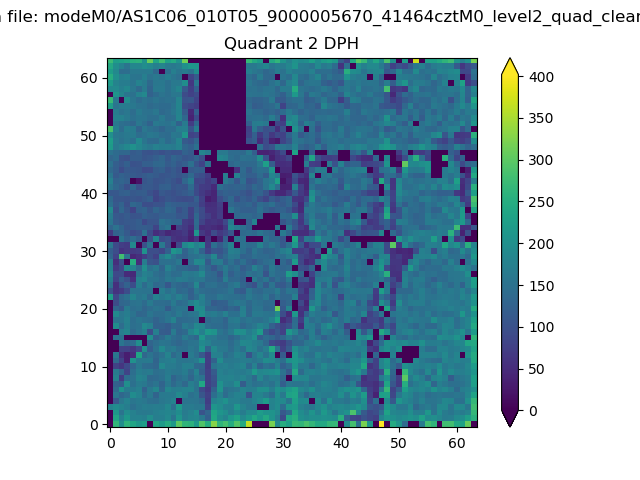 |
Quadrant C |
| Plot type | Count rate plots | Images |
|---|---|---|
| Comparison with Poisson distribution Blue bars denote a histogram of data divided into 1 sec bins. Red curve is a Poisson curve with rate = median count rate of data. |
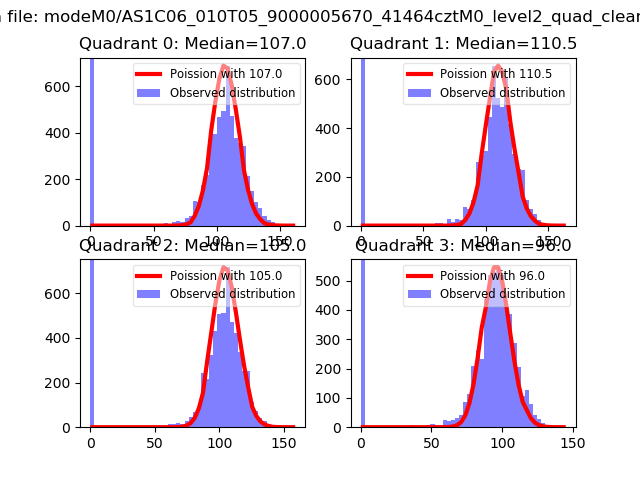 |
 |
| Quadrant-wise count rates Data is divided into 100 sec bins |
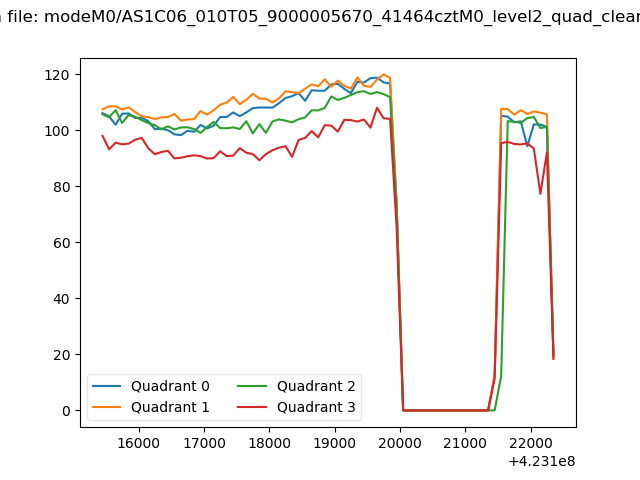 |
|
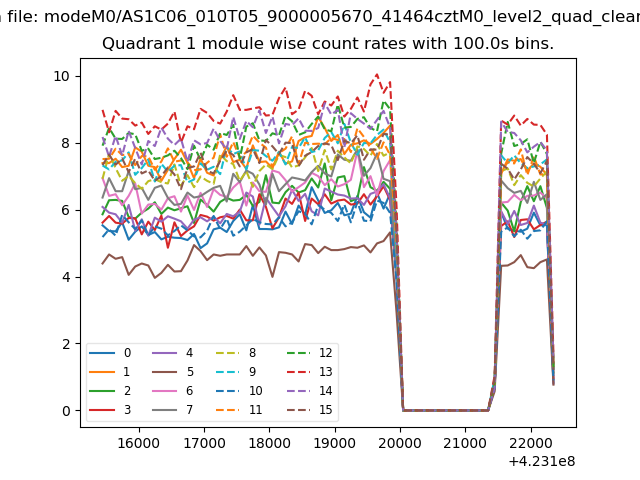
| Module-wise count rates for Quadrant A Data is divided into 100 sec bins |
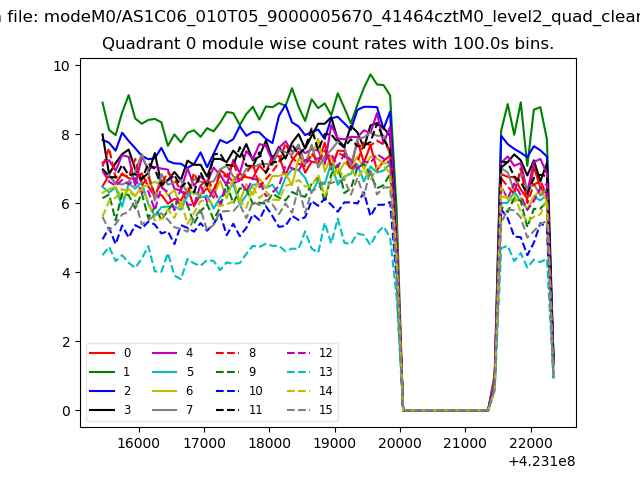 |
 |
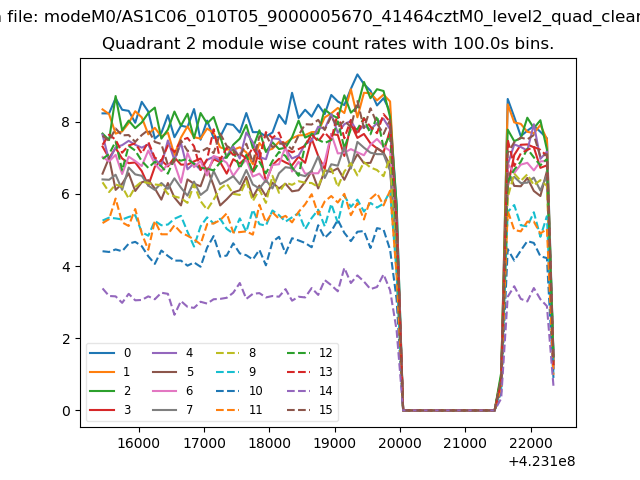
| Module-wise count rates for Quadrant B Data is divided into 100 sec bins |
 |
 |
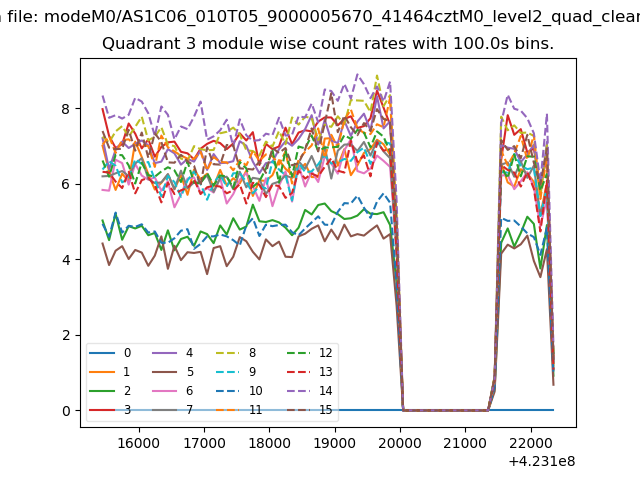
| Module-wise count rates for Quadrant C Data is divided into 100 sec bins |
 |
 |
| Module-wise count rates for Quadrant D Data is divided into 100 sec bins |
 |
 |
| Parameter | Plot |
|---|---|
| CZT HV Monitor | 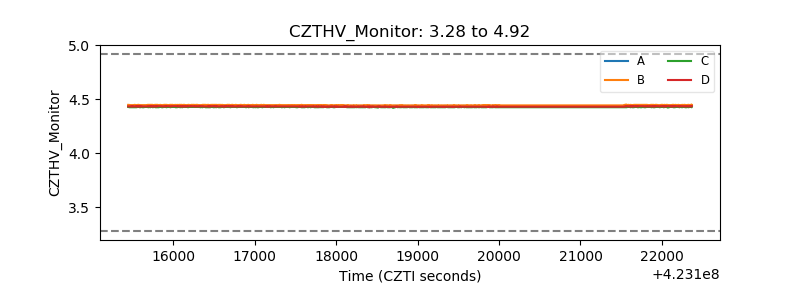 |
| D_VDD | 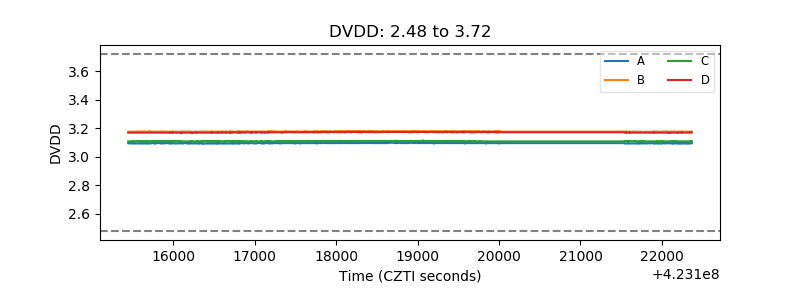 |
| Temperature 1 | 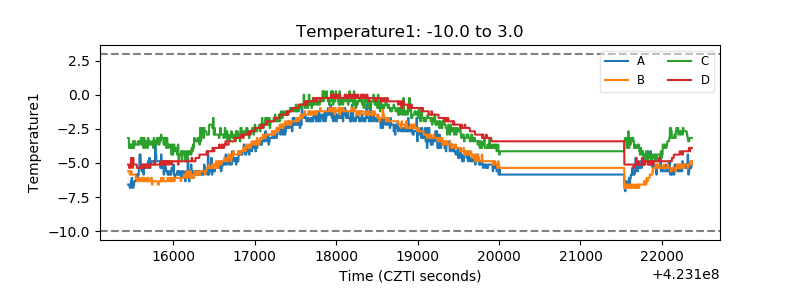 |
| Veto HV Monitor | 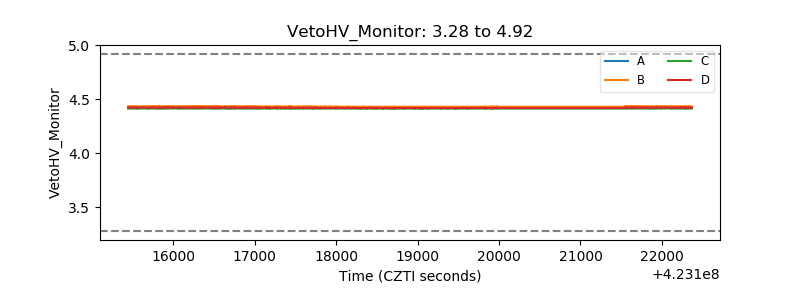 |
| Veto LLD | 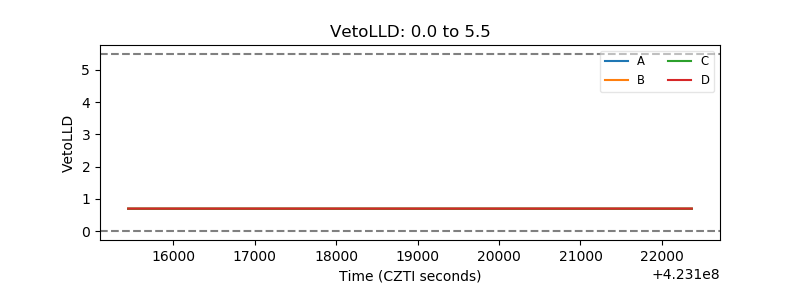 |
| Alpha Counter | 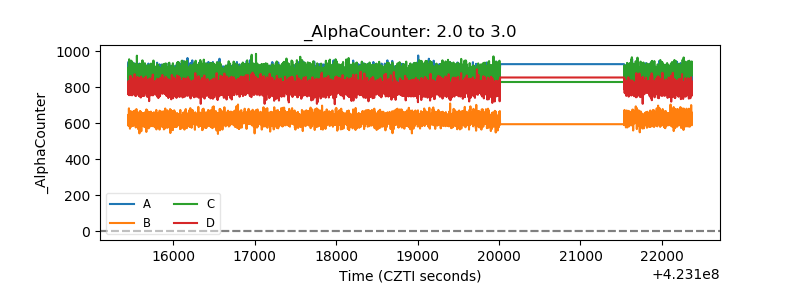 |
| _CPM_Rate | 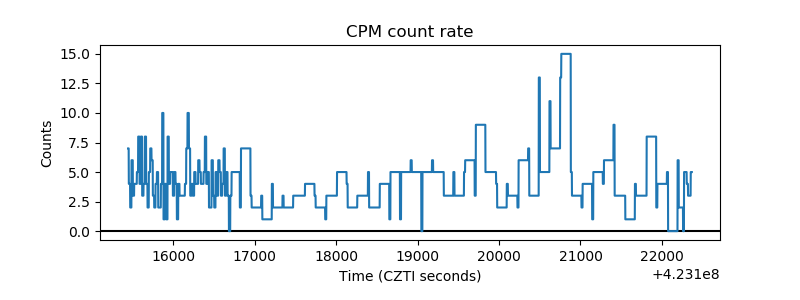 |
| CZT Counter | 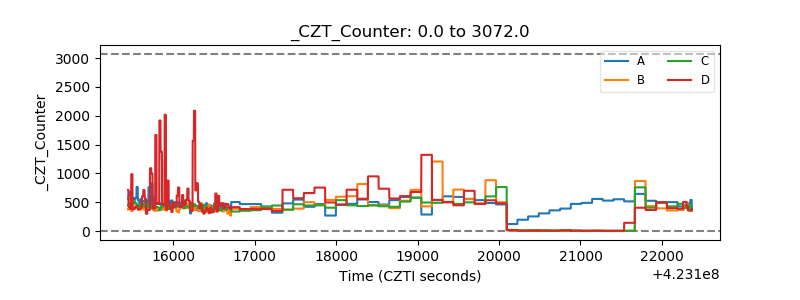 |
| +2.5 Volts monitor |  |
| +5 Volts monitor |  |
| _ROLL_ROT | 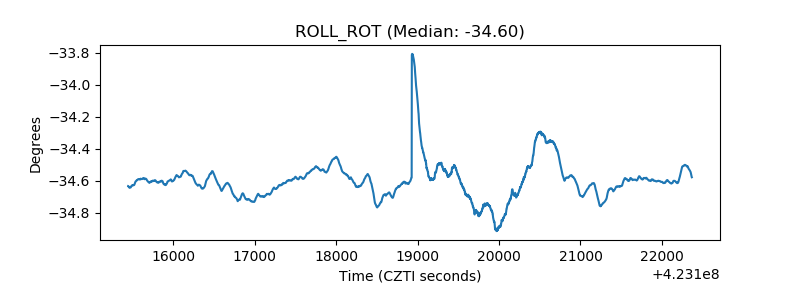 |
| _Roll_DEC | 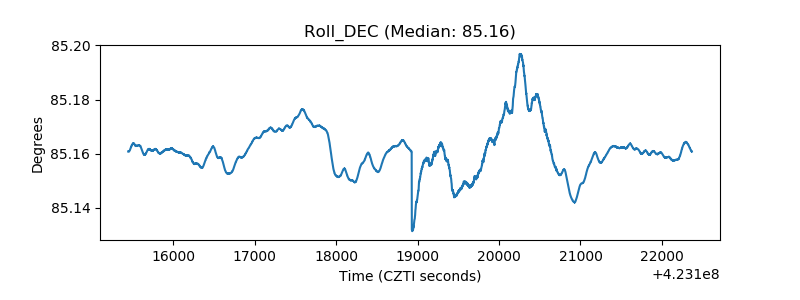 |
| _Roll_RA |  |
| Veto Counter | 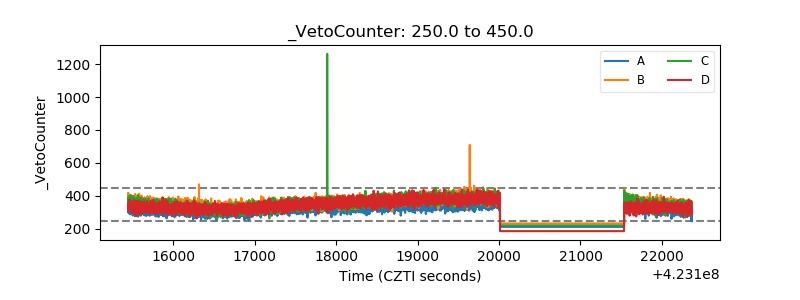 |