| Param | Original file | Final file |
|---|---|---|
| Filename | modeM0/AS1C06_010T05_9000005670_41465cztM0_level2.fits | modeM0/AS1C06_010T05_9000005670_41465cztM0_level2_quad_clean.evt |
| Size (bytes) | 133,240,320 | 36,682,560 |
| Size | 127.1 MB | 35.0 MB |
| Events in quadrant A | 1,228,758 | 243,247 |
| Events in quadrant B | 1,021,501 | 252,482 |
| Events in quadrant C | 1,274,836 | 228,825 |
| Events in quadrant D | 1,220,529 | 216,383 |
| Mode M9 | |||
|---|---|---|---|
| Quadrant | BADHDUFLAG | Total packets | Discarded packets |
| A | 0 | 1 | 0 |
| B | 0 | 1 | 0 |
| C | 0 | 1 | 0 |
| D | 0 | 2 | 0 |
| Mode SS | |||
|---|---|---|---|
| Quadrant | BADHDUFLAG | Total packets | Discarded packets |
| A | 0 | 46 | 0 |
| B | 0 | 46 | 0 |
| C | 0 | 46 | 0 |
| D | 0 | 46 | 0 |
| Mode M0 | |||
|---|---|---|---|
| Quadrant | BADHDUFLAG | Total packets | Discarded packets |
| A | 0 | 5143 | 1 |
| B | 0 | 4901 | 1 |
| C | 0 | 5487 | 1 |
| D | 0 | 5379 | 1 |
| Quadrant | Total seconds | Saturated seconds | Saturation percentage |
|---|---|---|---|
| A | 2364 | 12 | 0.507614% |
| B | 2364 | 5 | 0.211506% |
| C | 2364 | 103 | 4.357022% |
| D | 2364 | 33 | 1.395939% |
Noise dominated data is calculated using 1-second bins in cleaned event files. If a bin has >2000 counts, and if more than 50% of those come from <1% of pixels, then it is considered to be noise-dominated and hence unusable.
| Quadrant | # 1 sec bins | Bins with >0 counts | Bins with >2000 counts | High rate bins dominated by noise | Noise dominated (total time) | Noise dominated (detector-on time) | Marked lightcurve |
|---|---|---|---|---|---|---|---|
| A | 2364 | 2364 | 11 | 11 | 0.47% | 0.47% |  |
| B | 2364 | 2364 | 1 | 1 | 0.04% | 0.04% | 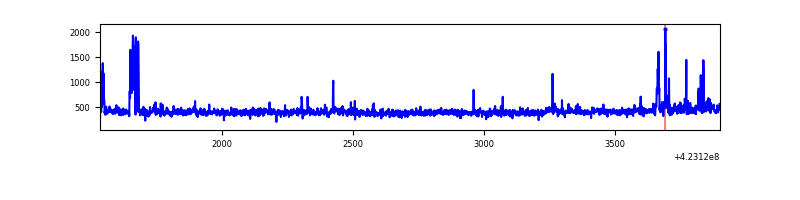 |
| C | 2364 | 2364 | 105 | 105 | 4.44% | 4.44% | 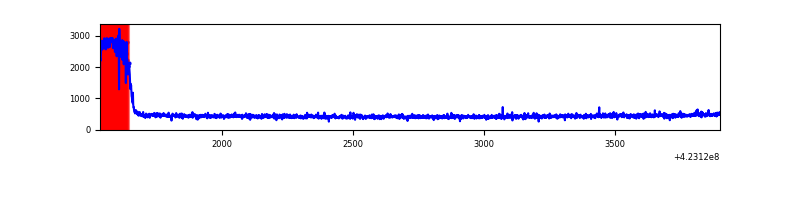 |
| D | 2364 | 2364 | 29 | 29 | 1.23% | 1.23% | 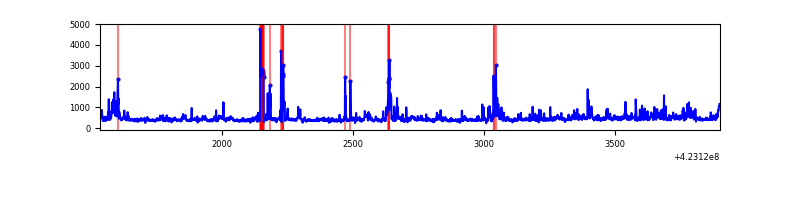 |
Top three noisy pixels from each quadrant. If the there are fewer than three noisy pixels in the level2.evt file, extra rows are filled as -1
| Pixel properties | Quadrant properties | ||||||
|---|---|---|---|---|---|---|---|
| Quadrant | DetID | PixID | Counts | Sigma | Mean | Median | Sigma |
| A | 10 | 83 | 241204 | 4734.86 | 241 | 236 | 50.9 |
| A | 13 | 248 | 52233 | 1021.71 | 241 | 236 | 50.9 |
| A | 13 | 254 | 3833 | 70.68 | 241 | 236 | 50.9 |
| B | 5 | 255 | 40291 | 841.11 | 238 | 232 | 47.6 |
| B | 0 | 190 | 36567 | 762.92 | 238 | 232 | 47.6 |
| B | 12 | 111 | 5869 | 118.36 | 238 | 232 | 47.6 |
| C | 0 | 10 | 299180 | 5576.39 | 223 | 223 | 53.6 |
| C | 15 | 214 | 98910 | 1840.79 | 223 | 223 | 53.6 |
| C | 12 | 249 | 4077 | 71.89 | 223 | 223 | 53.6 |
| D | 1 | 47 | 145698 | 2532.71 | 228 | 221 | 57.4 |
| D | 5 | 222 | 64251 | 1114.74 | 228 | 221 | 57.4 |
| D | 2 | 249 | 49269 | 853.91 | 228 | 221 | 57.4 |
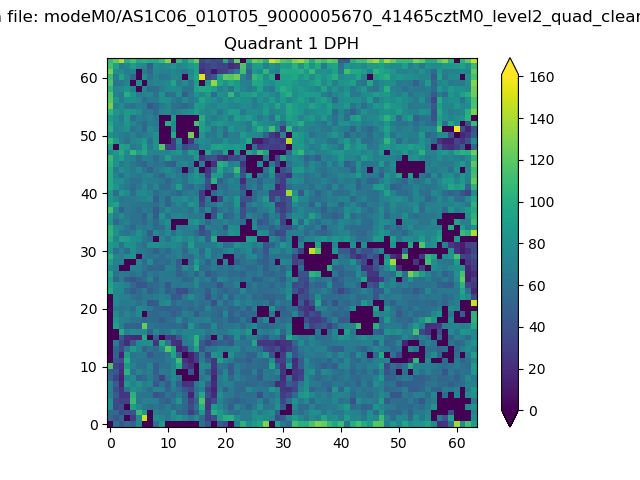
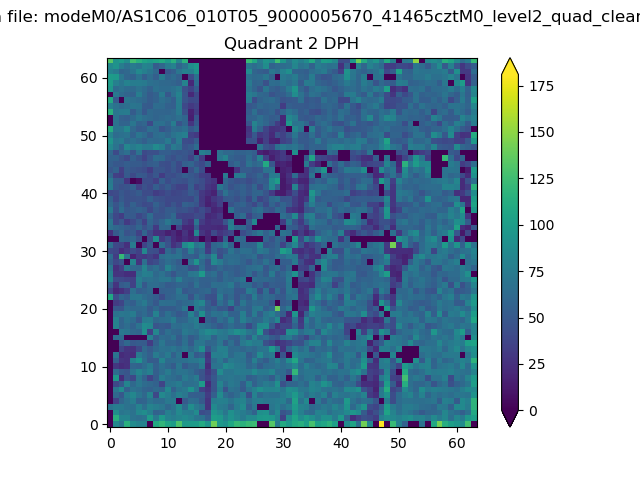
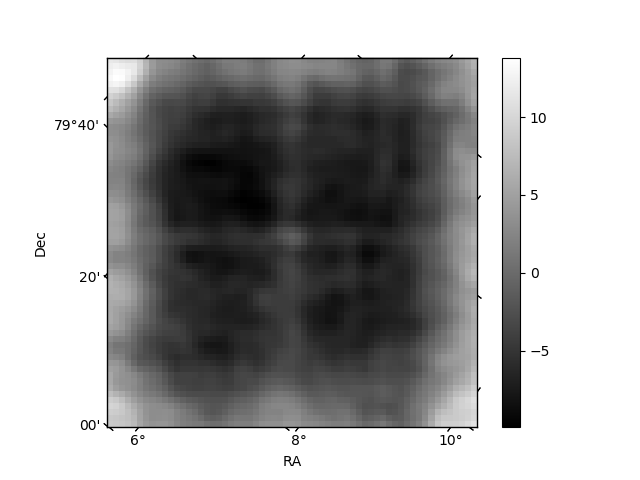
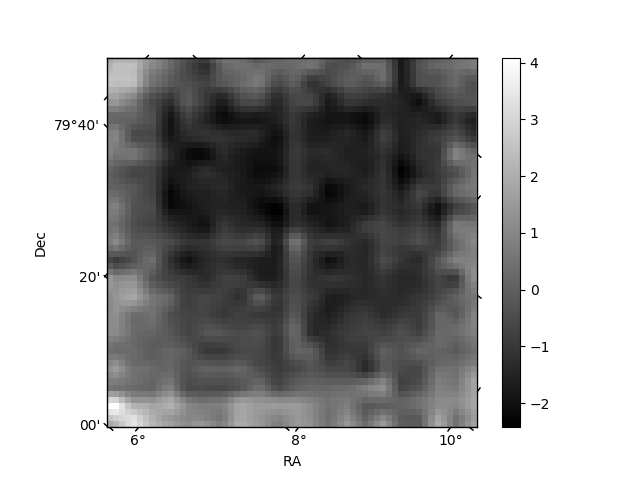
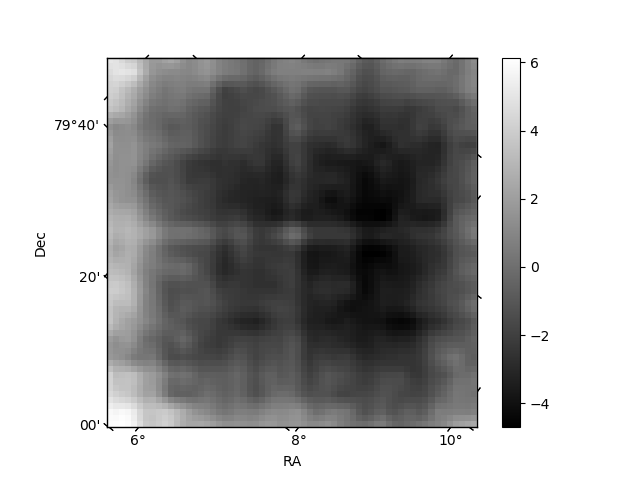
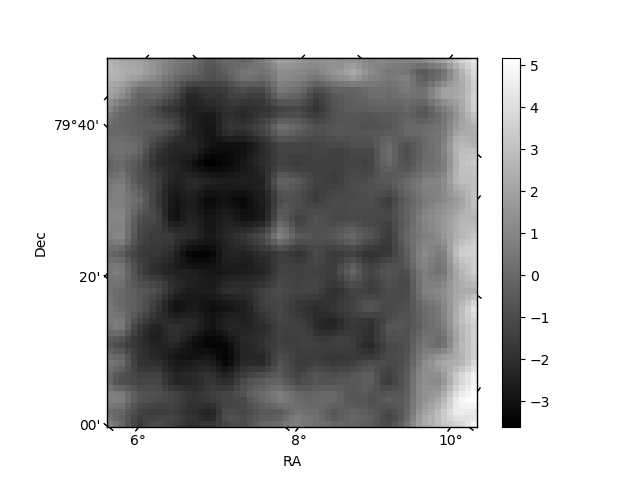
Histogram calculated using DETX and DETY for each event in the final _common_clean file
| Quadrant A | 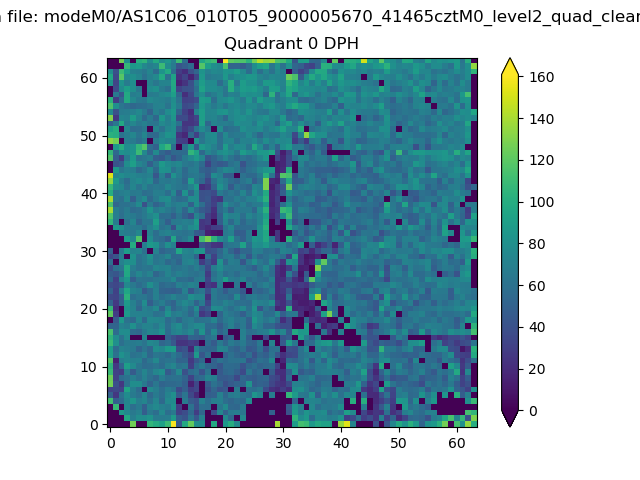 |
 |
Quadrant B |
|---|---|---|---|
| Quadrant D | 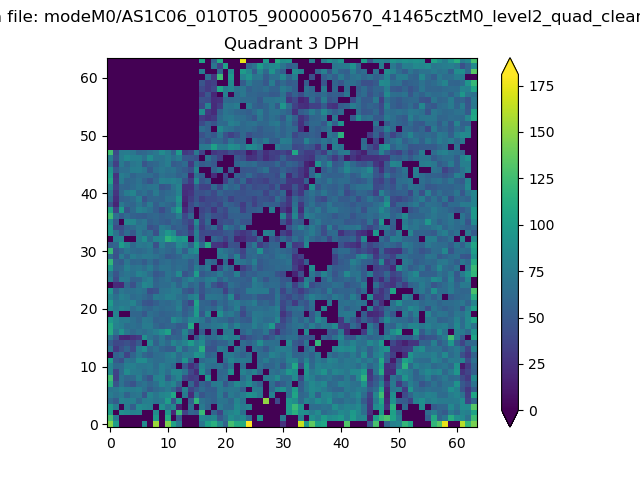 |
 |
Quadrant C |
| Plot type | Count rate plots | Images |
|---|---|---|
| Comparison with Poisson distribution Blue bars denote a histogram of data divided into 1 sec bins. Red curve is a Poisson curve with rate = median count rate of data. |
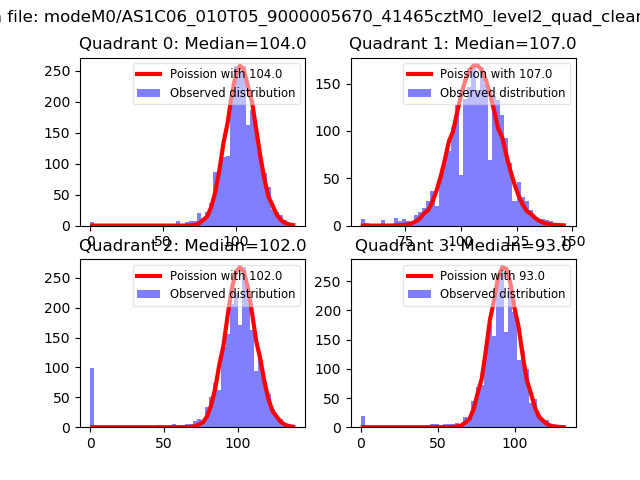 |
 |
| Quadrant-wise count rates Data is divided into 100 sec bins |
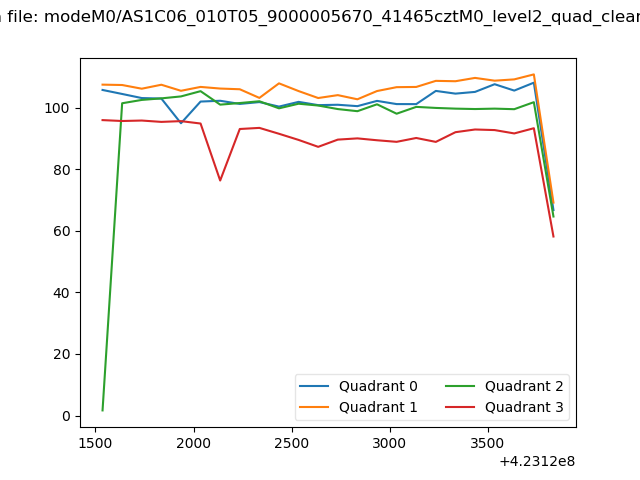 |
|
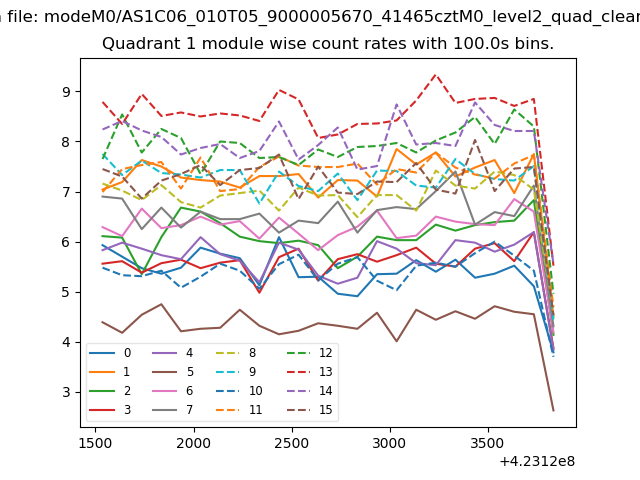
| Module-wise count rates for Quadrant A Data is divided into 100 sec bins |
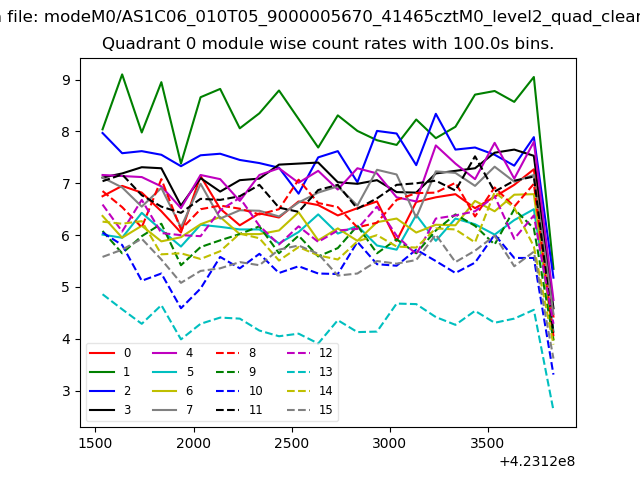 |
 |
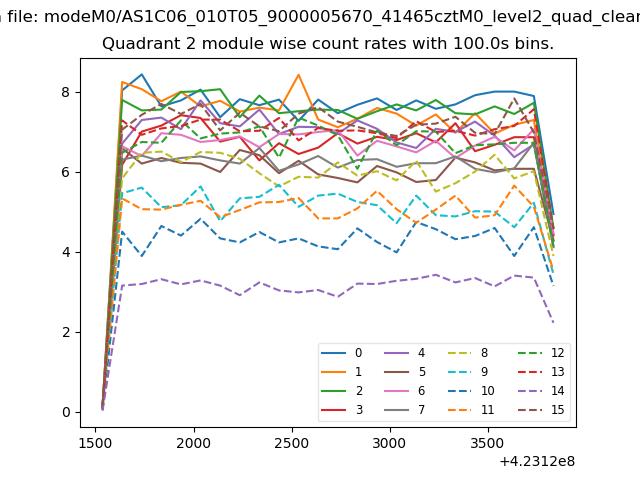
| Module-wise count rates for Quadrant B Data is divided into 100 sec bins |
 |
 |
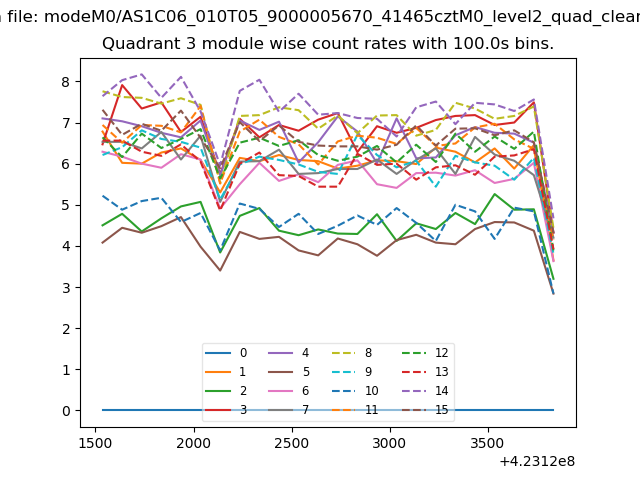
| Module-wise count rates for Quadrant C Data is divided into 100 sec bins |
 |
 |
| Module-wise count rates for Quadrant D Data is divided into 100 sec bins |
 |
 |
| Parameter | Plot |
|---|---|
| CZT HV Monitor | 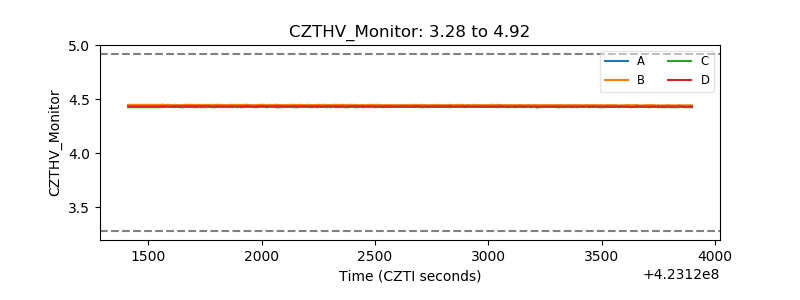 |
| D_VDD | 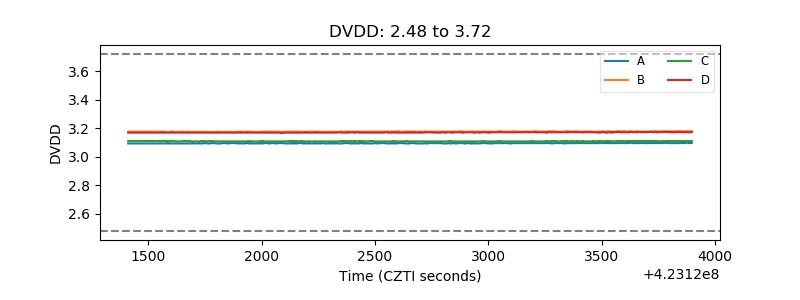 |
| Temperature 1 | 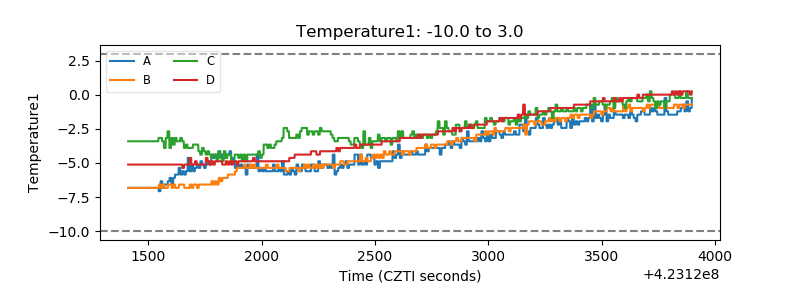 |
| Veto HV Monitor | 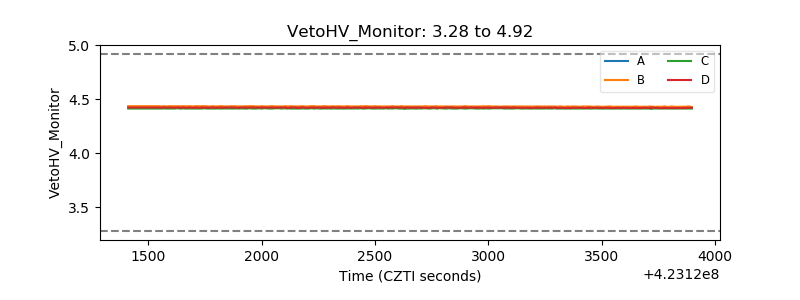 |
| Veto LLD | 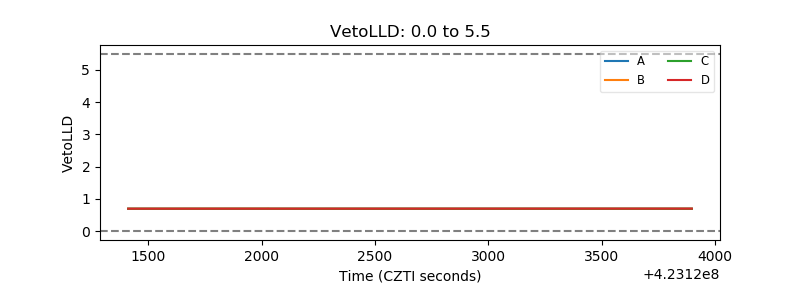 |
| Alpha Counter | 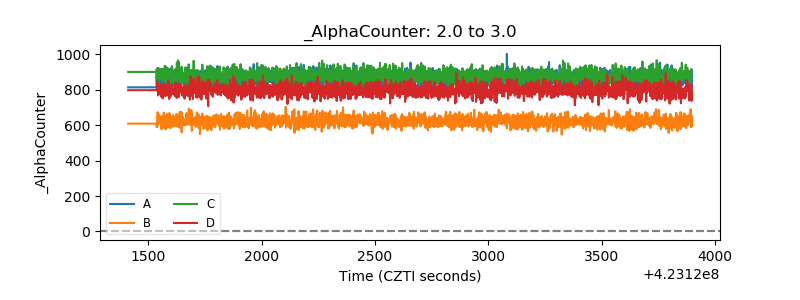 |
| _CPM_Rate | 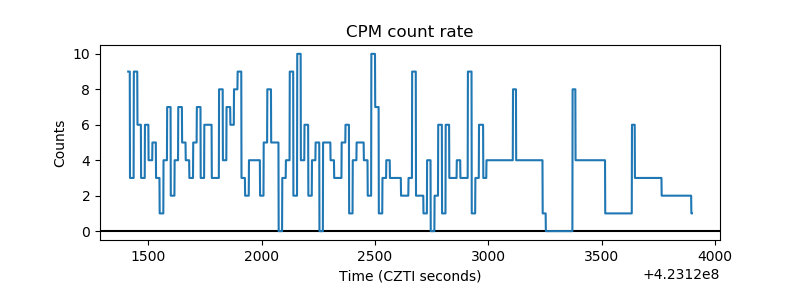 |
| CZT Counter | 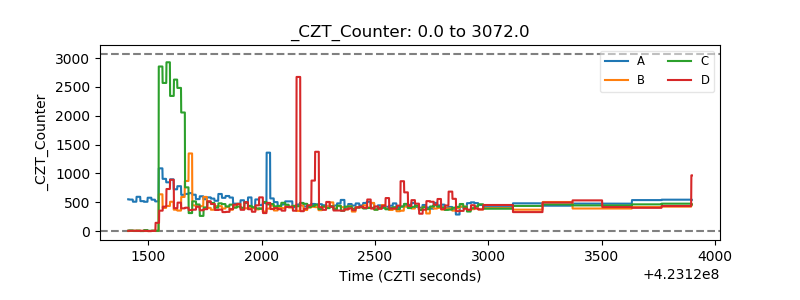 |
| +2.5 Volts monitor | 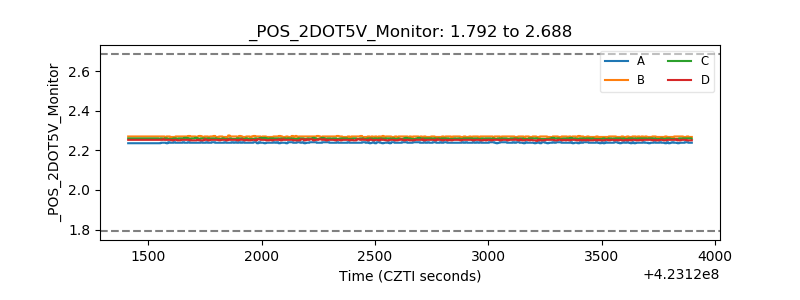 |
| +5 Volts monitor | 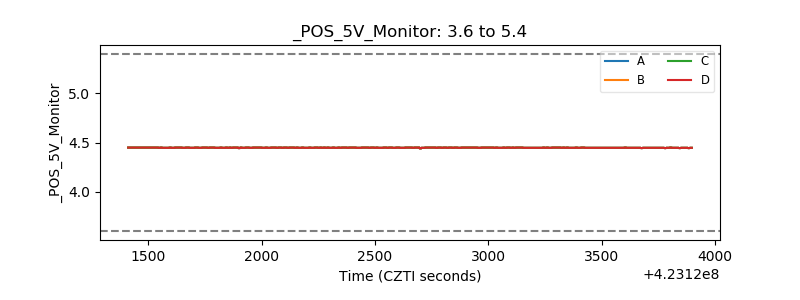 |
| _ROLL_ROT | 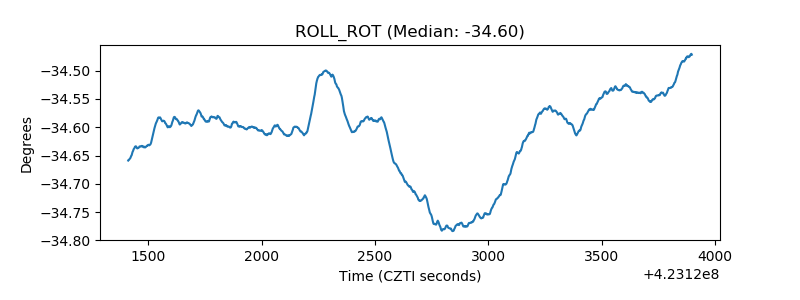 |
| _Roll_DEC | 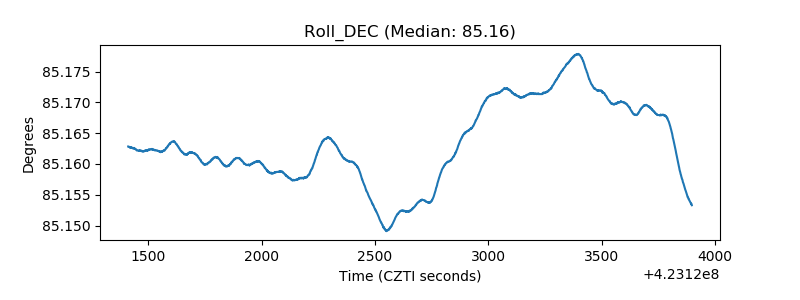 |
| _Roll_RA | 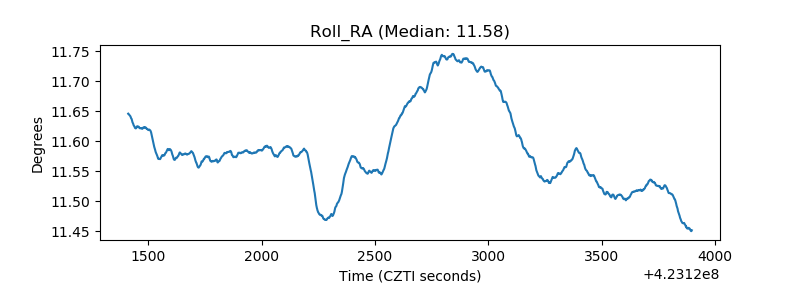 |
| Veto Counter | 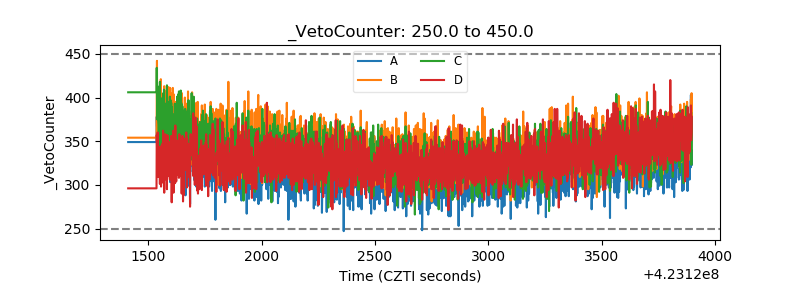 |