| Param | Original file | Final file |
|---|---|---|
| Filename | modeM0/AS1A12_014T01_9000005674_41469cztM0_level2.fits | modeM0/AS1A12_014T01_9000005674_41469cztM0_level2_quad_clean.evt |
| Size (bytes) | 213,534,720 | 53,896,320 |
| Size | 203.6 MB | 51.4 MB |
| Events in quadrant A | 1,733,622 | 363,535 |
| Events in quadrant B | 1,660,319 | 364,615 |
| Events in quadrant C | 1,836,503 | 343,880 |
| Events in quadrant D | 2,413,333 | 323,896 |
| Mode SS | |||
|---|---|---|---|
| Quadrant | BADHDUFLAG | Total packets | Discarded packets |
| A | 0 | 68 | 0 |
| B | 0 | 68 | 0 |
| C | 0 | 68 | 0 |
| D | 0 | 68 | 0 |
| Mode M9 | |||
|---|---|---|---|
| Quadrant | BADHDUFLAG | Total packets | Discarded packets |
| A | 0 | 16 | 0 |
| B | 0 | 16 | 0 |
| C | 0 | 16 | 0 |
| D | 0 | 16 | 0 |
| Mode M0 | |||
|---|---|---|---|
| Quadrant | BADHDUFLAG | Total packets | Discarded packets |
| A | 0 | 7236 | 2 |
| B | 0 | 7250 | 1 |
| C | 0 | 7563 | 1 |
| D | 0 | 9523 | 1 |
| Quadrant | Total seconds | Saturated seconds | Saturation percentage |
|---|---|---|---|
| A | 3328 | 7 | 0.210337% |
| B | 3328 | 67 | 2.013221% |
| C | 3328 | 117 | 3.515625% |
| D | 3328 | 108 | 3.245192% |
Noise dominated data is calculated using 1-second bins in cleaned event files. If a bin has >2000 counts, and if more than 50% of those come from <1% of pixels, then it is considered to be noise-dominated and hence unusable.
| Quadrant | # 1 sec bins | Bins with >0 counts | Bins with >2000 counts | High rate bins dominated by noise | Noise dominated (total time) | Noise dominated (detector-on time) | Marked lightcurve |
|---|---|---|---|---|---|---|---|
| A | 4911 | 3329 | 2 | 2 | 0.04% | 0.06% | 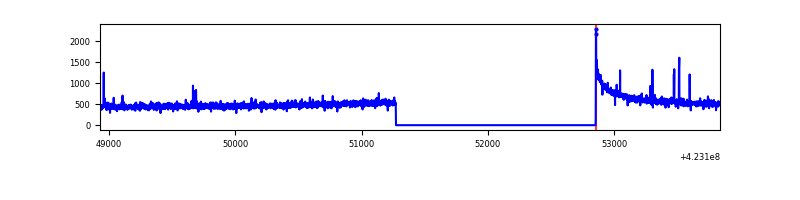 |
| B | 4911 | 3329 | 38 | 38 | 0.77% | 1.14% | 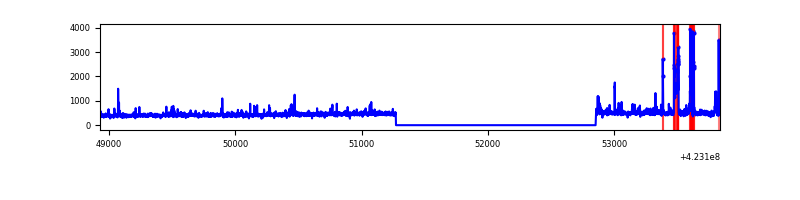 |
| C | 4911 | 3329 | 112 | 112 | 2.28% | 3.36% | 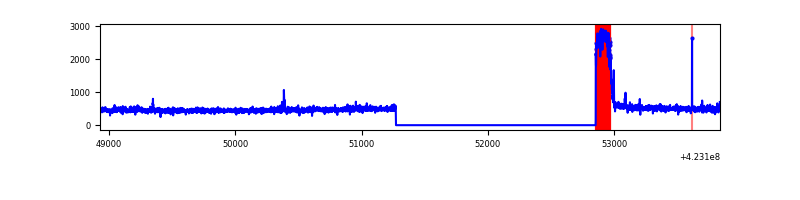 |
| D | 4911 | 3329 | 102 | 102 | 2.08% | 3.06% | 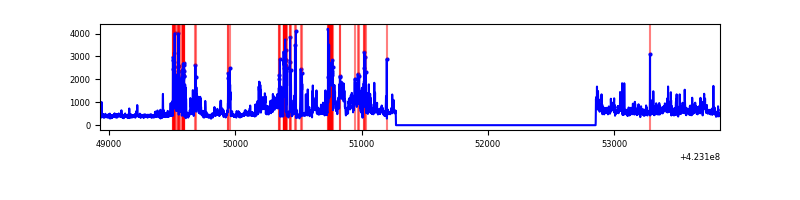 |
Top three noisy pixels from each quadrant. If the there are fewer than three noisy pixels in the level2.evt file, extra rows are filled as -1
| Pixel properties | Quadrant properties | ||||||
|---|---|---|---|---|---|---|---|
| Quadrant | DetID | PixID | Counts | Sigma | Mean | Median | Sigma |
| A | 10 | 83 | 315354 | 4151.82 | 362 | 353 | 75.9 |
| A | 2 | 79 | 8796 | 111.28 | 362 | 353 | 75.9 |
| A | 13 | 248 | 6552 | 81.7 | 362 | 353 | 75.9 |
| B | 0 | 190 | 95724 | 1355.82 | 356 | 346 | 70.3 |
| B | 15 | 35 | 70624 | 999.02 | 356 | 346 | 70.3 |
| B | 5 | 255 | 53625 | 757.37 | 356 | 346 | 70.3 |
| C | 0 | 10 | 322271 | 3915.54 | 345 | 346 | 82.2 |
| C | 15 | 214 | 135798 | 1647.49 | 345 | 346 | 82.2 |
| C | 12 | 249 | 12900 | 152.69 | 345 | 346 | 82.2 |
| D | 1 | 47 | 280868 | 3207.13 | 350 | 339 | 87.5 |
| D | 12 | 79 | 252156 | 2878.88 | 350 | 339 | 87.5 |
| D | 13 | 249 | 220394 | 2515.76 | 350 | 339 | 87.5 |
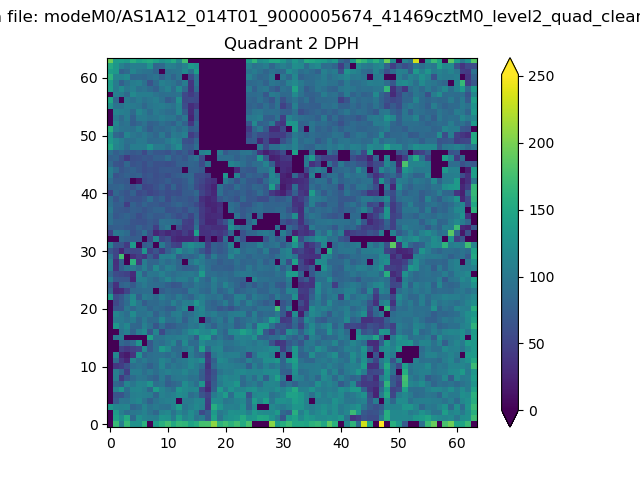
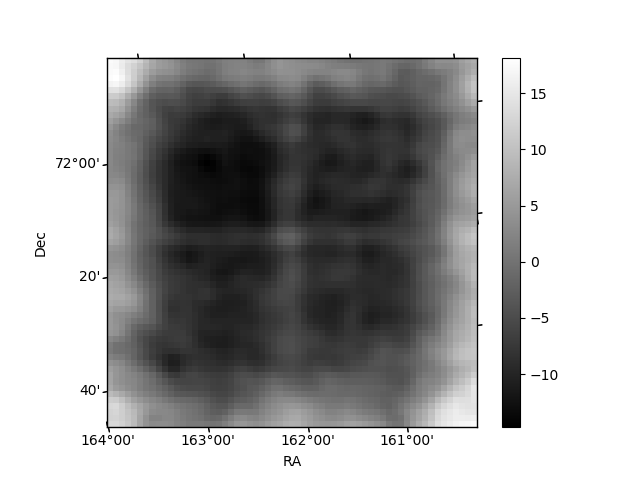
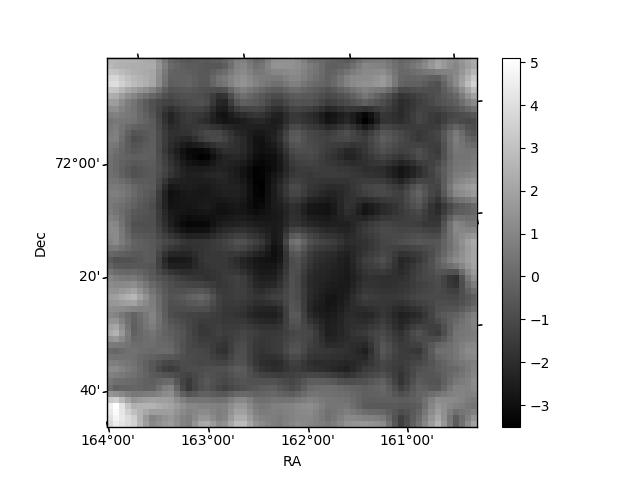
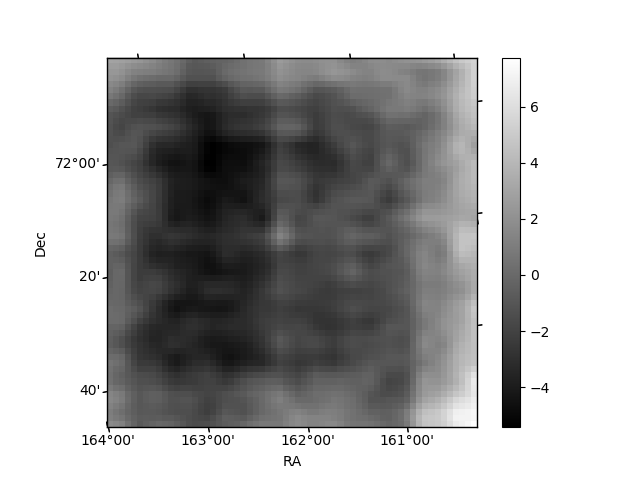
Histogram calculated using DETX and DETY for each event in the final _common_clean file
| Quadrant A | 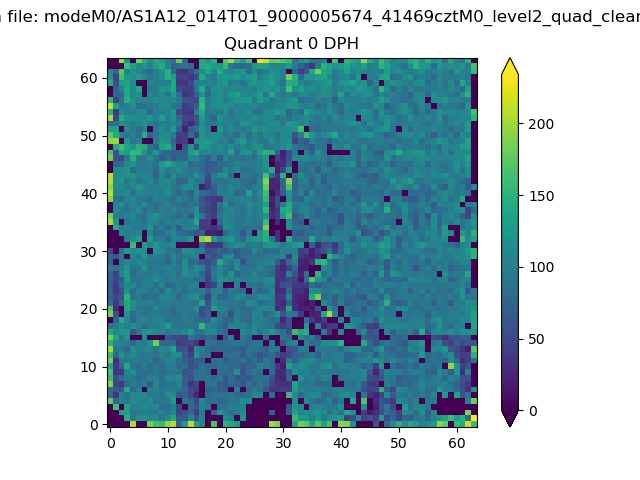 |
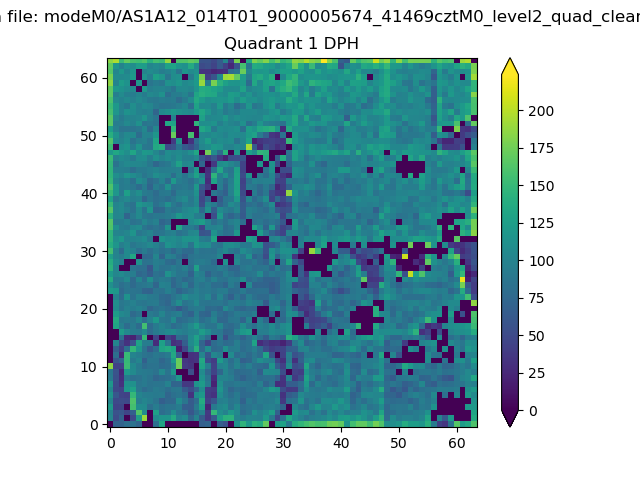 |
Quadrant B |
|---|---|---|---|
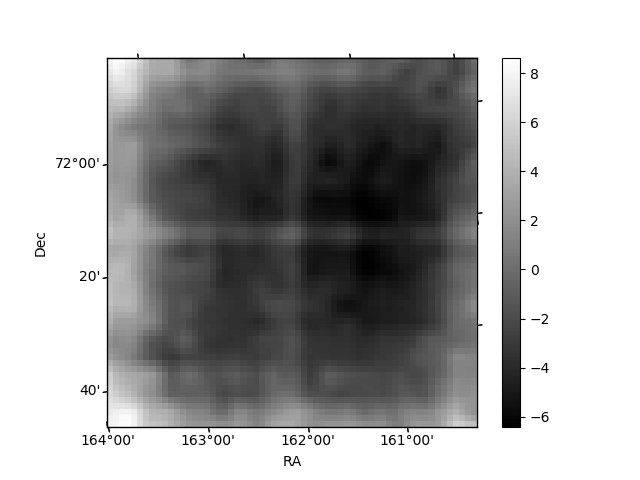
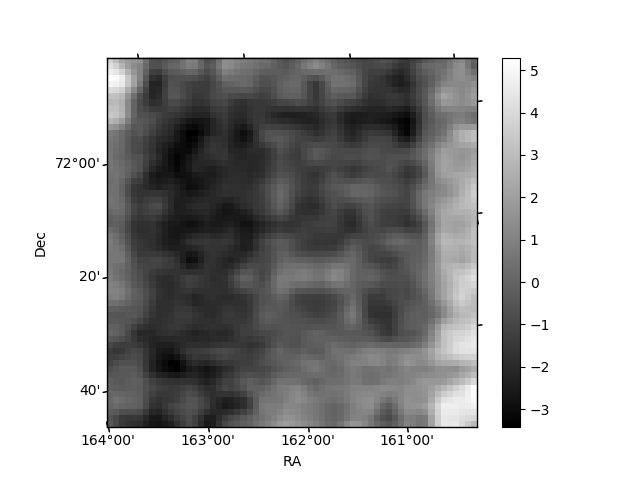
| Quadrant D | 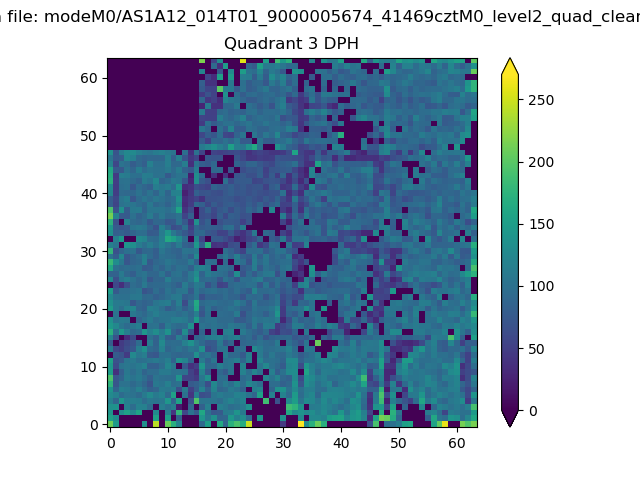 |
 |
Quadrant C |
| Plot type | Count rate plots | Images |
|---|---|---|
| Comparison with Poisson distribution Blue bars denote a histogram of data divided into 1 sec bins. Red curve is a Poisson curve with rate = median count rate of data. |
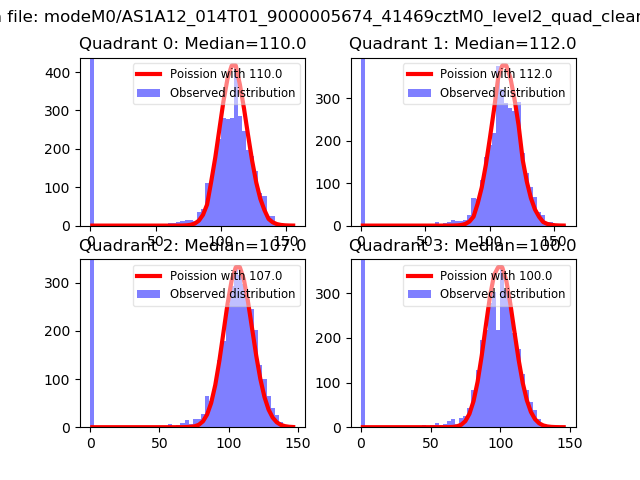 |
 |
| Quadrant-wise count rates Data is divided into 100 sec bins |
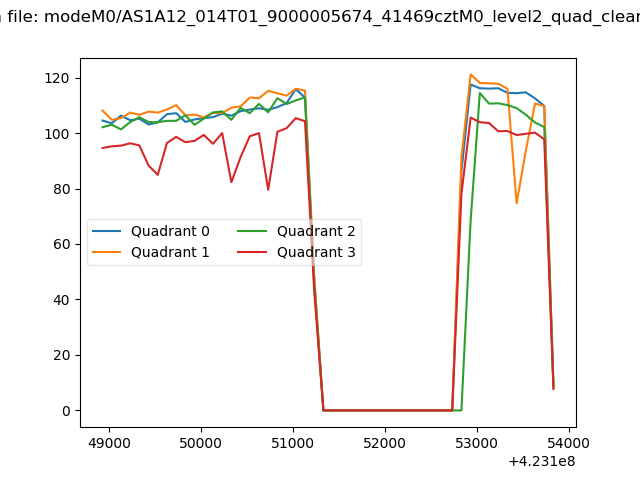 |
|
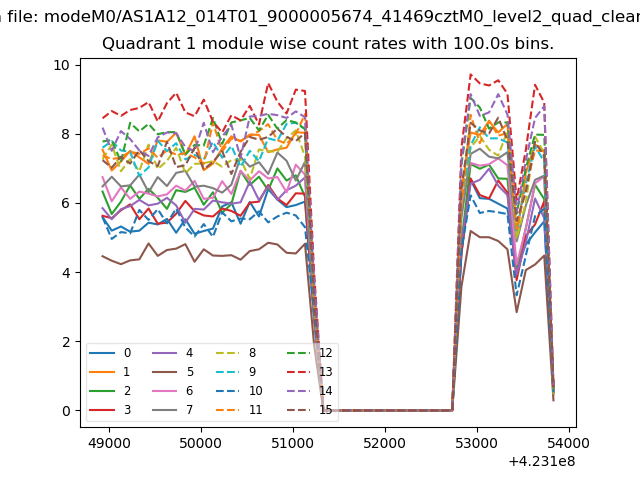
| Module-wise count rates for Quadrant A Data is divided into 100 sec bins |
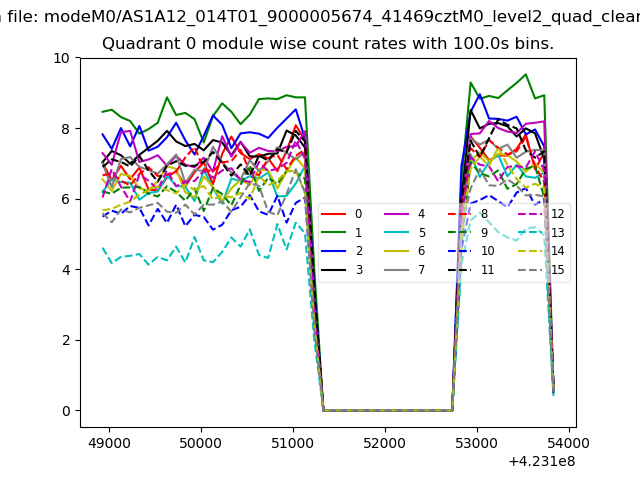 |
 |
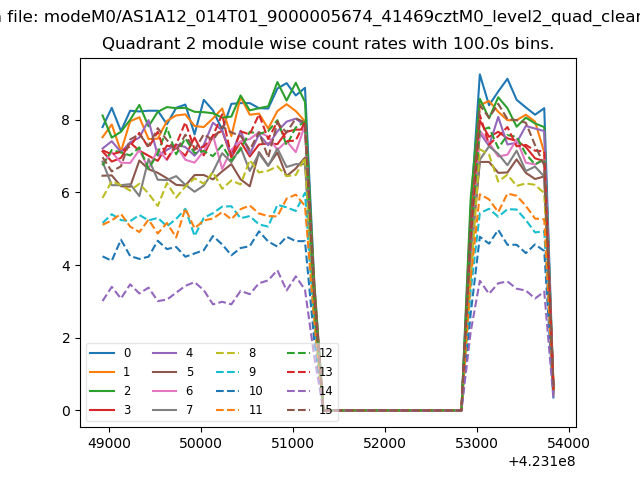
| Module-wise count rates for Quadrant B Data is divided into 100 sec bins |
 |
 |
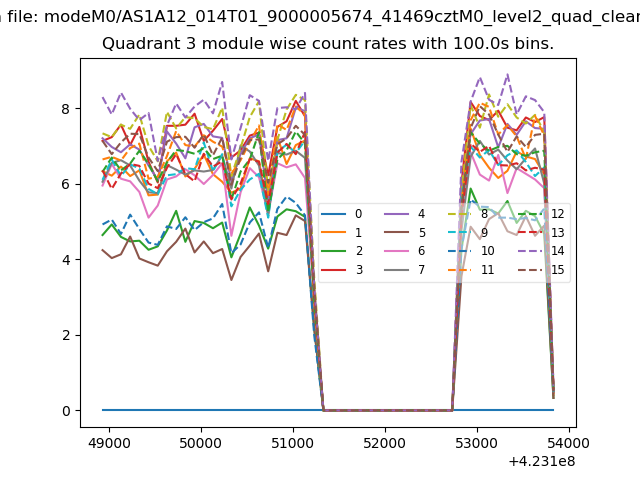
| Module-wise count rates for Quadrant C Data is divided into 100 sec bins |
 |
 |
| Module-wise count rates for Quadrant D Data is divided into 100 sec bins |
 |
 |
| Parameter | Plot |
|---|---|
| CZT HV Monitor | 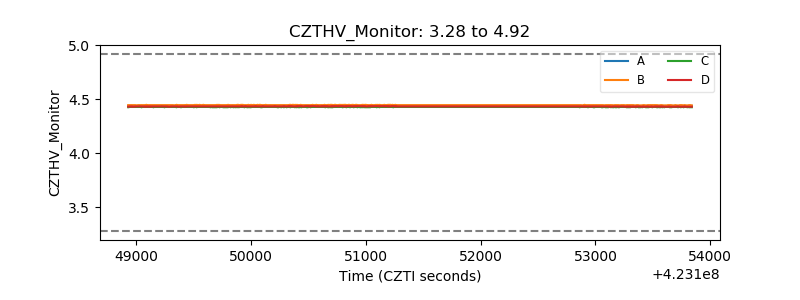 |
| D_VDD | 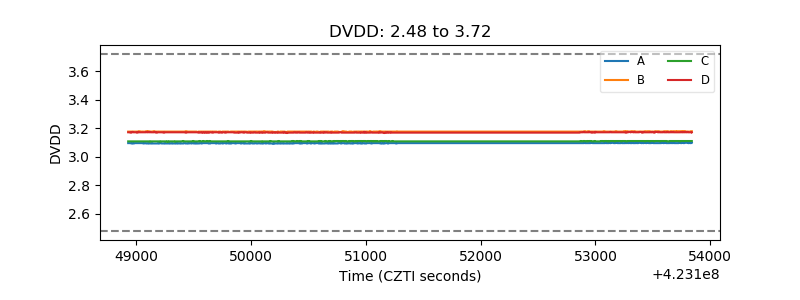 |
| Temperature 1 | 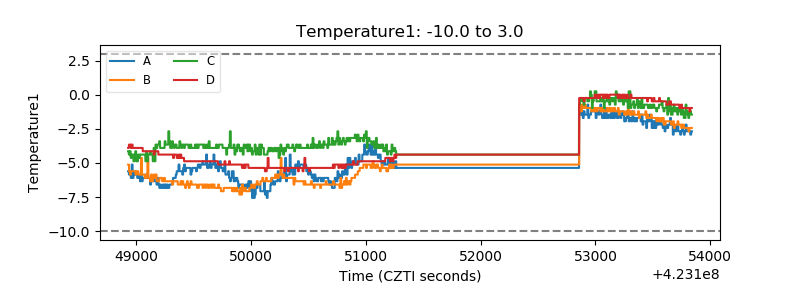 |
| Veto HV Monitor | 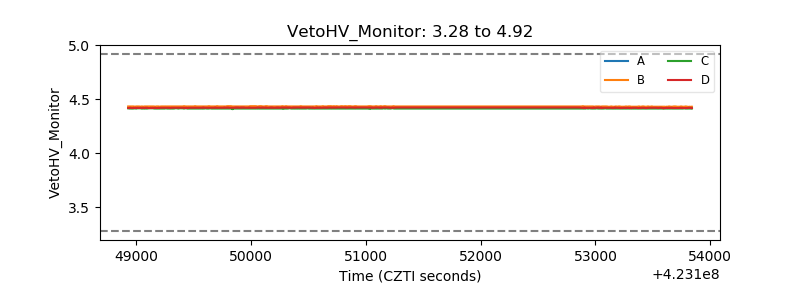 |
| Veto LLD | 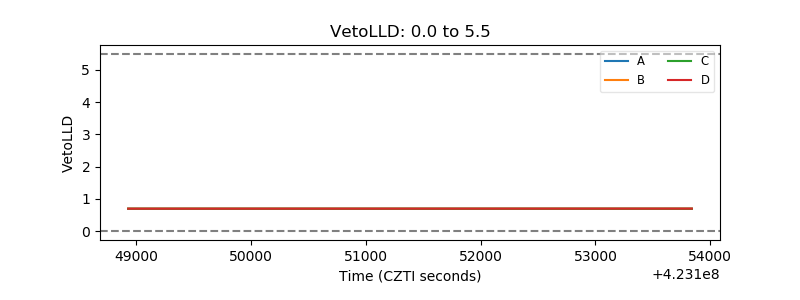 |
| Alpha Counter | 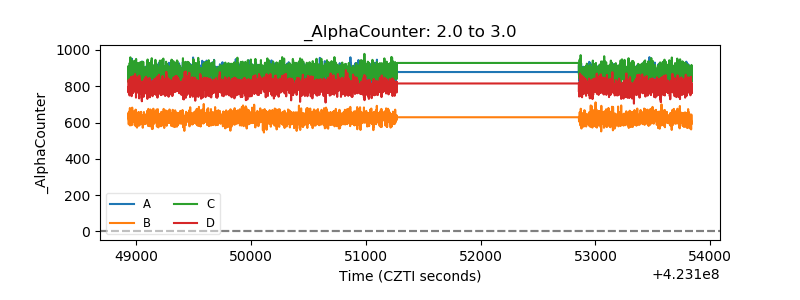 |
| _CPM_Rate | 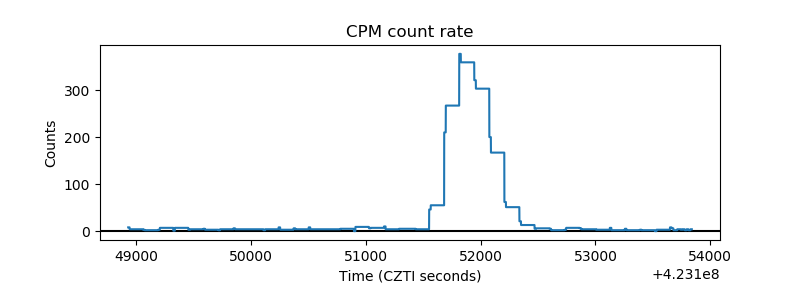 |
| CZT Counter | 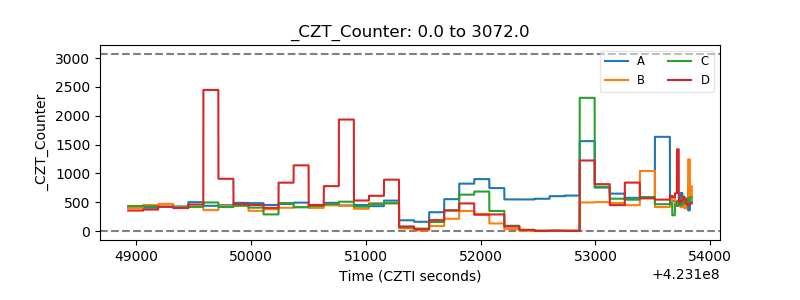 |
| +2.5 Volts monitor | 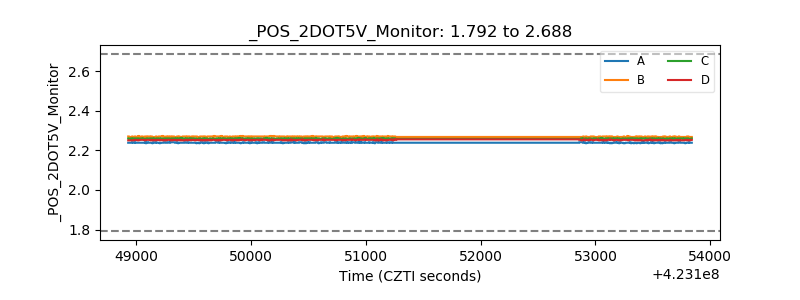 |
| +5 Volts monitor | 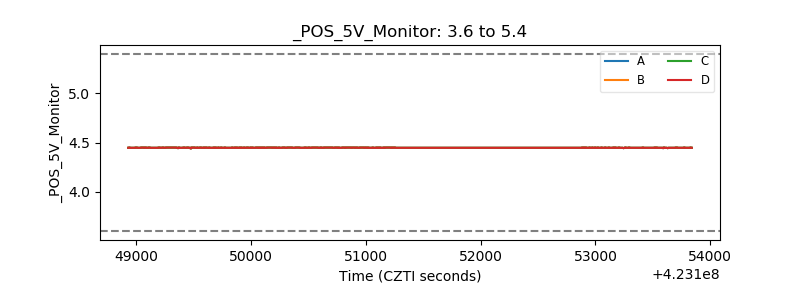 |
| _ROLL_ROT | 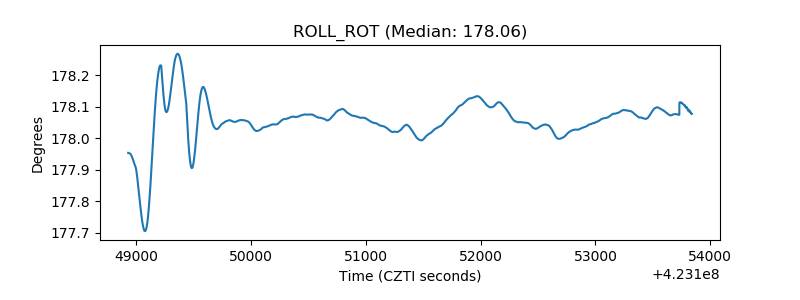 |
| _Roll_DEC | 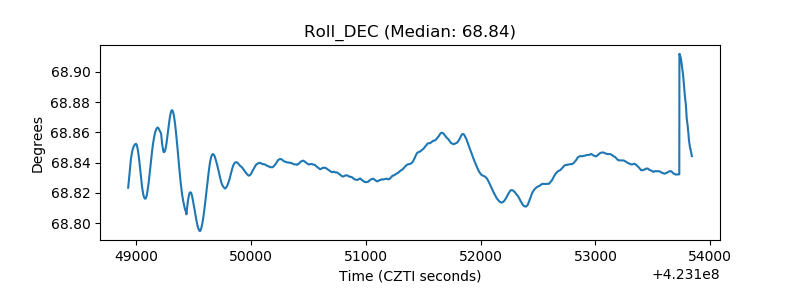 |
| _Roll_RA | 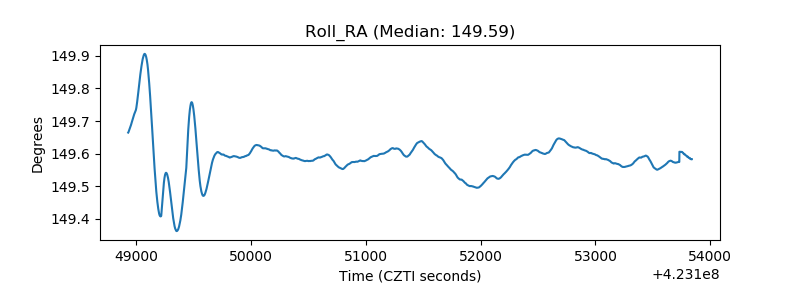 |
| Veto Counter | 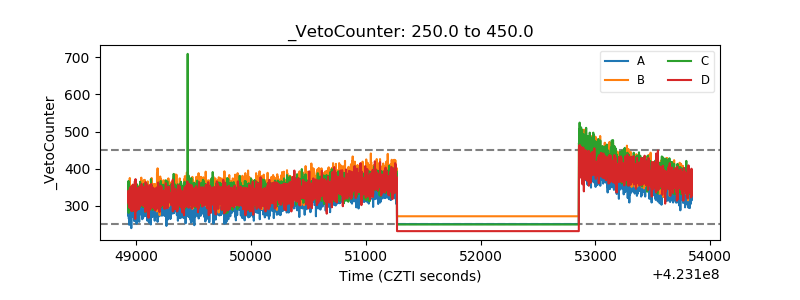 |