| Param | Original file | Final file |
|---|---|---|
| Filename | modeM0/AS1A12_014T01_9000005674_41470cztM0_level2.fits | modeM0/AS1A12_014T01_9000005674_41470cztM0_level2_quad_clean.evt |
| Size (bytes) | 349,611,840 | 85,147,200 |
| Size | 333.4 MB | 81.2 MB |
| Events in quadrant A | 2,683,041 | 575,944 |
| Events in quadrant B | 2,737,785 | 578,570 |
| Events in quadrant C | 2,913,807 | 547,696 |
| Events in quadrant D | 4,197,770 | 507,631 |
| Mode SS | |||
|---|---|---|---|
| Quadrant | BADHDUFLAG | Total packets | Discarded packets |
| A | 0 | 108 | 0 |
| B | 0 | 108 | 0 |
| C | 0 | 108 | 0 |
| D | 0 | 108 | 0 |
| Mode M9 | |||
|---|---|---|---|
| Quadrant | BADHDUFLAG | Total packets | Discarded packets |
| A | 0 | 17 | 0 |
| B | 0 | 17 | 0 |
| C | 0 | 17 | 0 |
| D | 0 | 17 | 0 |
| Mode M0 | |||
|---|---|---|---|
| Quadrant | BADHDUFLAG | Total packets | Discarded packets |
| A | 0 | 11295 | 2 |
| B | 0 | 11756 | 1 |
| C | 0 | 12011 | 1 |
| D | 0 | 16029 | 1 |
| Quadrant | Total seconds | Saturated seconds | Saturation percentage |
|---|---|---|---|
| A | 5255 | 12 | 0.228354% |
| B | 5255 | 84 | 1.598478% |
| C | 5255 | 163 | 3.101808% |
| D | 5255 | 216 | 4.110371% |
Noise dominated data is calculated using 1-second bins in cleaned event files. If a bin has >2000 counts, and if more than 50% of those come from <1% of pixels, then it is considered to be noise-dominated and hence unusable.
| Quadrant | # 1 sec bins | Bins with >0 counts | Bins with >2000 counts | High rate bins dominated by noise | Noise dominated (total time) | Noise dominated (detector-on time) | Marked lightcurve |
|---|---|---|---|---|---|---|---|
| A | 6958 | 5256 | 2 | 2 | 0.03% | 0.04% | 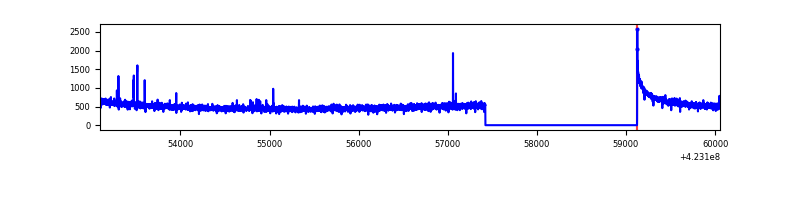 |
| B | 6958 | 5256 | 46 | 46 | 0.66% | 0.88% | 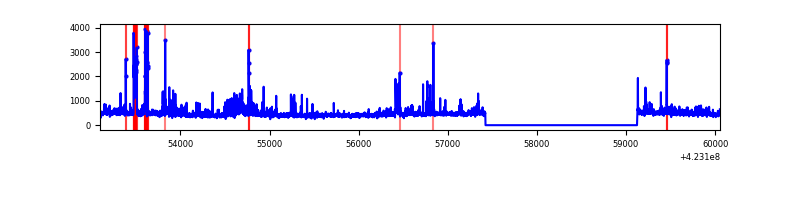 |
| C | 6958 | 5256 | 139 | 139 | 2.00% | 2.64% | 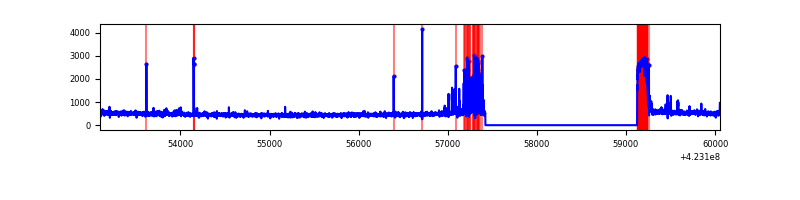 |
| D | 6958 | 5256 | 256 | 256 | 3.68% | 4.87% | 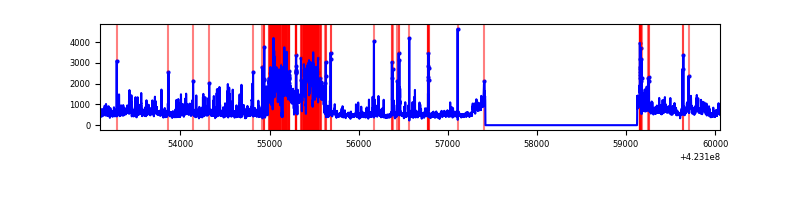 |
Top three noisy pixels from each quadrant. If the there are fewer than three noisy pixels in the level2.evt file, extra rows are filled as -1
| Pixel properties | Quadrant properties | ||||||
|---|---|---|---|---|---|---|---|
| Quadrant | DetID | PixID | Counts | Sigma | Mean | Median | Sigma |
| A | 10 | 83 | 488900 | 4224.86 | 562 | 549 | 115.6 |
| A | 2 | 79 | 12571 | 104.01 | 562 | 549 | 115.6 |
| A | 13 | 254 | 8079 | 65.14 | 562 | 549 | 115.6 |
| B | 0 | 190 | 234951 | 2189.5 | 557 | 541 | 107.1 |
| B | 0 | 245 | 128182 | 1192.23 | 557 | 541 | 107.1 |
| B | 5 | 255 | 72058 | 668.0 | 557 | 541 | 107.1 |
| C | 0 | 10 | 352039 | 2737.44 | 544 | 546 | 128.4 |
| C | 15 | 214 | 215462 | 1673.77 | 544 | 546 | 128.4 |
| C | 4 | 254 | 171707 | 1333.01 | 544 | 546 | 128.4 |
| D | 5 | 222 | 1049171 | 7900.27 | 547 | 532 | 132.7 |
| D | 12 | 79 | 424517 | 3194.23 | 547 | 532 | 132.7 |
| D | 1 | 47 | 290159 | 2182.0 | 547 | 532 | 132.7 |
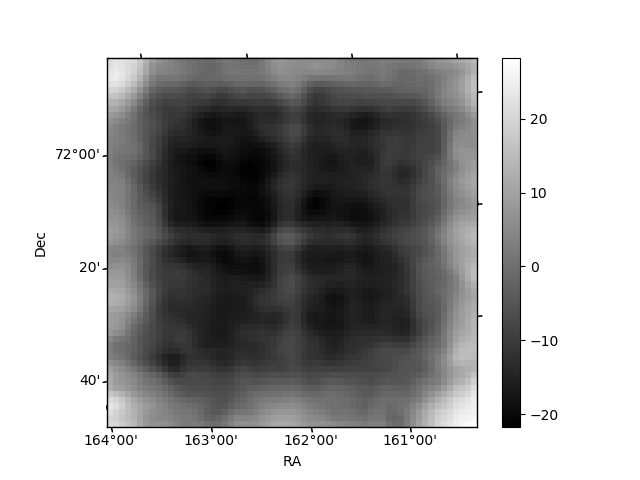
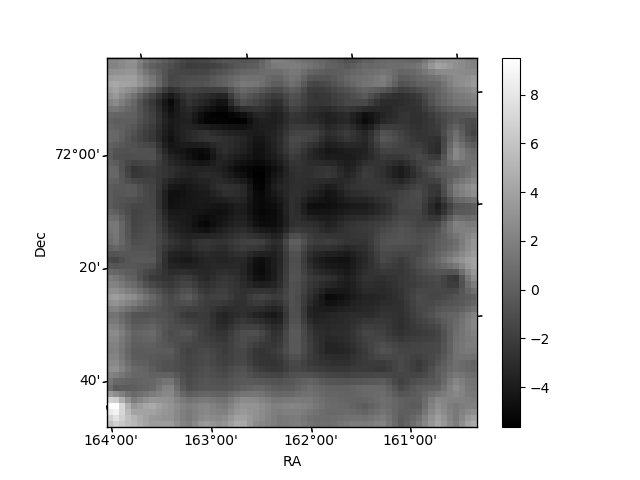
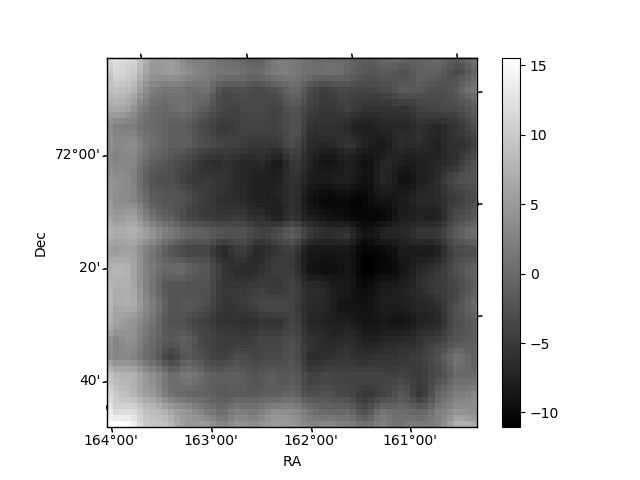
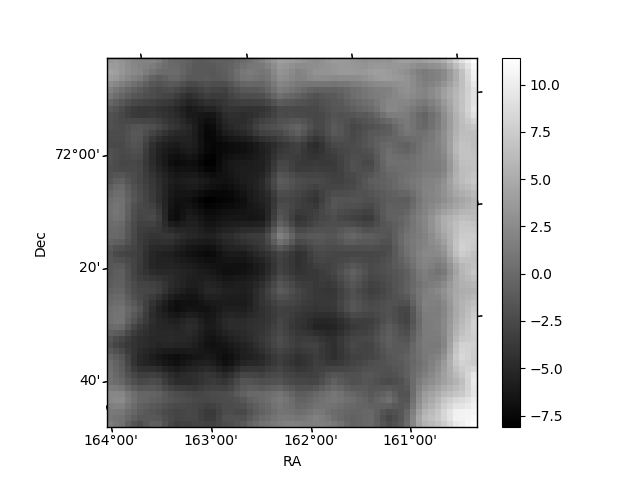
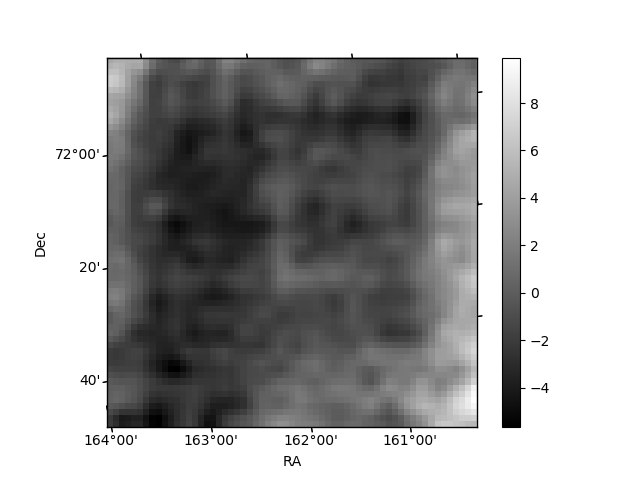
Histogram calculated using DETX and DETY for each event in the final _common_clean file
| Quadrant A | 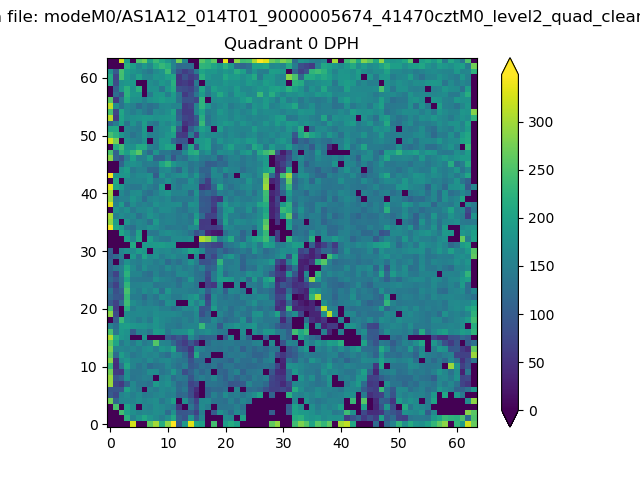 |
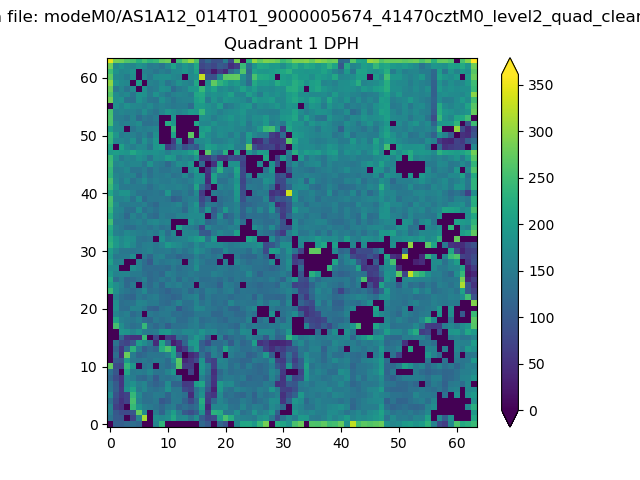 |
Quadrant B |
|---|---|---|---|
| Quadrant D | 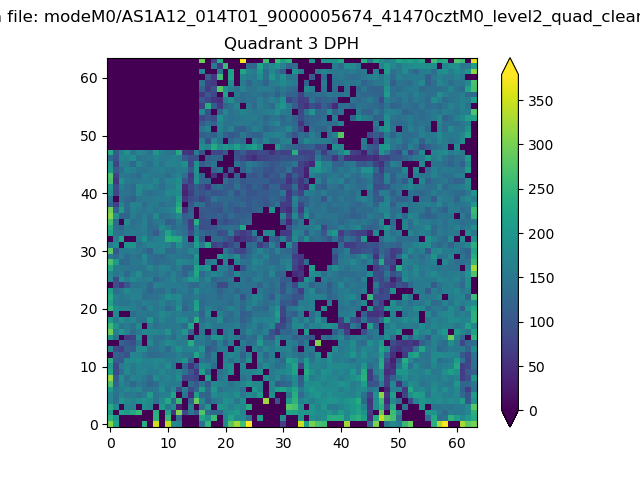 |
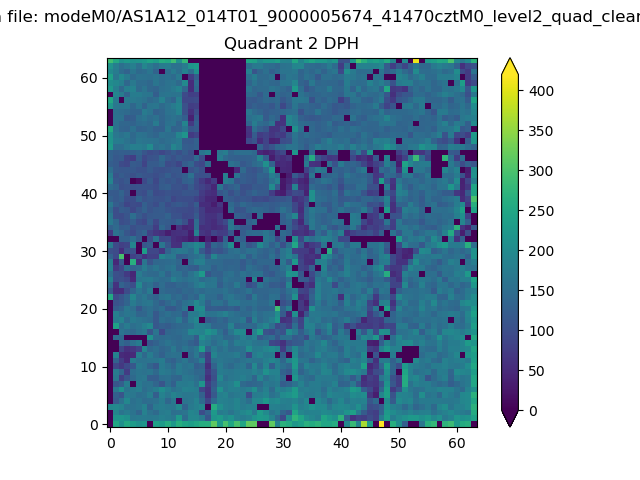 |
Quadrant C |
| Plot type | Count rate plots | Images |
|---|---|---|
| Comparison with Poisson distribution Blue bars denote a histogram of data divided into 1 sec bins. Red curve is a Poisson curve with rate = median count rate of data. |
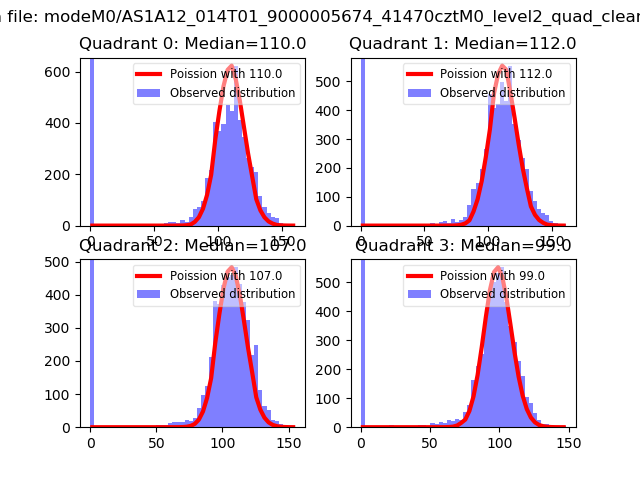 |
 |
| Quadrant-wise count rates Data is divided into 100 sec bins |
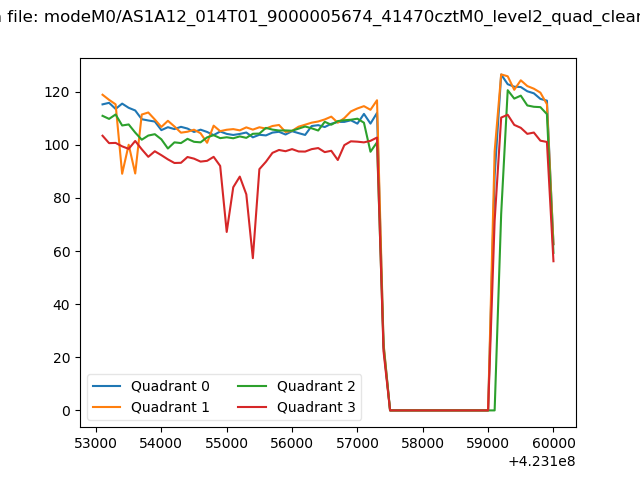 |
|
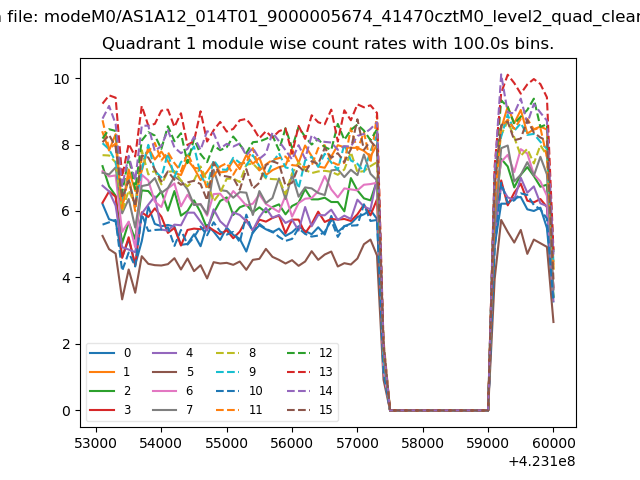
| Module-wise count rates for Quadrant A Data is divided into 100 sec bins |
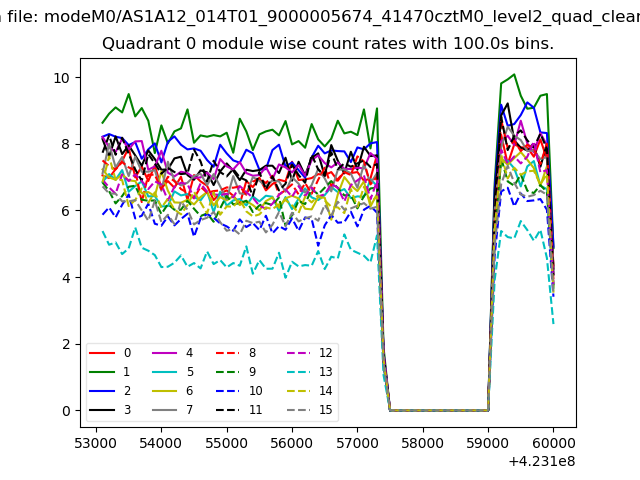 |
 |
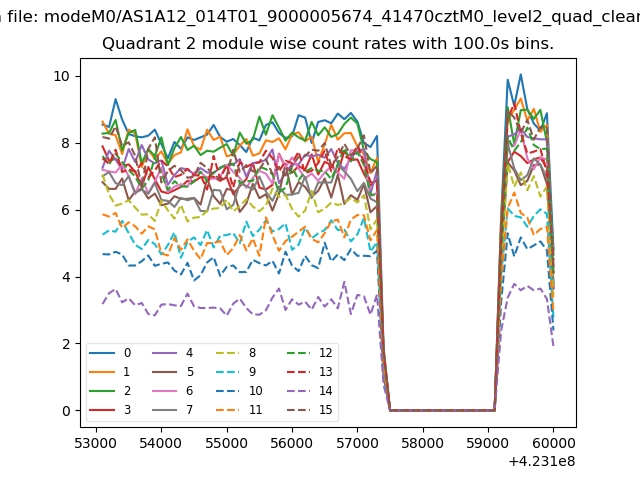
| Module-wise count rates for Quadrant B Data is divided into 100 sec bins |
 |
 |
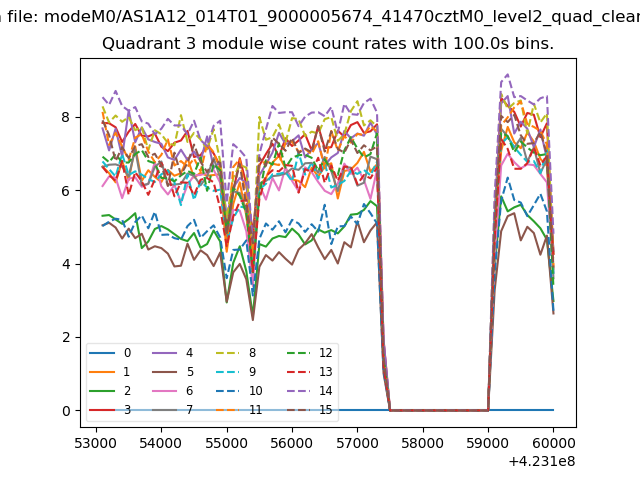
| Module-wise count rates for Quadrant C Data is divided into 100 sec bins |
 |
 |
| Module-wise count rates for Quadrant D Data is divided into 100 sec bins |
 |
 |
| Parameter | Plot |
|---|---|
| CZT HV Monitor | 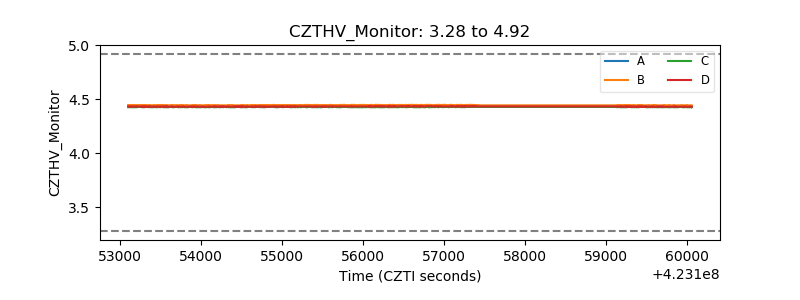 |
| D_VDD | 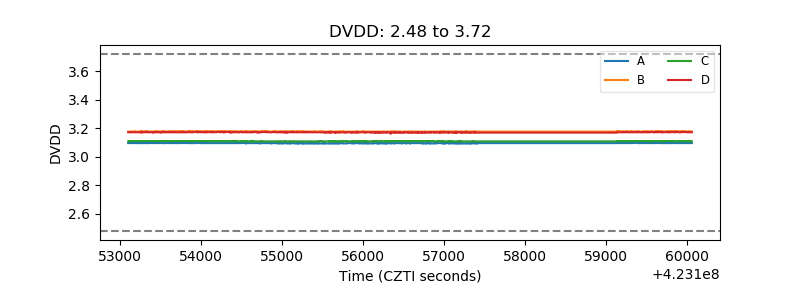 |
| Temperature 1 | 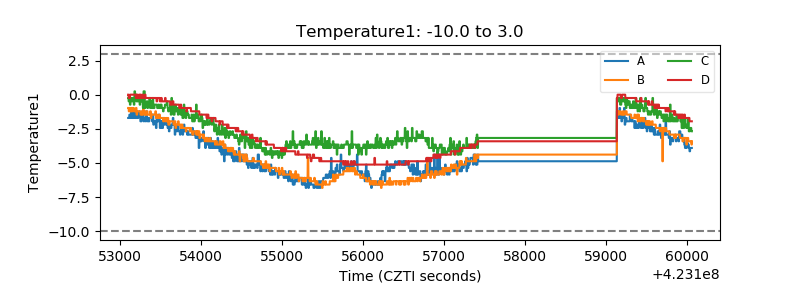 |
| Veto HV Monitor | 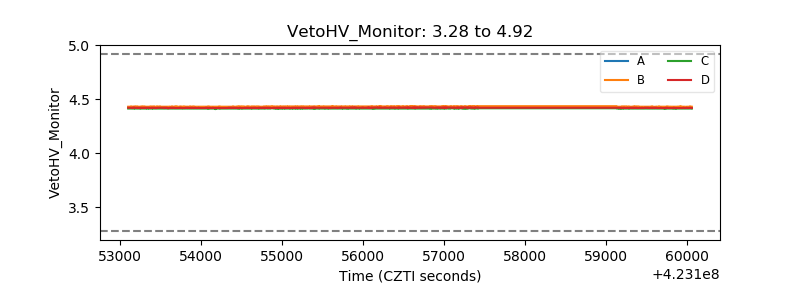 |
| Veto LLD |  |
| Alpha Counter | 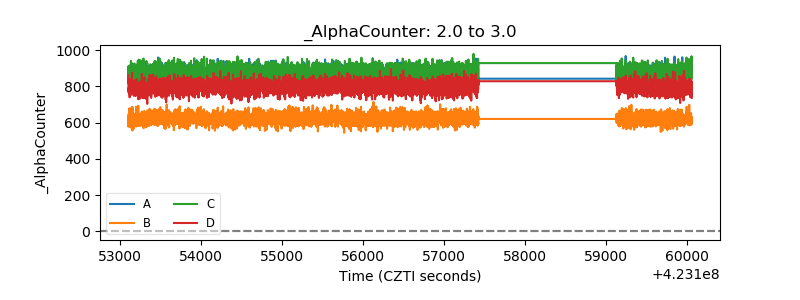 |
| _CPM_Rate | 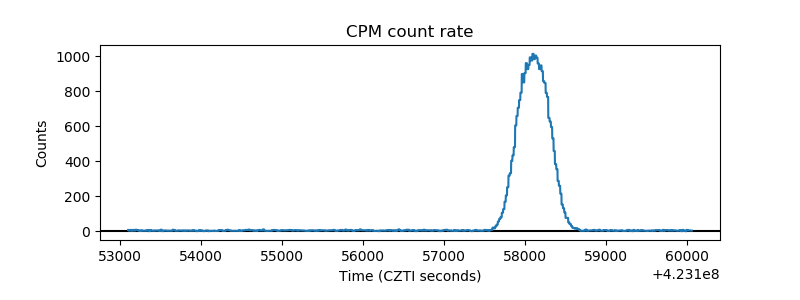 |
| CZT Counter | 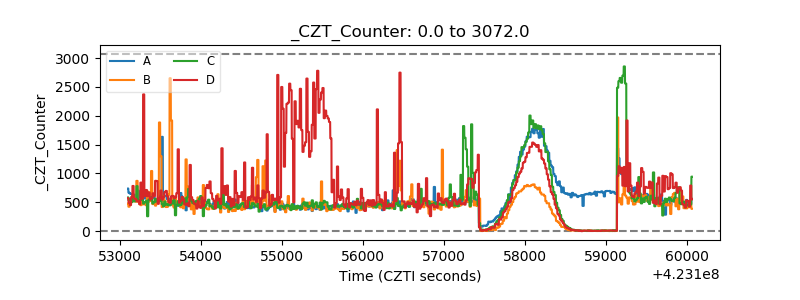 |
| +2.5 Volts monitor |  |
| +5 Volts monitor | 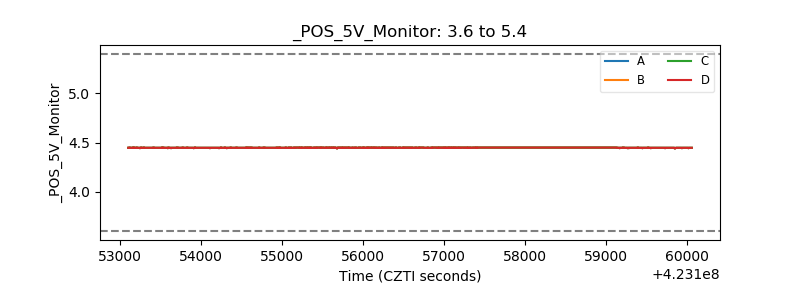 |
| _ROLL_ROT | 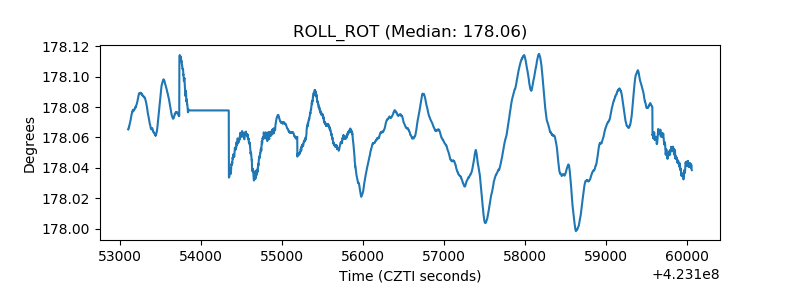 |
| _Roll_DEC | 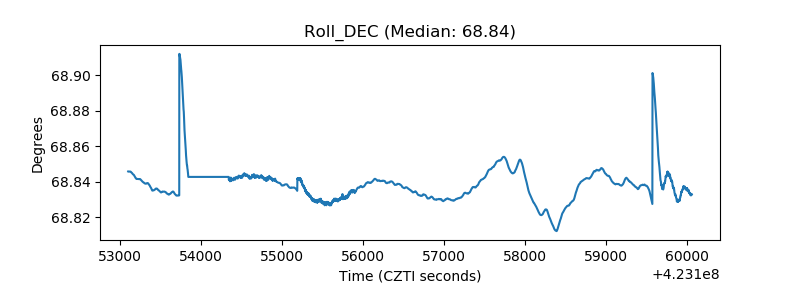 |
| _Roll_RA | 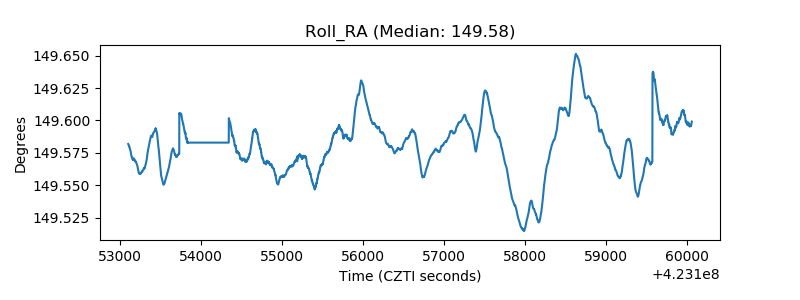 |
| Veto Counter | 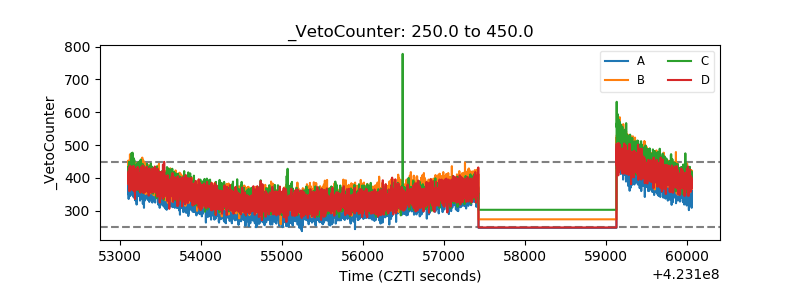 |