| Param | Original file | Final file |
|---|---|---|
| Filename | modeM0/AS1A12_014T01_9000005674_41472cztM0_level2.fits | modeM0/AS1A12_014T01_9000005674_41472cztM0_level2_quad_clean.evt |
| Size (bytes) | 357,606,720 | 87,822,720 |
| Size | 341.0 MB | 83.8 MB |
| Events in quadrant A | 2,788,108 | 594,686 |
| Events in quadrant B | 2,715,423 | 608,258 |
| Events in quadrant C | 3,022,839 | 564,144 |
| Events in quadrant D | 4,302,721 | 524,893 |
| Mode SS | |||
|---|---|---|---|
| Quadrant | BADHDUFLAG | Total packets | Discarded packets |
| A | 0 | 106 | 0 |
| B | 0 | 106 | 0 |
| C | 0 | 106 | 0 |
| D | 0 | 106 | 0 |
| Mode M9 | |||
|---|---|---|---|
| Quadrant | BADHDUFLAG | Total packets | Discarded packets |
| A | 0 | 19 | 0 |
| B | 0 | 19 | 0 |
| C | 0 | 19 | 0 |
| D | 0 | 20 | 0 |
| Mode M0 | |||
|---|---|---|---|
| Quadrant | BADHDUFLAG | Total packets | Discarded packets |
| A | 0 | 11625 | 3 |
| B | 0 | 11710 | 2 |
| C | 0 | 12310 | 2 |
| D | 0 | 16461 | 2 |
| Quadrant | Total seconds | Saturated seconds | Saturation percentage |
|---|---|---|---|
| A | 5245 | 14 | 0.266921% |
| B | 5245 | 40 | 0.762631% |
| C | 5245 | 231 | 4.404194% |
| D | 5245 | 243 | 4.632984% |
Noise dominated data is calculated using 1-second bins in cleaned event files. If a bin has >2000 counts, and if more than 50% of those come from <1% of pixels, then it is considered to be noise-dominated and hence unusable.
| Quadrant | # 1 sec bins | Bins with >0 counts | Bins with >2000 counts | High rate bins dominated by noise | Noise dominated (total time) | Noise dominated (detector-on time) | Marked lightcurve |
|---|---|---|---|---|---|---|---|
| A | 7067 | 5246 | 5 | 5 | 0.07% | 0.10% | 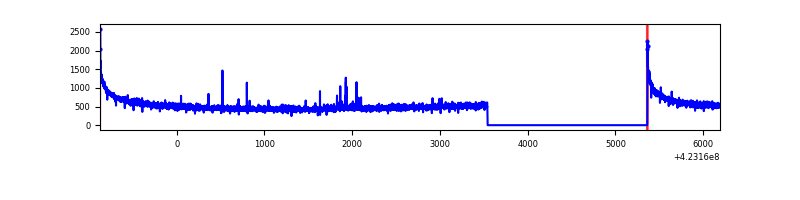 |
| B | 7067 | 5246 | 24 | 24 | 0.34% | 0.46% | 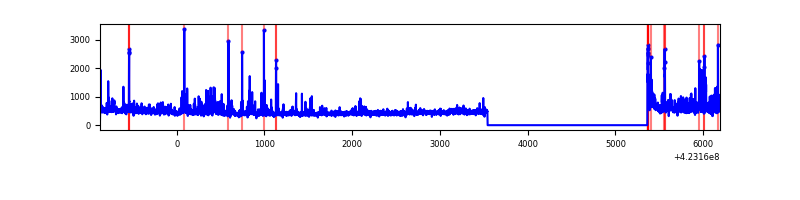 |
| C | 7067 | 5246 | 213 | 213 | 3.01% | 4.06% | 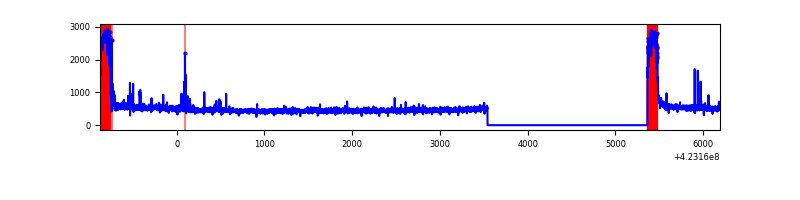 |
| D | 7067 | 5246 | 219 | 219 | 3.10% | 4.17% | 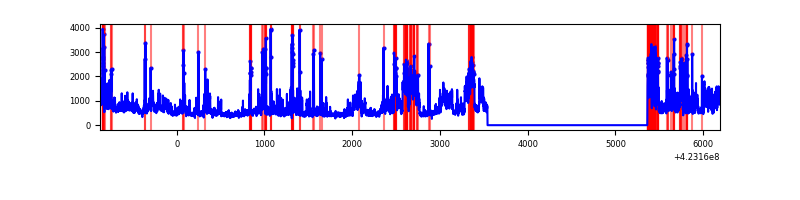 |
Top three noisy pixels from each quadrant. If the there are fewer than three noisy pixels in the level2.evt file, extra rows are filled as -1
| Pixel properties | Quadrant properties | ||||||
|---|---|---|---|---|---|---|---|
| Quadrant | DetID | PixID | Counts | Sigma | Mean | Median | Sigma |
| A | 10 | 83 | 558406 | 4796.79 | 568 | 556 | 116.3 |
| A | 13 | 248 | 19262 | 160.85 | 568 | 556 | 116.3 |
| A | 2 | 79 | 8522 | 68.5 | 568 | 556 | 116.3 |
| B | 0 | 190 | 209561 | 1927.92 | 569 | 553 | 108.4 |
| B | 5 | 255 | 89640 | 821.75 | 569 | 553 | 108.4 |
| B | 0 | 245 | 50872 | 464.15 | 569 | 553 | 108.4 |
| C | 0 | 10 | 616335 | 4846.0 | 544 | 546 | 127.1 |
| C | 15 | 214 | 213067 | 1672.45 | 544 | 546 | 127.1 |
| C | 4 | 254 | 33323 | 257.94 | 544 | 546 | 127.1 |
| D | 12 | 79 | 1113174 | 8211.8 | 553 | 538 | 135.5 |
| D | 1 | 52 | 243772 | 1795.19 | 553 | 538 | 135.5 |
| D | 1 | 47 | 218743 | 1610.46 | 553 | 538 | 135.5 |
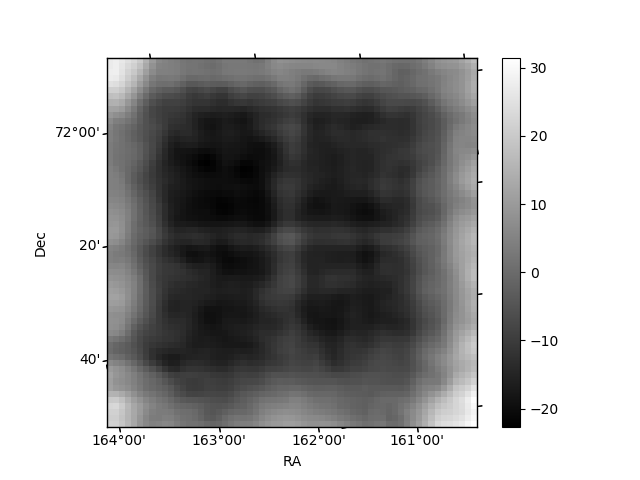
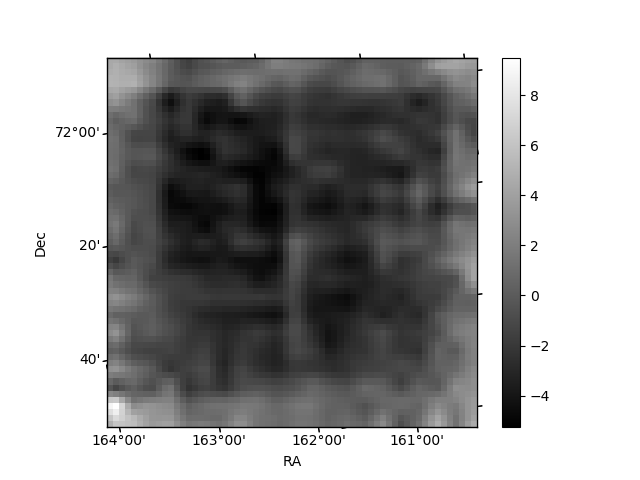
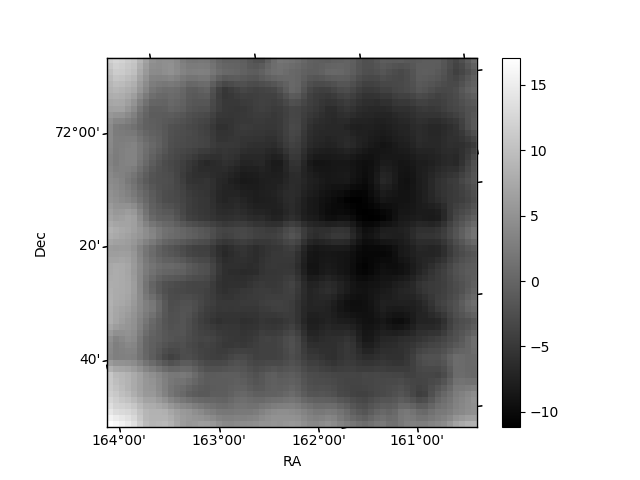
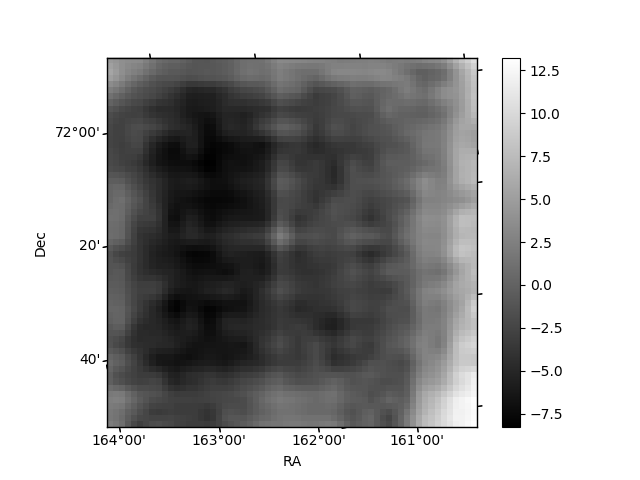
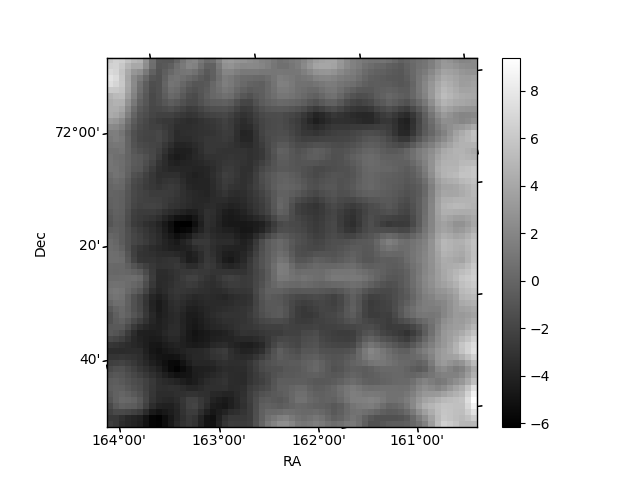
Histogram calculated using DETX and DETY for each event in the final _common_clean file
| Quadrant A | 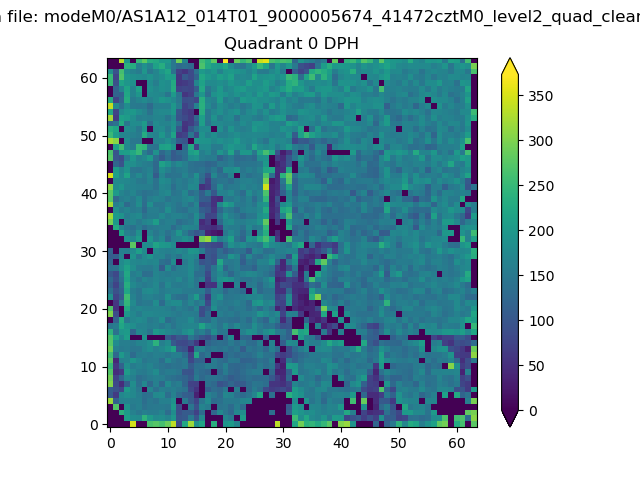 |
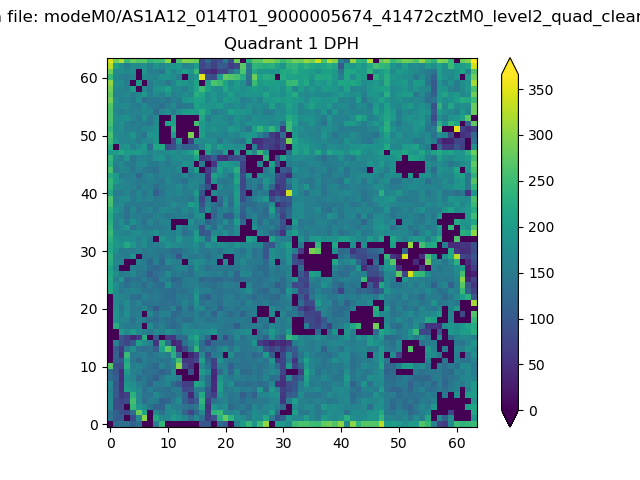 |
Quadrant B |
|---|---|---|---|
| Quadrant D | 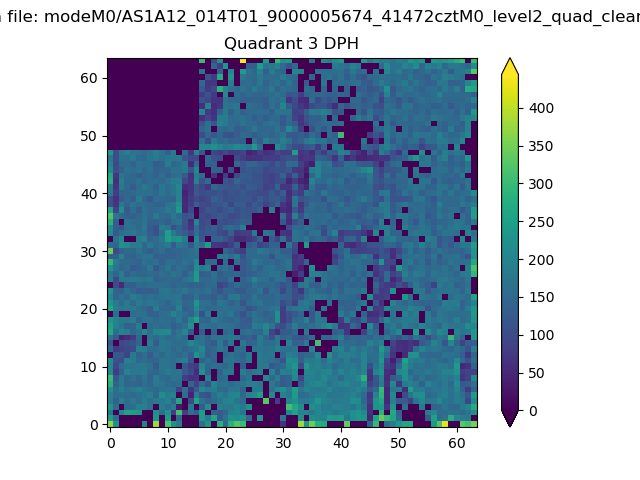 |
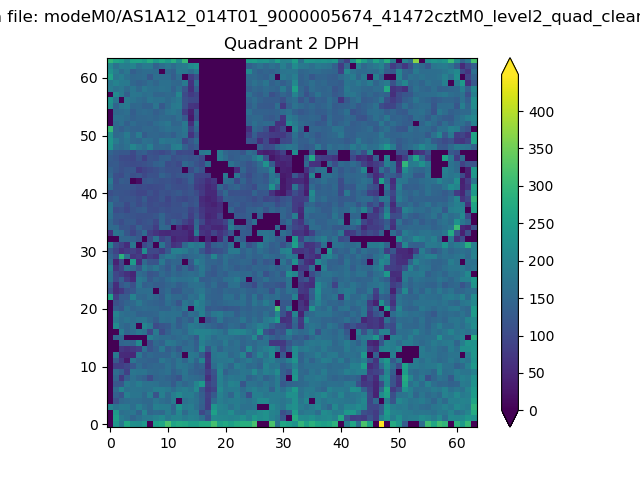 |
Quadrant C |
| Plot type | Count rate plots | Images |
|---|---|---|
| Comparison with Poisson distribution Blue bars denote a histogram of data divided into 1 sec bins. Red curve is a Poisson curve with rate = median count rate of data. |
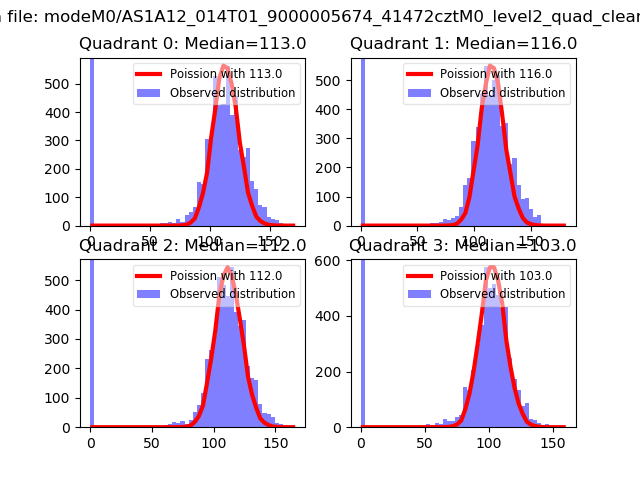 |
 |
| Quadrant-wise count rates Data is divided into 100 sec bins |
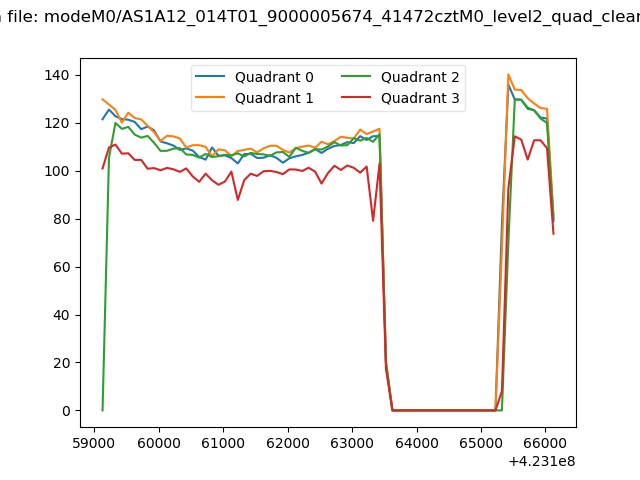 |
|
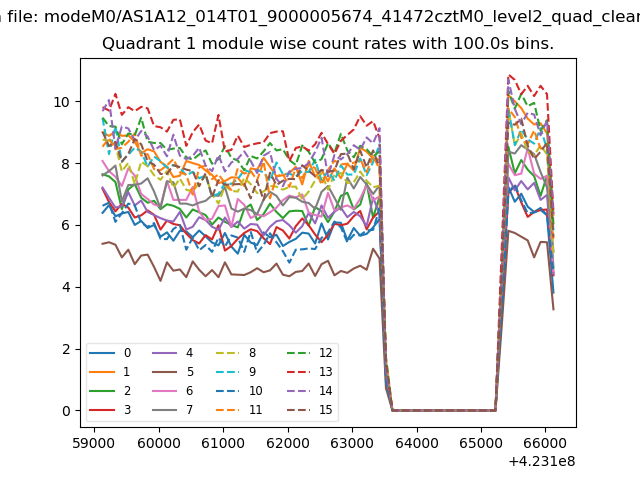
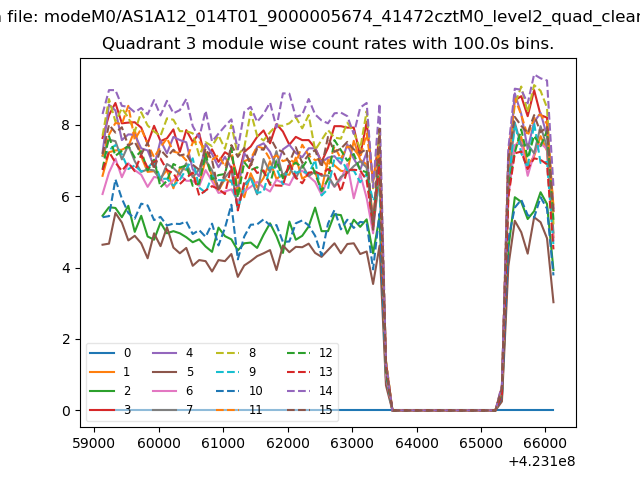
| Module-wise count rates for Quadrant A Data is divided into 100 sec bins |
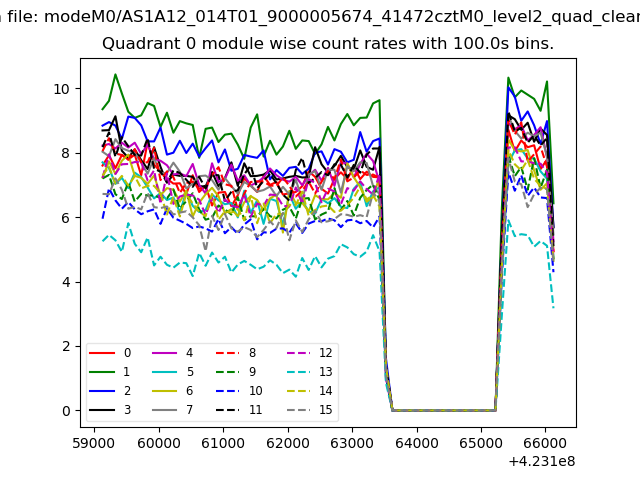 |
 |
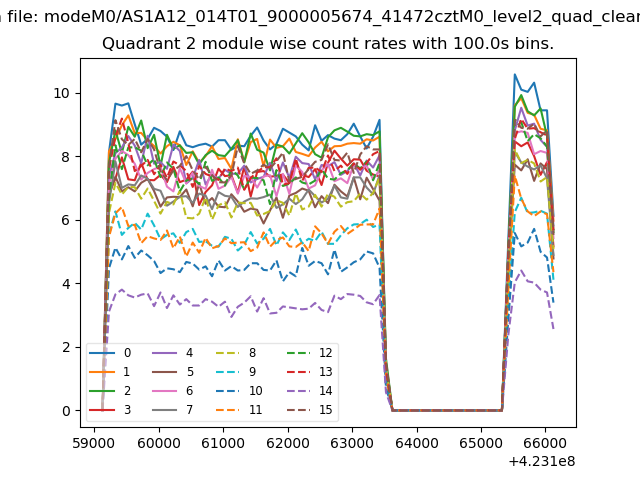
| Module-wise count rates for Quadrant B Data is divided into 100 sec bins |
 |
 |
| Module-wise count rates for Quadrant C Data is divided into 100 sec bins |
 |
 |
| Module-wise count rates for Quadrant D Data is divided into 100 sec bins |
 |
 |
| Parameter | Plot |
|---|---|
| CZT HV Monitor | 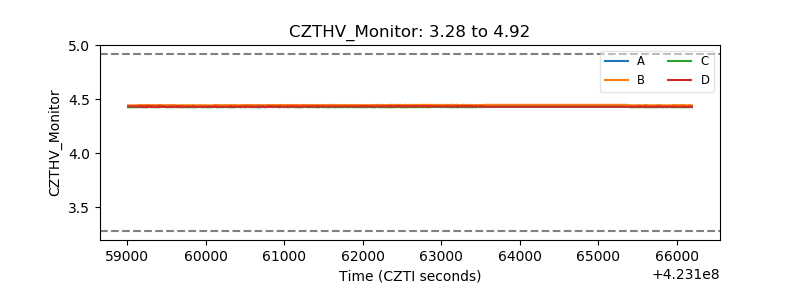 |
| D_VDD | 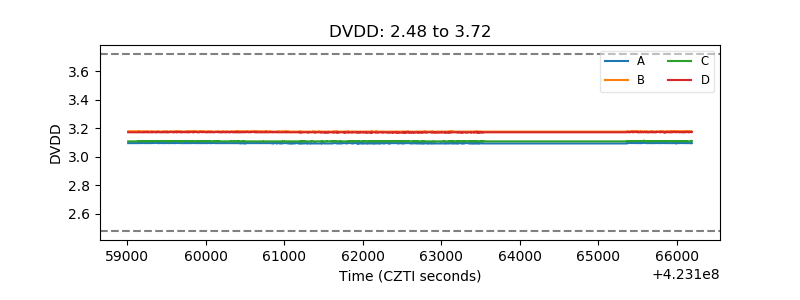 |
| Temperature 1 |  |
| Veto HV Monitor | 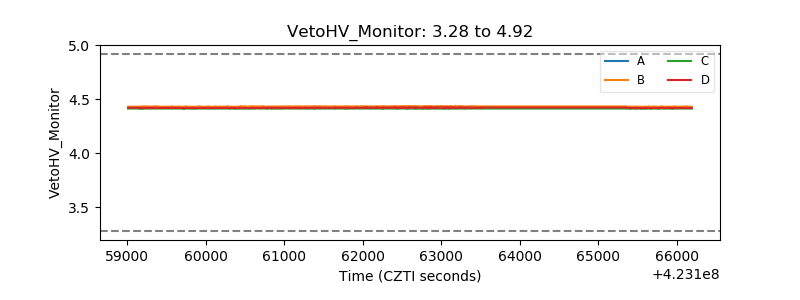 |
| Veto LLD | 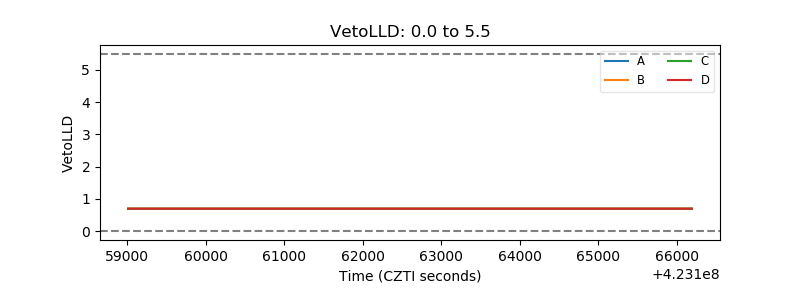 |
| Alpha Counter | 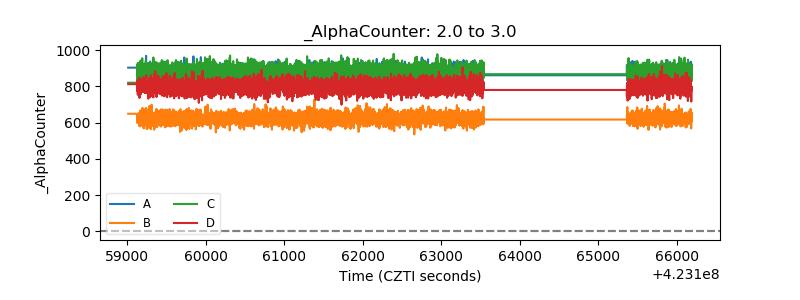 |
| _CPM_Rate | 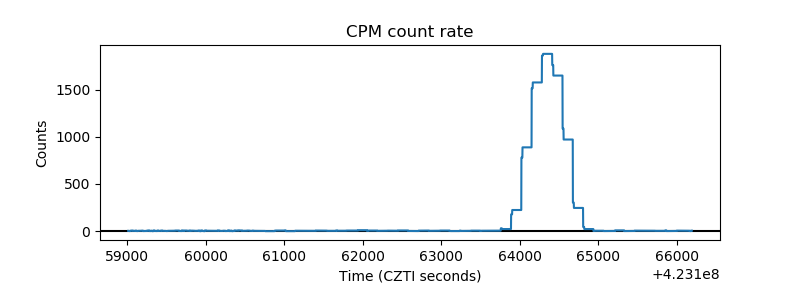 |
| CZT Counter | 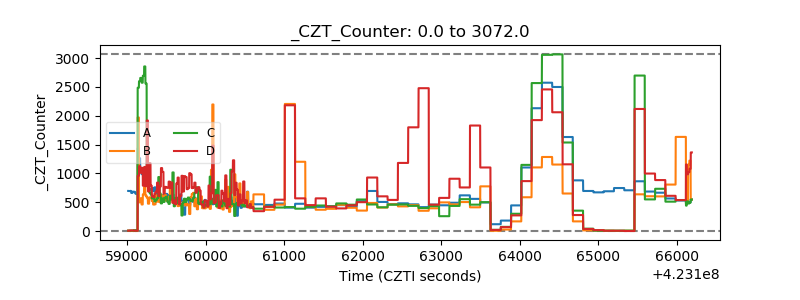 |
| +2.5 Volts monitor | 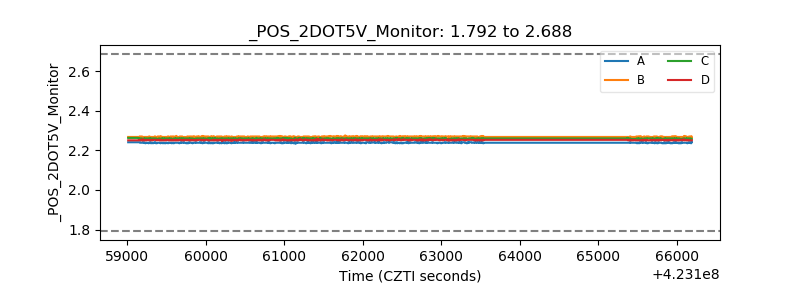 |
| +5 Volts monitor | 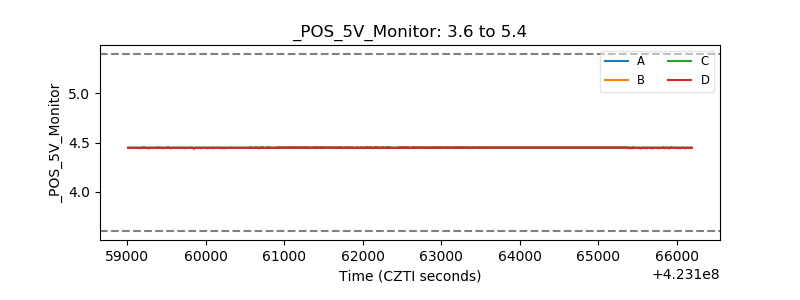 |
| _ROLL_ROT | 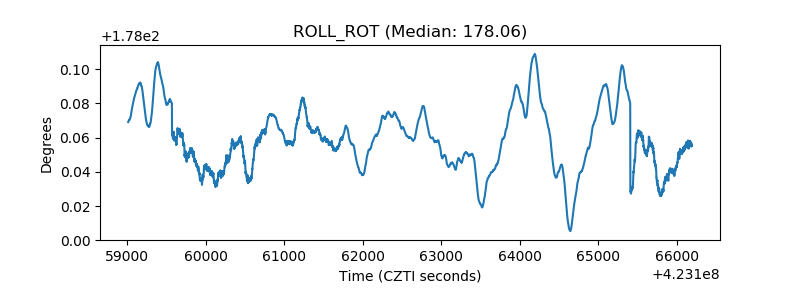 |
| _Roll_DEC | 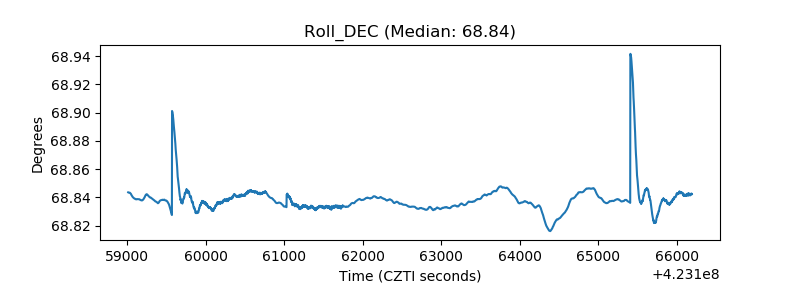 |
| _Roll_RA | 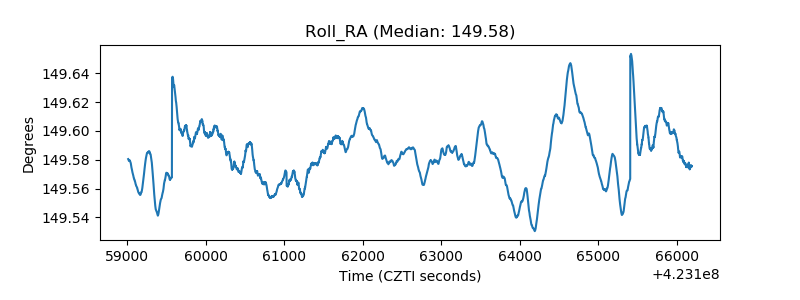 |
| Veto Counter | 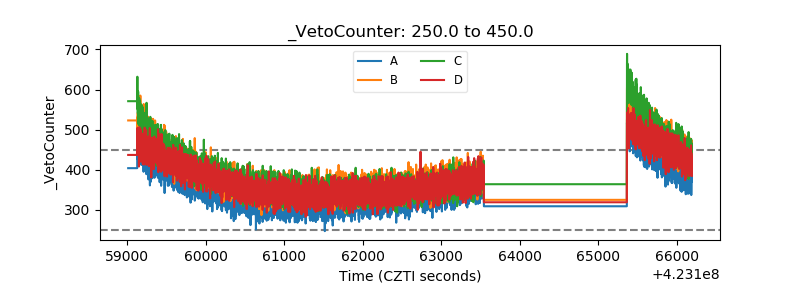 |