| Param | Original file | Final file |
|---|---|---|
| Filename | modeM0/AS1A12_014T01_9000005674_41473cztM0_level2.fits | modeM0/AS1A12_014T01_9000005674_41473cztM0_level2_quad_clean.evt |
| Size (bytes) | 334,514,880 | 88,318,080 |
| Size | 319.0 MB | 84.2 MB |
| Events in quadrant A | 2,785,613 | 595,498 |
| Events in quadrant B | 2,713,623 | 615,569 |
| Events in quadrant C | 3,004,999 | 570,999 |
| Events in quadrant D | 3,480,725 | 534,579 |
| Mode SS | |||
|---|---|---|---|
| Quadrant | BADHDUFLAG | Total packets | Discarded packets |
| A | 0 | 104 | 0 |
| B | 0 | 104 | 0 |
| C | 0 | 104 | 0 |
| D | 0 | 104 | 0 |
| Mode M9 | |||
|---|---|---|---|
| Quadrant | BADHDUFLAG | Total packets | Discarded packets |
| A | 0 | 25 | 0 |
| B | 0 | 25 | 0 |
| C | 0 | 25 | 0 |
| D | 0 | 26 | 0 |
| Mode M0 | |||
|---|---|---|---|
| Quadrant | BADHDUFLAG | Total packets | Discarded packets |
| A | 0 | 11463 | 3 |
| B | 0 | 11717 | 2 |
| C | 0 | 12106 | 2 |
| D | 0 | 13950 | 2 |
| Quadrant | Total seconds | Saturated seconds | Saturation percentage |
|---|---|---|---|
| A | 5105 | 19 | 0.372184% |
| B | 5105 | 57 | 1.116552% |
| C | 5105 | 234 | 4.583741% |
| D | 5105 | 142 | 2.781587% |
Noise dominated data is calculated using 1-second bins in cleaned event files. If a bin has >2000 counts, and if more than 50% of those come from <1% of pixels, then it is considered to be noise-dominated and hence unusable.
| Quadrant | # 1 sec bins | Bins with >0 counts | Bins with >2000 counts | High rate bins dominated by noise | Noise dominated (total time) | Noise dominated (detector-on time) | Marked lightcurve |
|---|---|---|---|---|---|---|---|
| A | 7047 | 5106 | 14 | 14 | 0.20% | 0.27% | 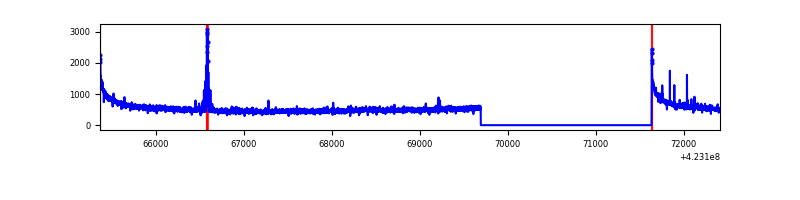 |
| B | 7047 | 5106 | 29 | 29 | 0.41% | 0.57% | 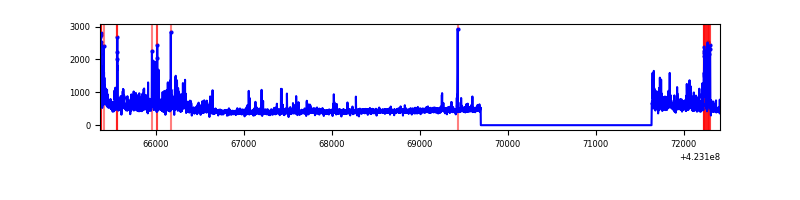 |
| C | 7047 | 5106 | 218 | 218 | 3.09% | 4.27% | 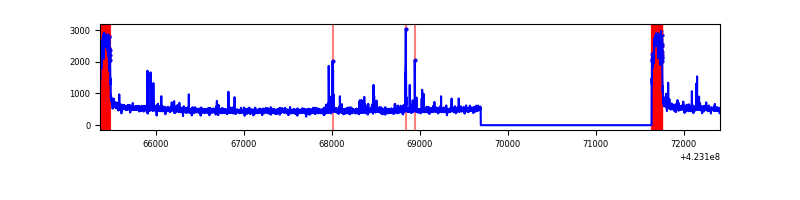 |
| D | 7047 | 5106 | 117 | 117 | 1.66% | 2.29% | 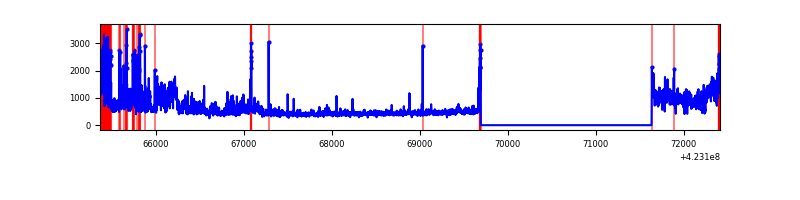 |
Top three noisy pixels from each quadrant. If the there are fewer than three noisy pixels in the level2.evt file, extra rows are filled as -1
| Pixel properties | Quadrant properties | ||||||
|---|---|---|---|---|---|---|---|
| Quadrant | DetID | PixID | Counts | Sigma | Mean | Median | Sigma |
| A | 10 | 83 | 536981 | 4691.49 | 559 | 550 | 114.3 |
| A | 13 | 248 | 51176 | 442.76 | 559 | 550 | 114.3 |
| A | 2 | 79 | 16196 | 136.84 | 559 | 550 | 114.3 |
| B | 0 | 190 | 224481 | 2107.68 | 564 | 549 | 106.2 |
| B | 15 | 85 | 85258 | 797.29 | 564 | 549 | 106.2 |
| B | 5 | 255 | 56404 | 525.72 | 564 | 549 | 106.2 |
| C | 0 | 10 | 600438 | 4805.65 | 539 | 543 | 124.8 |
| C | 15 | 214 | 207758 | 1659.96 | 539 | 543 | 124.8 |
| C | 4 | 254 | 77984 | 620.37 | 539 | 543 | 124.8 |
| D | 1 | 52 | 654243 | 4891.52 | 547 | 532 | 133.6 |
| D | 12 | 79 | 226939 | 1694.13 | 547 | 532 | 133.6 |
| D | 12 | 233 | 89532 | 665.96 | 547 | 532 | 133.6 |
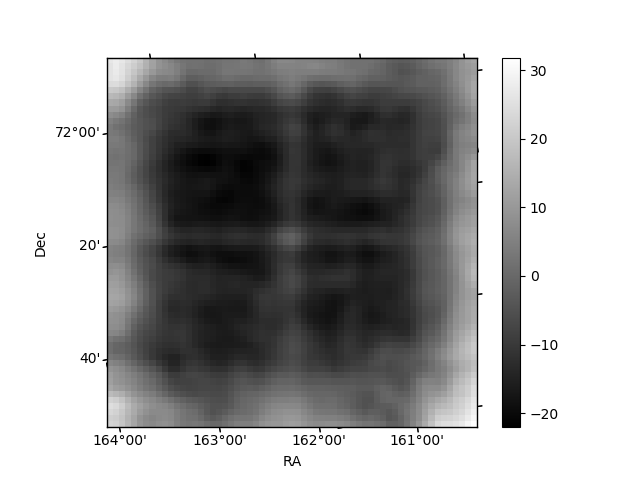
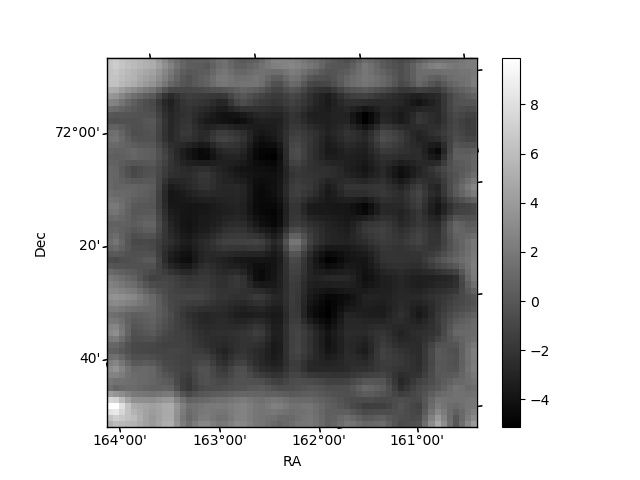
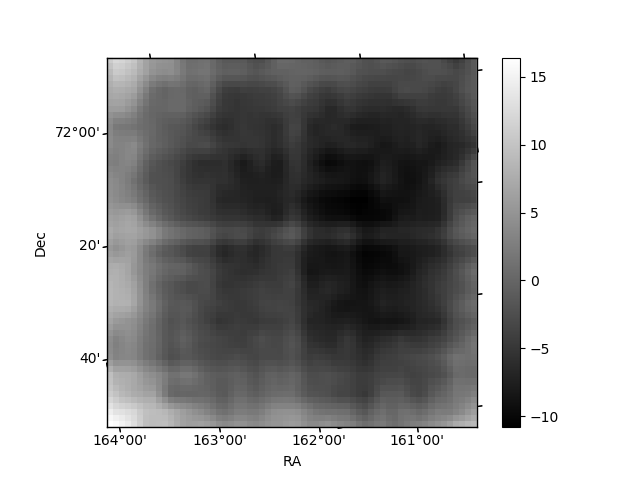
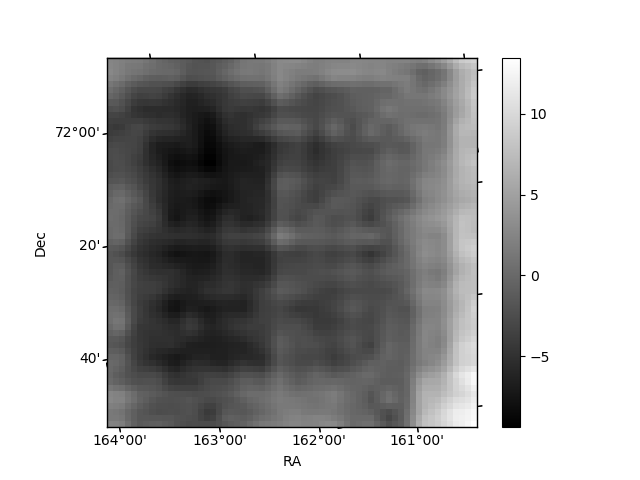
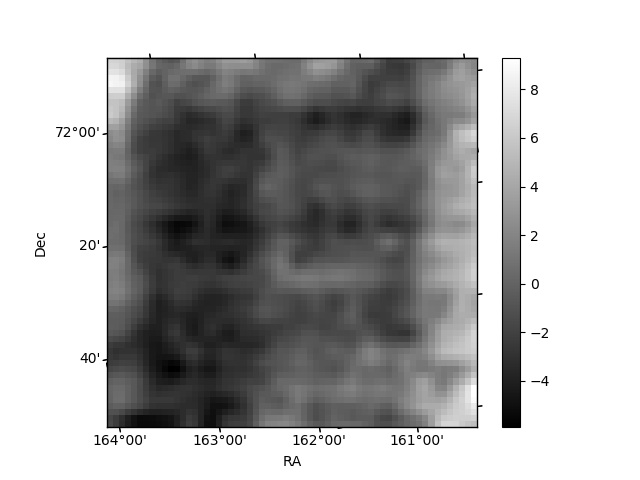
Histogram calculated using DETX and DETY for each event in the final _common_clean file
| Quadrant A | 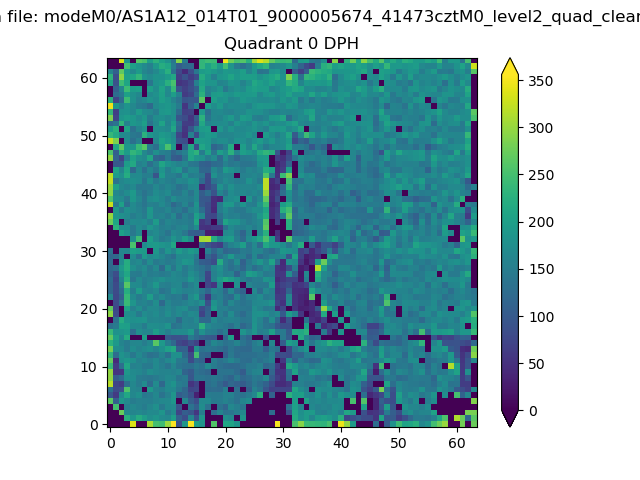 |
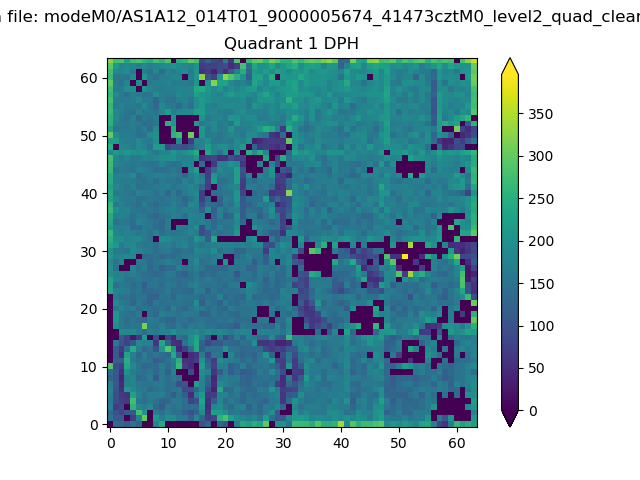 |
Quadrant B |
|---|---|---|---|
| Quadrant D | 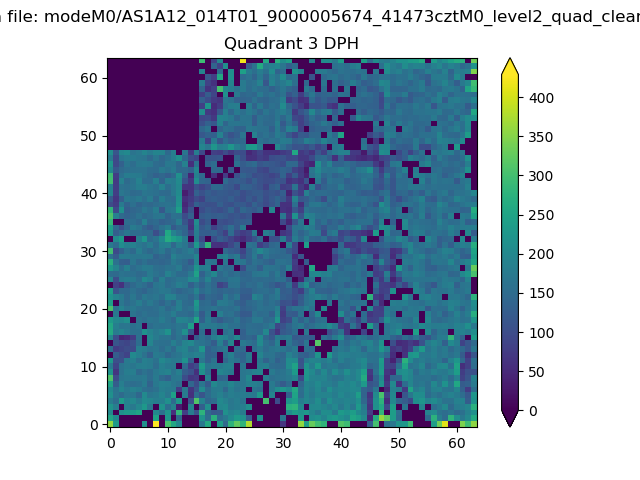 |
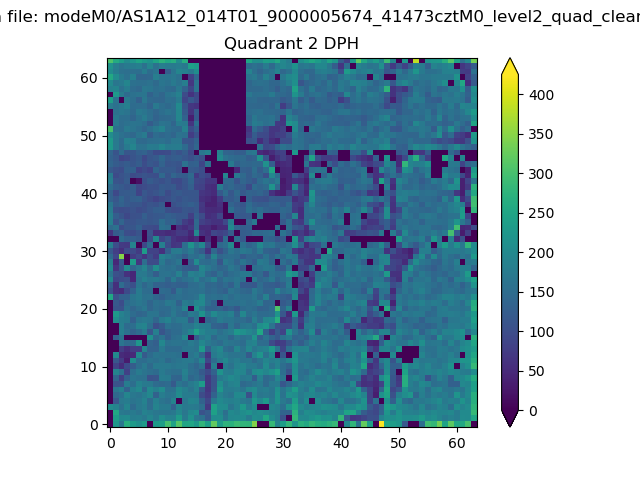 |
Quadrant C |
| Plot type | Count rate plots | Images |
|---|---|---|
| Comparison with Poisson distribution Blue bars denote a histogram of data divided into 1 sec bins. Red curve is a Poisson curve with rate = median count rate of data. |
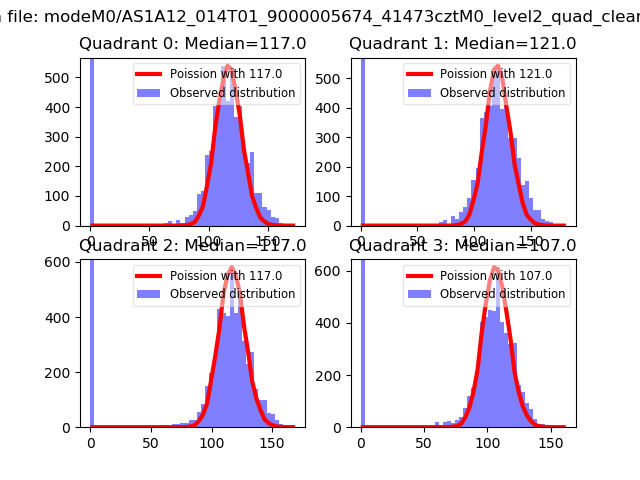 |
 |
| Quadrant-wise count rates Data is divided into 100 sec bins |
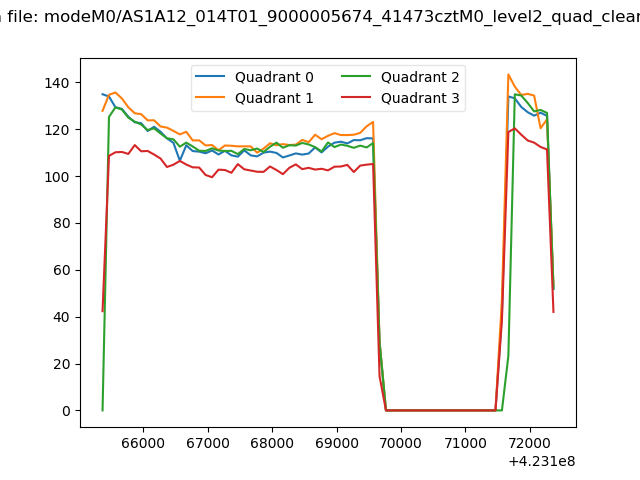 |
|
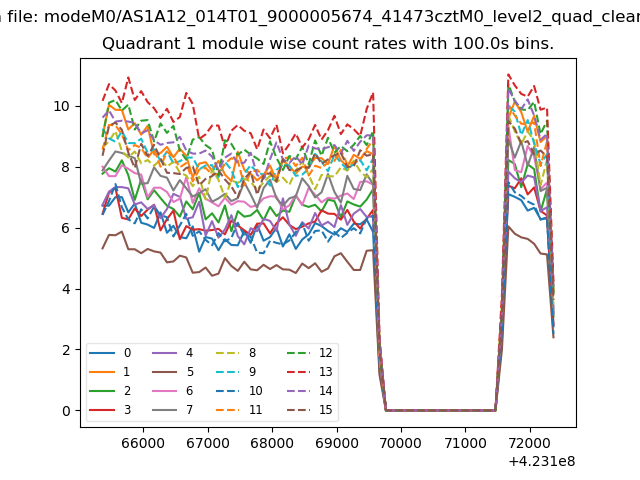
| Module-wise count rates for Quadrant A Data is divided into 100 sec bins |
 |
 |
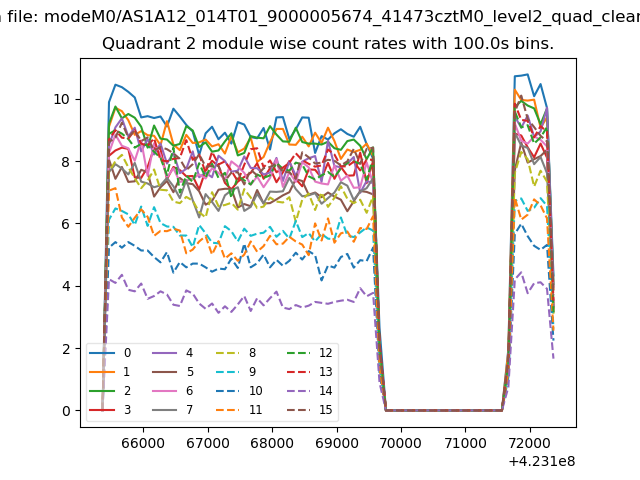
| Module-wise count rates for Quadrant B Data is divided into 100 sec bins |
 |
 |
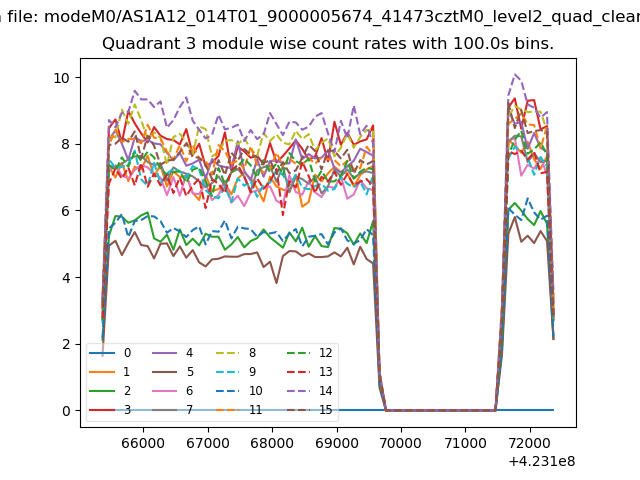
| Module-wise count rates for Quadrant C Data is divided into 100 sec bins |
 |
 |
| Module-wise count rates for Quadrant D Data is divided into 100 sec bins |
 |
 |
| Parameter | Plot |
|---|---|
| CZT HV Monitor | 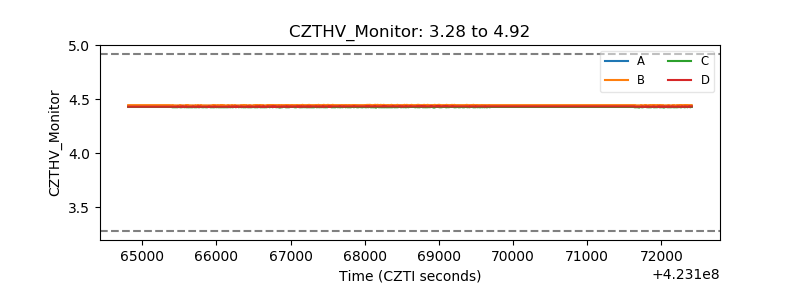 |
| D_VDD |  |
| Temperature 1 | 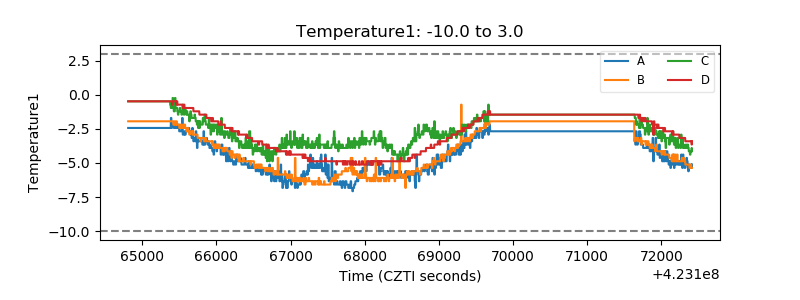 |
| Veto HV Monitor | 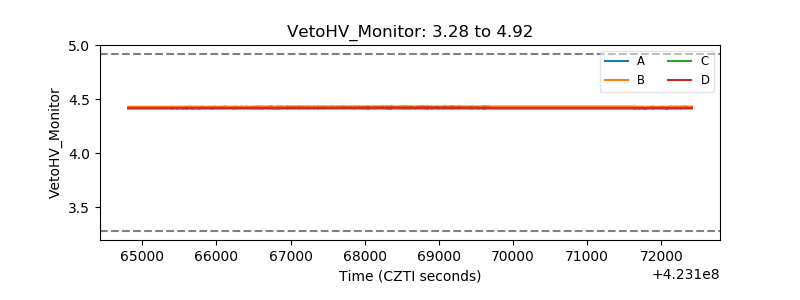 |
| Veto LLD | 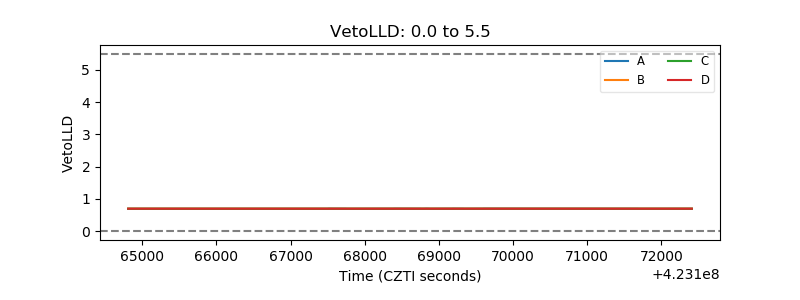 |
| Alpha Counter | 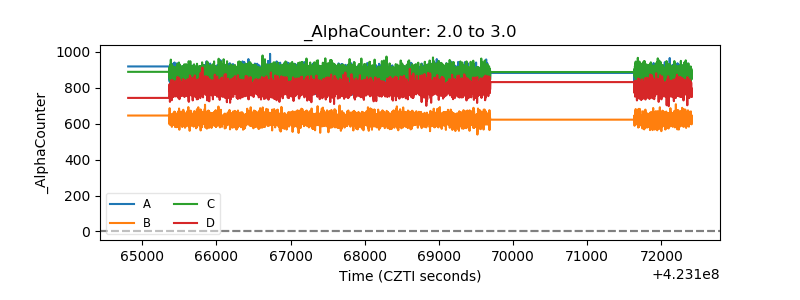 |
| _CPM_Rate | 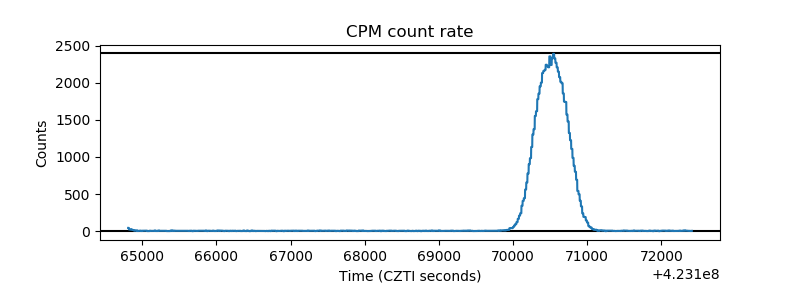 |
| CZT Counter | 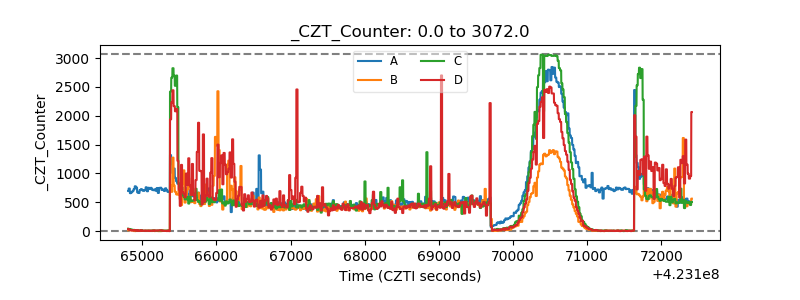 |
| +2.5 Volts monitor | 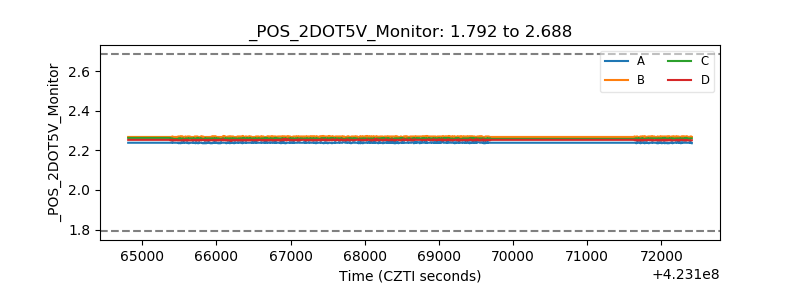 |
| +5 Volts monitor | 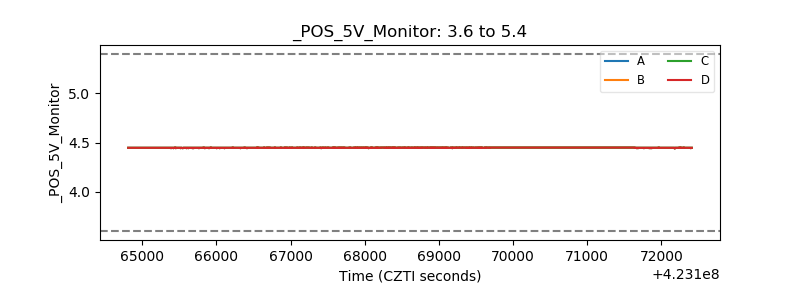 |
| _ROLL_ROT | 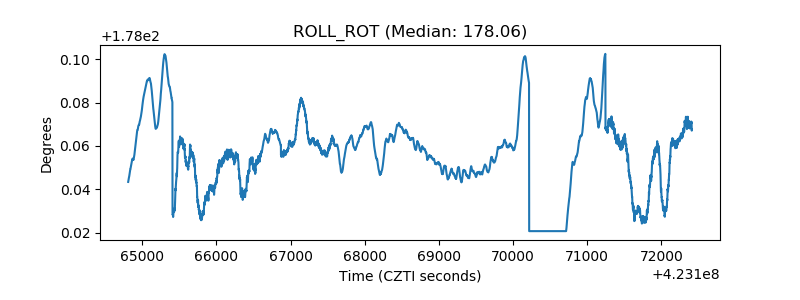 |
| _Roll_DEC | 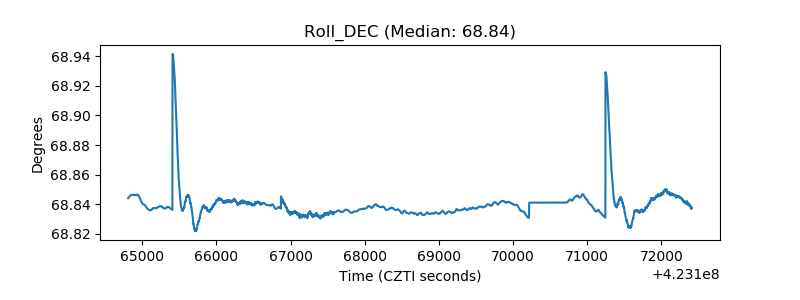 |
| _Roll_RA | 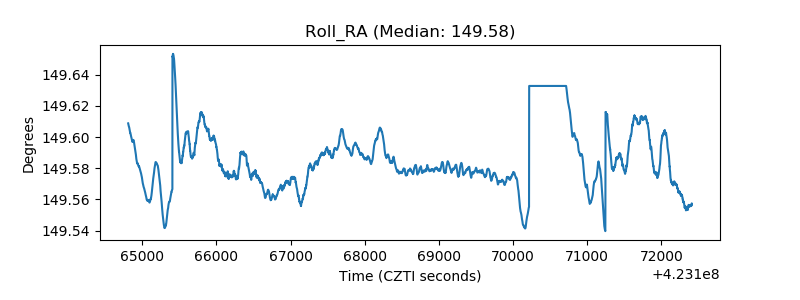 |
| Veto Counter | 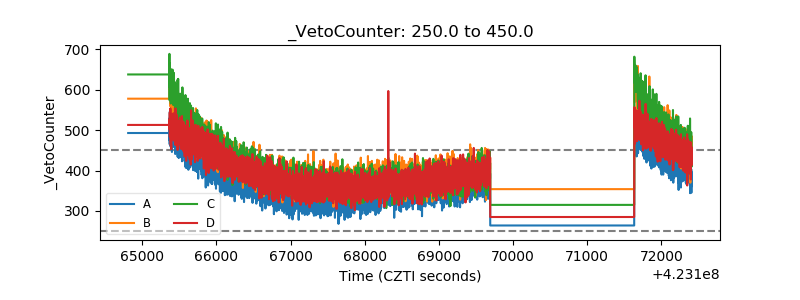 |