| Param | Original file | Final file |
|---|---|---|
| Filename | modeM0/AS1A12_014T01_9000005674_41475cztM0_level2.fits | modeM0/AS1A12_014T01_9000005674_41475cztM0_level2_quad_clean.evt |
| Size (bytes) | 308,845,440 | 84,530,880 |
| Size | 294.5 MB | 80.6 MB |
| Events in quadrant A | 2,607,065 | 569,681 |
| Events in quadrant B | 2,281,588 | 594,996 |
| Events in quadrant C | 3,205,337 | 540,039 |
| Events in quadrant D | 2,955,159 | 509,892 |
| Mode SS | |||
|---|---|---|---|
| Quadrant | BADHDUFLAG | Total packets | Discarded packets |
| A | 0 | 102 | 0 |
| B | 0 | 102 | 0 |
| C | 0 | 102 | 0 |
| D | 0 | 102 | 0 |
| Mode M9 | |||
|---|---|---|---|
| Quadrant | BADHDUFLAG | Total packets | Discarded packets |
| A | 0 | 32 | 0 |
| B | 0 | 32 | 0 |
| C | 0 | 32 | 0 |
| D | 0 | 33 | 0 |
| Mode M0 | |||
|---|---|---|---|
| Quadrant | BADHDUFLAG | Total packets | Discarded packets |
| A | 0 | 10750 | 3 |
| B | 0 | 10258 | 2 |
| C | 0 | 12631 | 2 |
| D | 0 | 12308 | 2 |
| Quadrant | Total seconds | Saturated seconds | Saturation percentage |
|---|---|---|---|
| A | 4915 | 13 | 0.264496% |
| B | 4915 | 11 | 0.223805% |
| C | 4915 | 298 | 6.063072% |
| D | 4915 | 122 | 2.482197% |
Noise dominated data is calculated using 1-second bins in cleaned event files. If a bin has >2000 counts, and if more than 50% of those come from <1% of pixels, then it is considered to be noise-dominated and hence unusable.
| Quadrant | # 1 sec bins | Bins with >0 counts | Bins with >2000 counts | High rate bins dominated by noise | Noise dominated (total time) | Noise dominated (detector-on time) | Marked lightcurve |
|---|---|---|---|---|---|---|---|
| A | 7038 | 4916 | 6 | 6 | 0.09% | 0.12% | 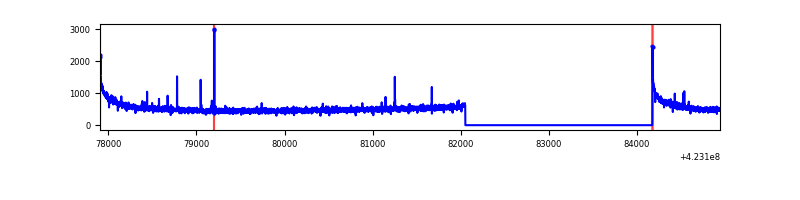 |
| B | 7038 | 4916 | 1 | 1 | 0.01% | 0.02% | 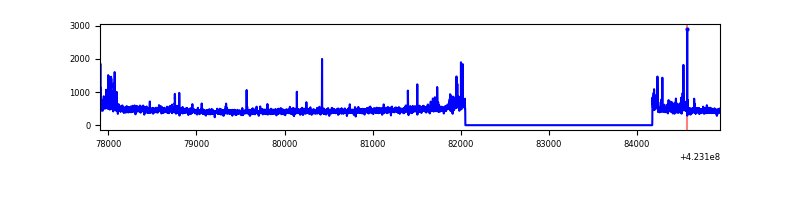 |
| C | 7038 | 4916 | 281 | 281 | 3.99% | 5.72% | 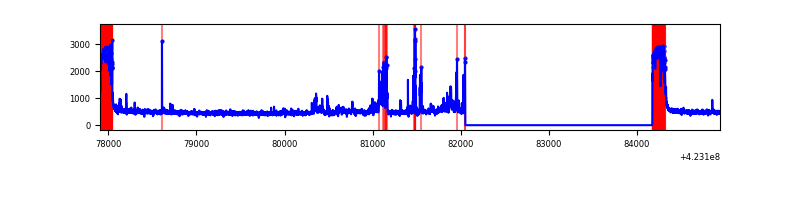 |
| D | 7038 | 4916 | 100 | 100 | 1.42% | 2.03% | 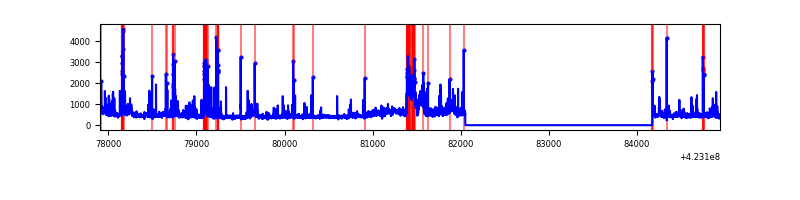 |
Top three noisy pixels from each quadrant. If the there are fewer than three noisy pixels in the level2.evt file, extra rows are filled as -1
| Pixel properties | Quadrant properties | ||||||
|---|---|---|---|---|---|---|---|
| Quadrant | DetID | PixID | Counts | Sigma | Mean | Median | Sigma |
| A | 10 | 83 | 499213 | 4587.55 | 534 | 523 | 108.7 |
| A | 13 | 248 | 27752 | 250.48 | 534 | 523 | 108.7 |
| A | 13 | 6 | 9052 | 78.46 | 534 | 523 | 108.7 |
| B | 0 | 245 | 62813 | 608.81 | 540 | 526 | 102.3 |
| B | 5 | 255 | 29158 | 279.86 | 540 | 526 | 102.3 |
| B | 0 | 190 | 14365 | 135.27 | 540 | 526 | 102.3 |
| C | 0 | 10 | 736371 | 6282.3 | 505 | 509 | 117.1 |
| C | 4 | 254 | 285455 | 2432.68 | 505 | 509 | 117.1 |
| C | 15 | 214 | 196431 | 1672.65 | 505 | 509 | 117.1 |
| D | 12 | 16 | 200040 | 1595.49 | 516 | 503 | 125.1 |
| D | 13 | 249 | 194789 | 1553.5 | 516 | 503 | 125.1 |
| D | 1 | 52 | 162414 | 1294.63 | 516 | 503 | 125.1 |
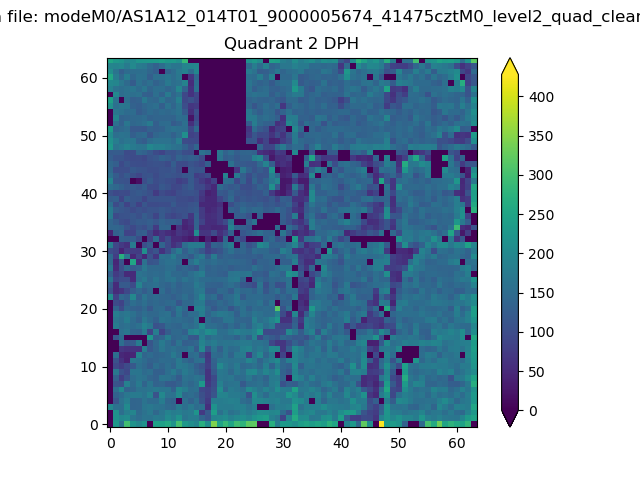
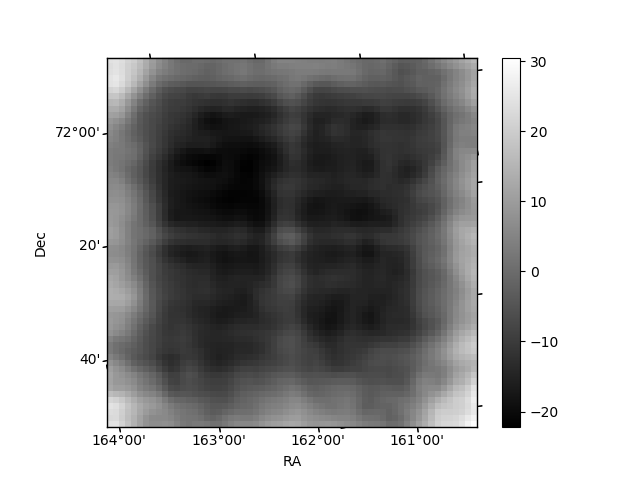
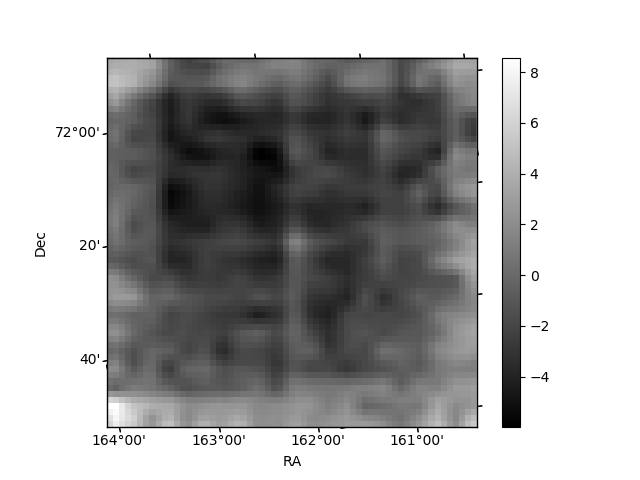
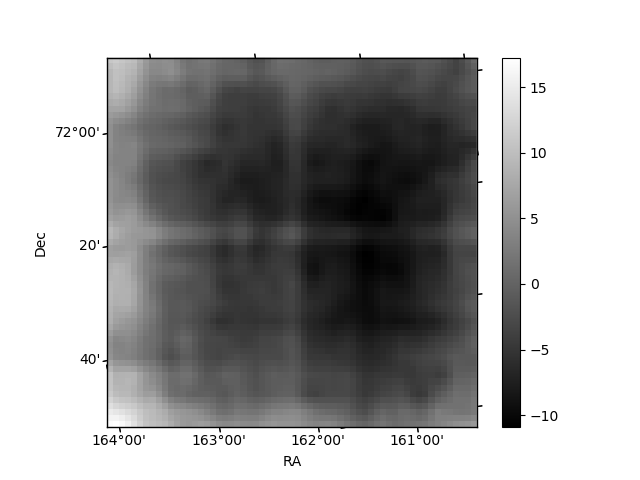
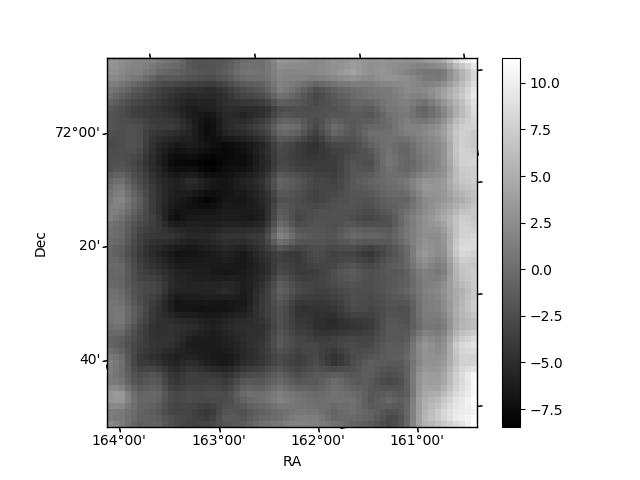
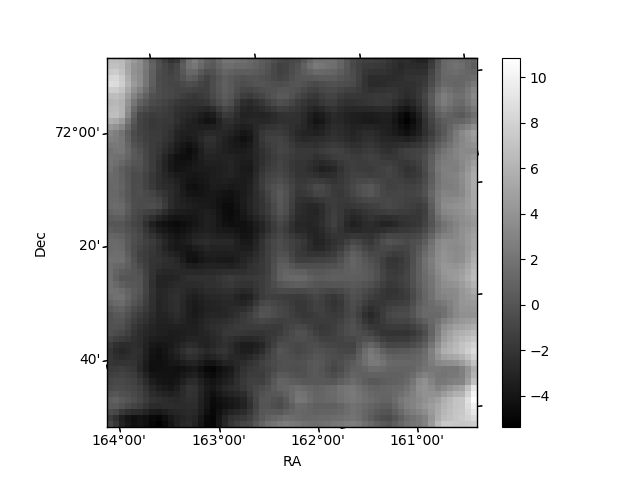
Histogram calculated using DETX and DETY for each event in the final _common_clean file
| Quadrant A | 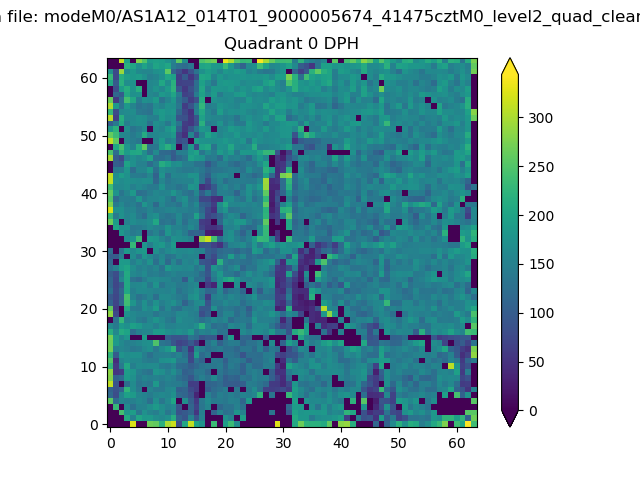 |
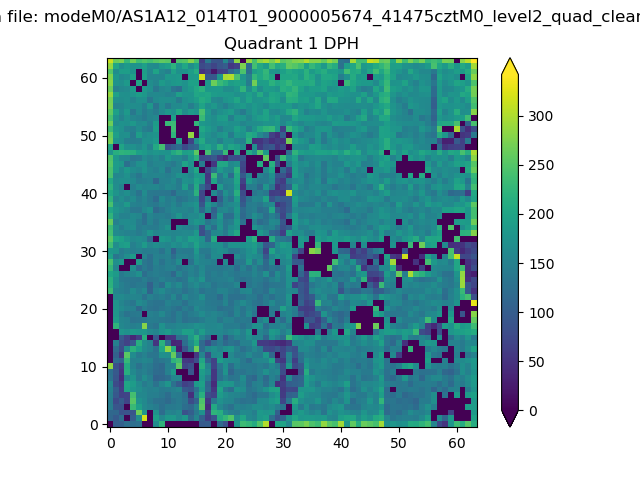 |
Quadrant B |
|---|---|---|---|
| Quadrant D | 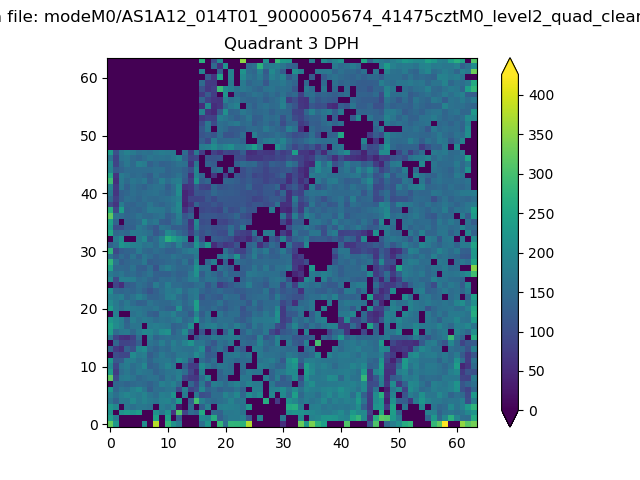 |
 |
Quadrant C |
| Plot type | Count rate plots | Images |
|---|---|---|
| Comparison with Poisson distribution Blue bars denote a histogram of data divided into 1 sec bins. Red curve is a Poisson curve with rate = median count rate of data. |
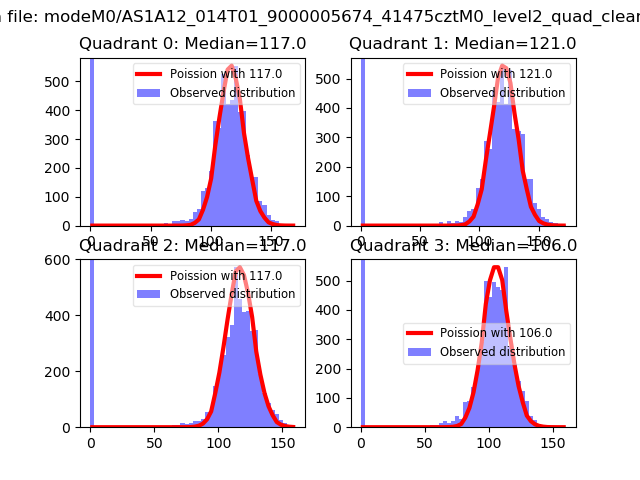 |
 |
| Quadrant-wise count rates Data is divided into 100 sec bins |
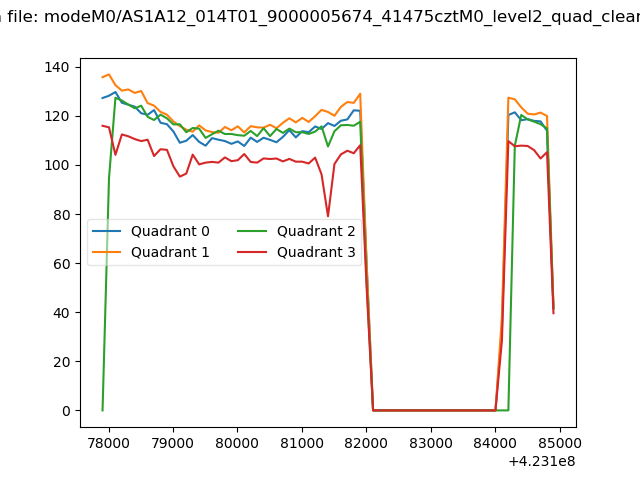 |
|
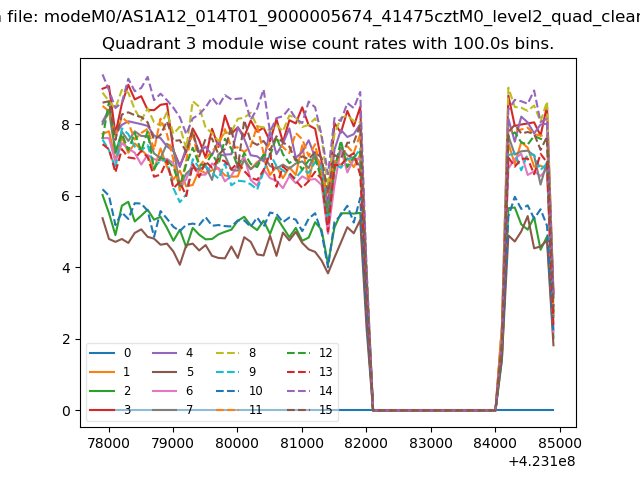
| Module-wise count rates for Quadrant A Data is divided into 100 sec bins |
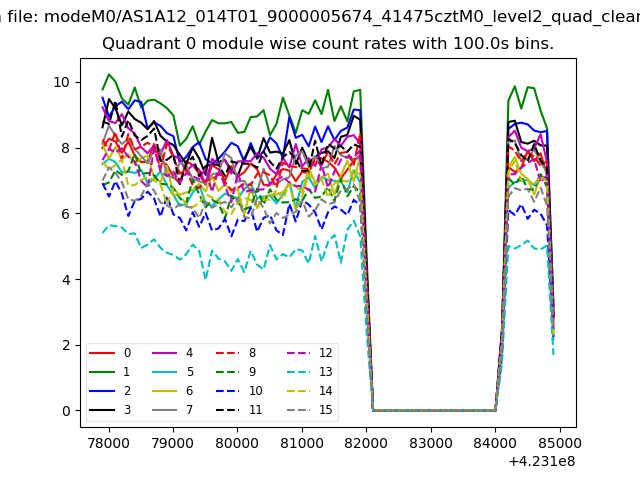 |
 |
| Module-wise count rates for Quadrant B Data is divided into 100 sec bins |
 |
 |
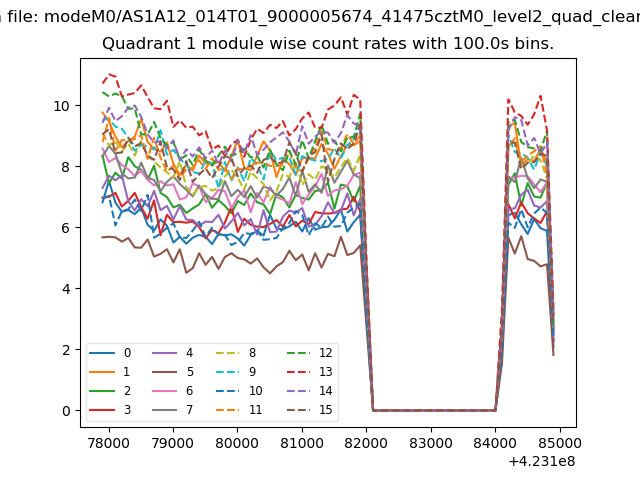
| Module-wise count rates for Quadrant C Data is divided into 100 sec bins |
 |
 |
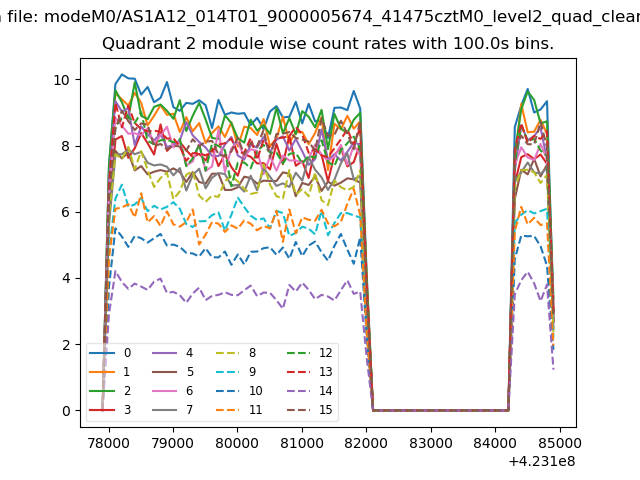
| Module-wise count rates for Quadrant D Data is divided into 100 sec bins |
 |
 |
| Parameter | Plot |
|---|---|
| CZT HV Monitor | 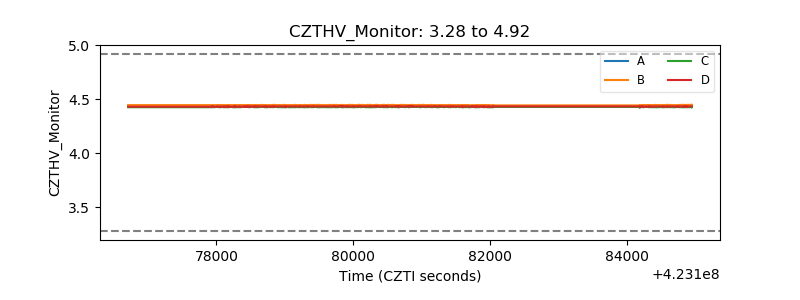 |
| D_VDD | 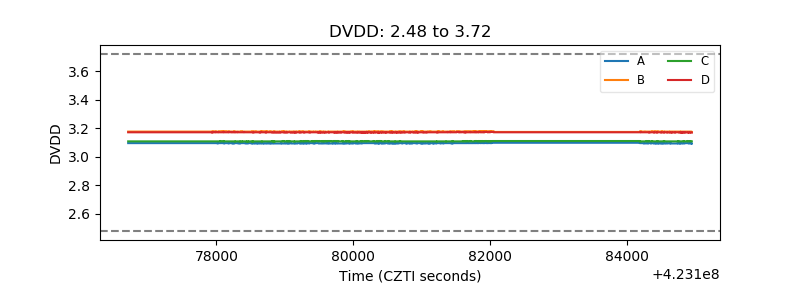 |
| Temperature 1 | 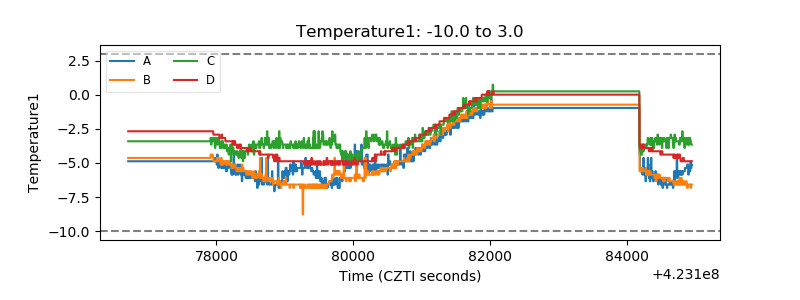 |
| Veto HV Monitor | 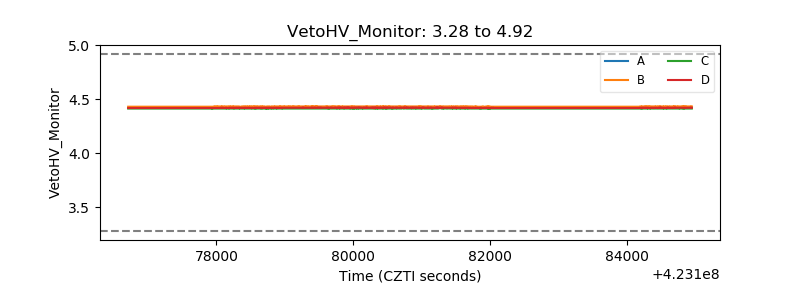 |
| Veto LLD | 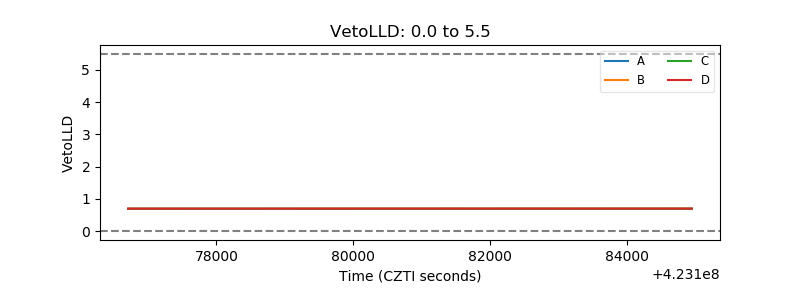 |
| Alpha Counter | 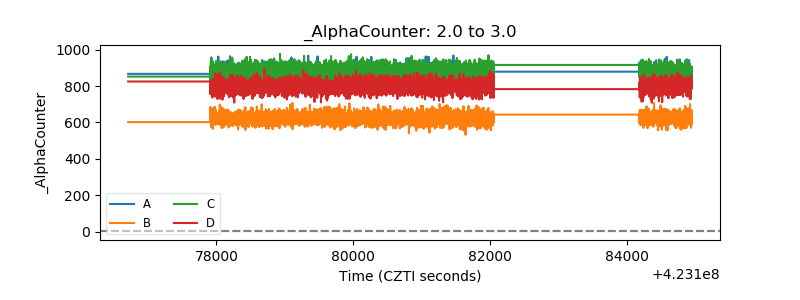 |
| _CPM_Rate | 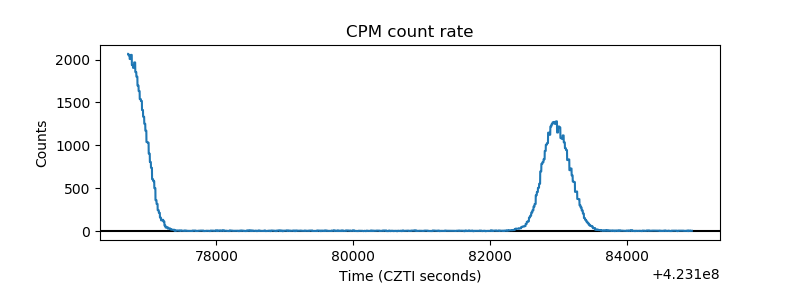 |
| CZT Counter | 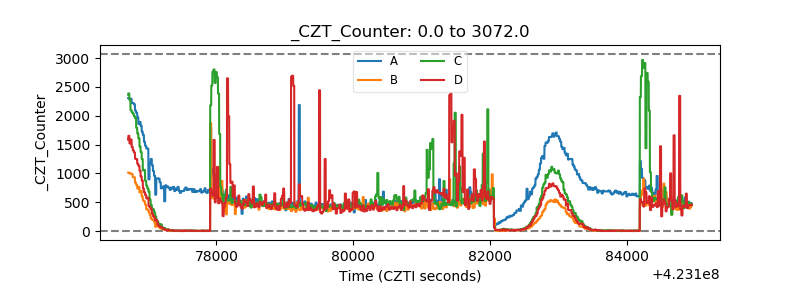 |
| +2.5 Volts monitor | 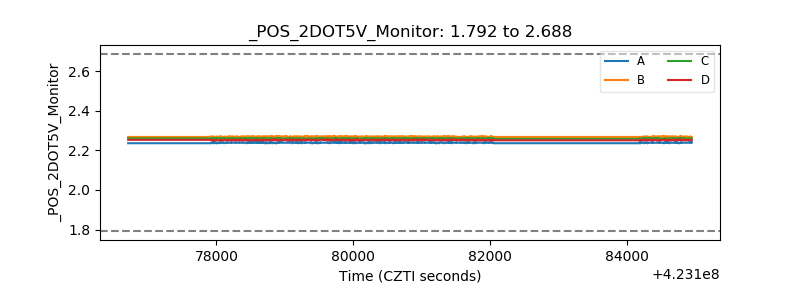 |
| +5 Volts monitor |  |
| _ROLL_ROT | 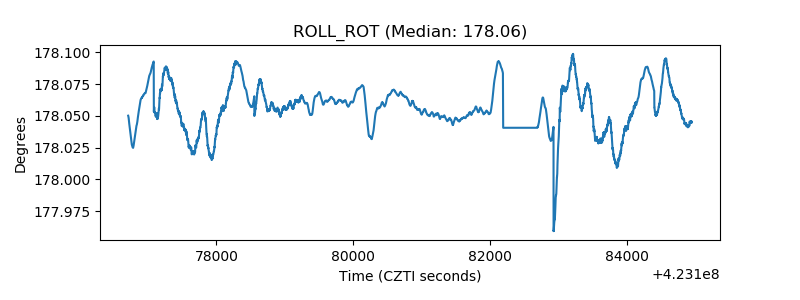 |
| _Roll_DEC | 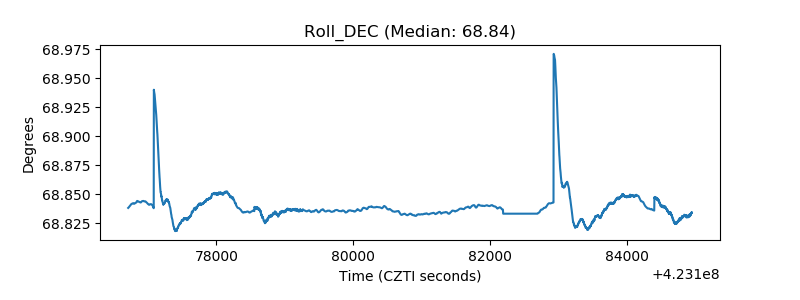 |
| _Roll_RA | 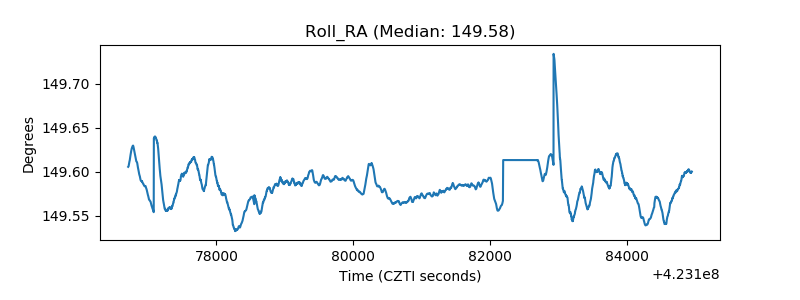 |
| Veto Counter | 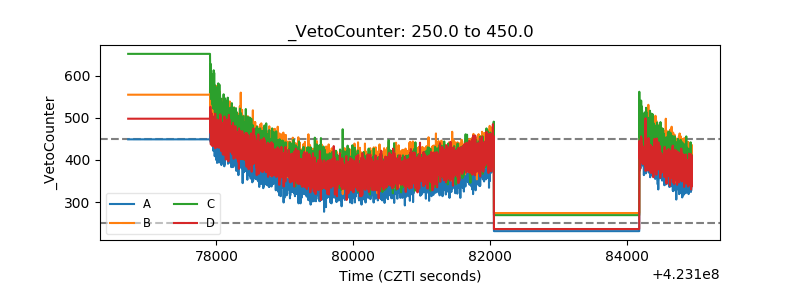 |