| Param | Original file | Final file |
|---|---|---|
| Filename | modeM0/AS1A12_014T01_9000005674_41478cztM0_level2.fits | modeM0/AS1A12_014T01_9000005674_41478cztM0_level2_quad_clean.evt |
| Size (bytes) | 117,440,640 | 26,300,160 |
| Size | 112.0 MB | 25.1 MB |
| Events in quadrant A | 816,203 | 172,389 |
| Events in quadrant B | 752,400 | 180,279 |
| Events in quadrant C | 780,209 | 174,563 |
| Events in quadrant D | 1,864,591 | 145,396 |
| Mode SS | |||
|---|---|---|---|
| Quadrant | BADHDUFLAG | Total packets | Discarded packets |
| A | 0 | 34 | 0 |
| B | 0 | 34 | 0 |
| C | 0 | 34 | 0 |
| D | 0 | 34 | 0 |
| Mode M0 | |||
|---|---|---|---|
| Quadrant | BADHDUFLAG | Total packets | Discarded packets |
| A | 0 | 3516 | 0 |
| B | 0 | 3545 | 0 |
| C | 0 | 3541 | 0 |
| D | 0 | 6749 | 0 |
| Quadrant | Total seconds | Saturated seconds | Saturation percentage |
|---|---|---|---|
| A | 1686 | 1 | 0.059312% |
| B | 1686 | 4 | 0.237248% |
| C | 1686 | 12 | 0.711744% |
| D | 1686 | 236 | 13.997628% |
Noise dominated data is calculated using 1-second bins in cleaned event files. If a bin has >2000 counts, and if more than 50% of those come from <1% of pixels, then it is considered to be noise-dominated and hence unusable.
| Quadrant | # 1 sec bins | Bins with >0 counts | Bins with >2000 counts | High rate bins dominated by noise | Noise dominated (total time) | Noise dominated (detector-on time) | Marked lightcurve |
|---|---|---|---|---|---|---|---|
| A | 1686 | 1686 | 0 | 0 | 0.00% | 0.00% | 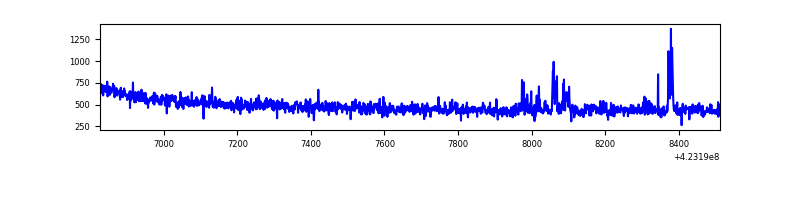 |
| B | 1686 | 1686 | 1 | 1 | 0.06% | 0.06% | 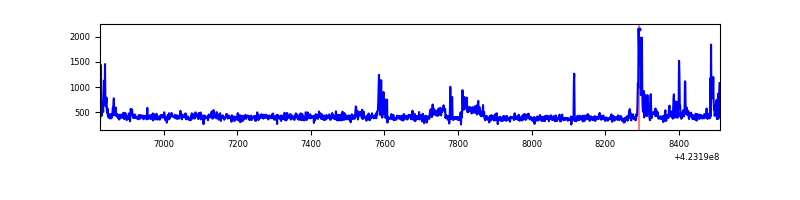 |
| C | 1686 | 1686 | 7 | 7 | 0.42% | 0.42% | 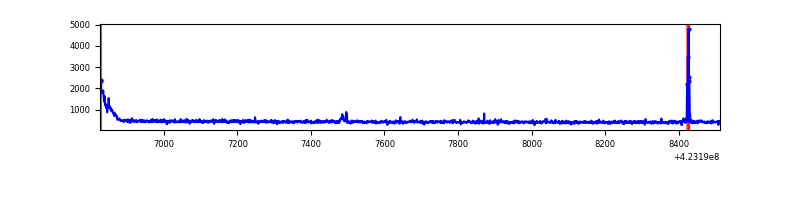 |
| D | 1686 | 1686 | 258 | 258 | 15.30% | 15.30% | 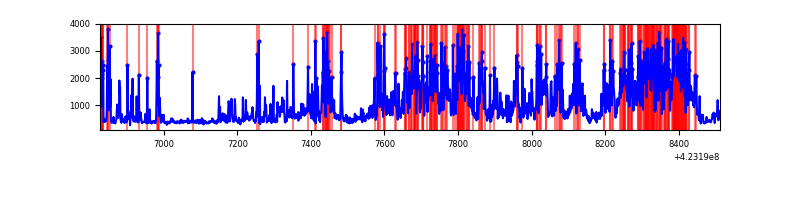 |
Top three noisy pixels from each quadrant. If the there are fewer than three noisy pixels in the level2.evt file, extra rows are filled as -1
| Pixel properties | Quadrant properties | ||||||
|---|---|---|---|---|---|---|---|
| Quadrant | DetID | PixID | Counts | Sigma | Mean | Median | Sigma |
| A | 10 | 83 | 144383 | 3977.68 | 168 | 165 | 36.3 |
| A | 13 | 248 | 18391 | 502.69 | 168 | 165 | 36.3 |
| A | 13 | 254 | 2725 | 70.61 | 168 | 165 | 36.3 |
| B | 5 | 255 | 80187 | 2279.17 | 170 | 165 | 35.1 |
| B | 12 | 111 | 4187 | 114.55 | 170 | 165 | 35.1 |
| B | 11 | 111 | 3841 | 104.7 | 170 | 165 | 35.1 |
| C | 15 | 214 | 71768 | 1806.45 | 164 | 165 | 39.6 |
| C | 0 | 10 | 41060 | 1031.73 | 164 | 165 | 39.6 |
| C | 4 | 254 | 22201 | 555.94 | 164 | 165 | 39.6 |
| D | 12 | 16 | 1143752 | 28740.95 | 154 | 149 | 39.8 |
| D | 5 | 222 | 44901 | 1124.7 | 154 | 149 | 39.8 |
| D | 12 | 128 | 41495 | 1039.1 | 154 | 149 | 39.8 |
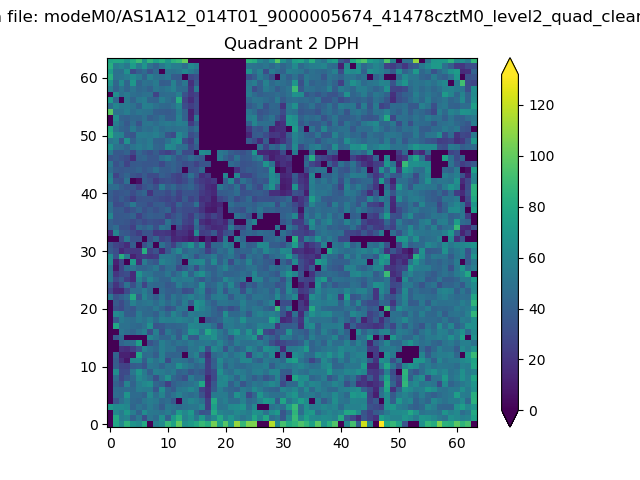
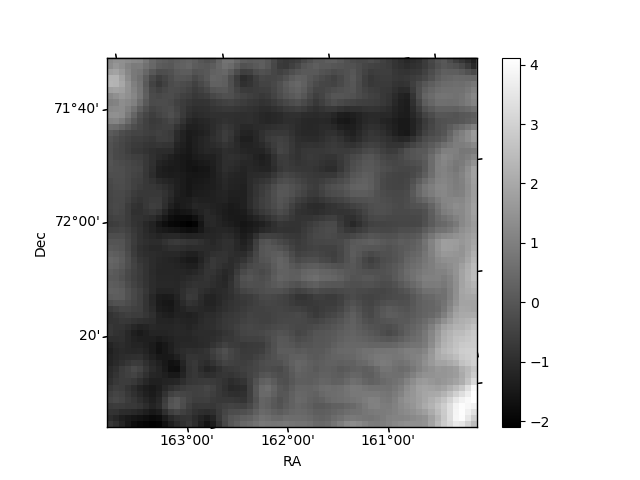
Histogram calculated using DETX and DETY for each event in the final _common_clean file
| Quadrant A | 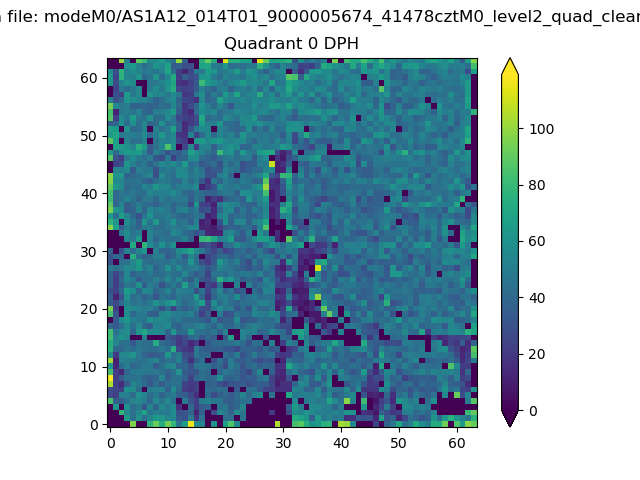 |
 |
Quadrant B |
|---|---|---|---|
| Quadrant D |  |
 |
Quadrant C |
| Plot type | Count rate plots | Images |
|---|---|---|
| Comparison with Poisson distribution Blue bars denote a histogram of data divided into 1 sec bins. Red curve is a Poisson curve with rate = median count rate of data. |
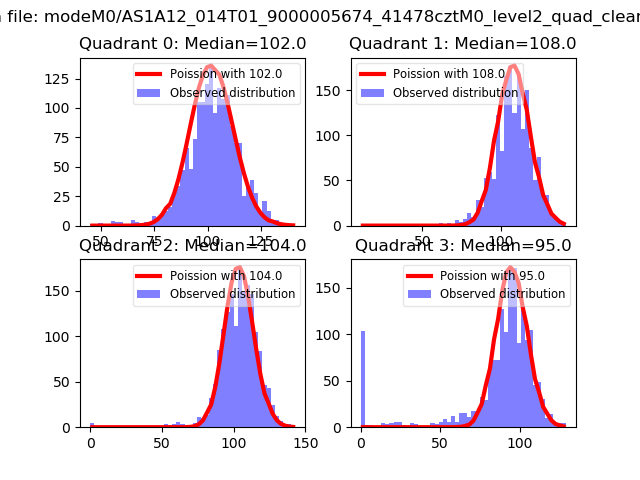 |
 |
| Quadrant-wise count rates Data is divided into 100 sec bins |
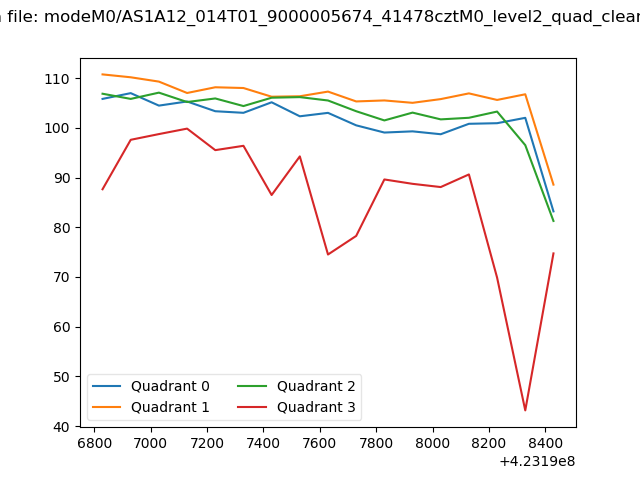 |
|
| Module-wise count rates for Quadrant A Data is divided into 100 sec bins |
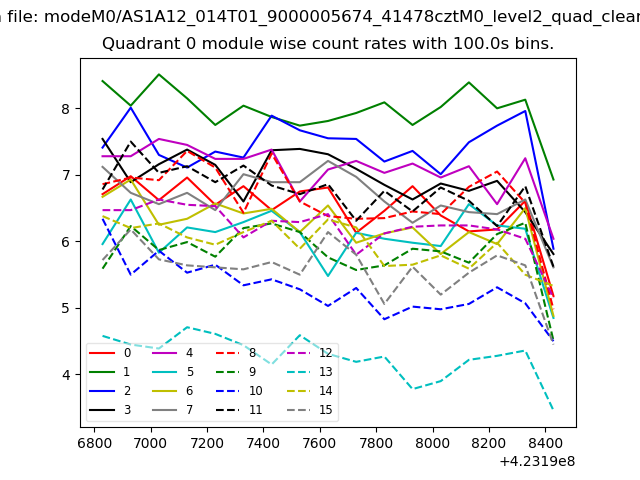 |
 |
| Module-wise count rates for Quadrant B Data is divided into 100 sec bins |
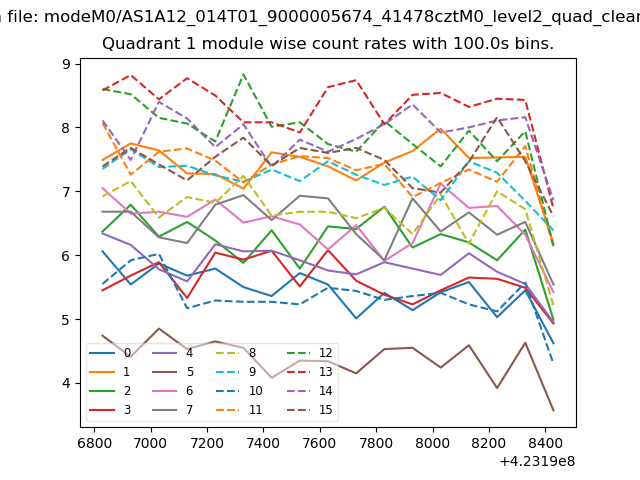 |
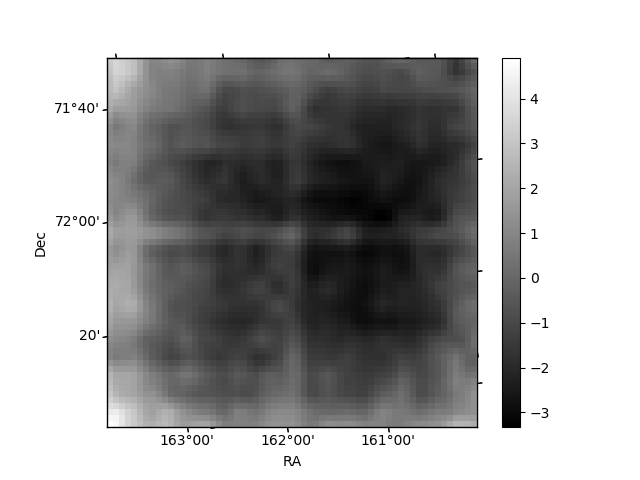 |
| Module-wise count rates for Quadrant C Data is divided into 100 sec bins |
 |
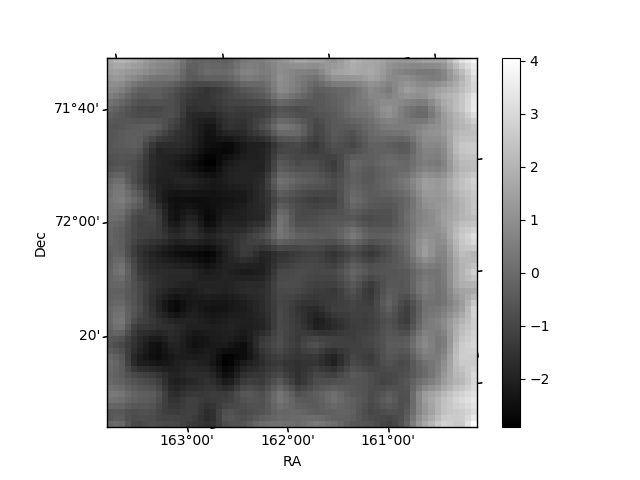 |
| Module-wise count rates for Quadrant D Data is divided into 100 sec bins |
 |
 |
| Parameter | Plot |
|---|---|
| CZT HV Monitor | 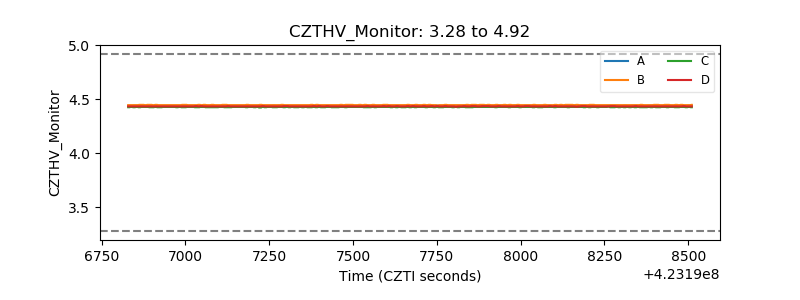 |
| D_VDD | 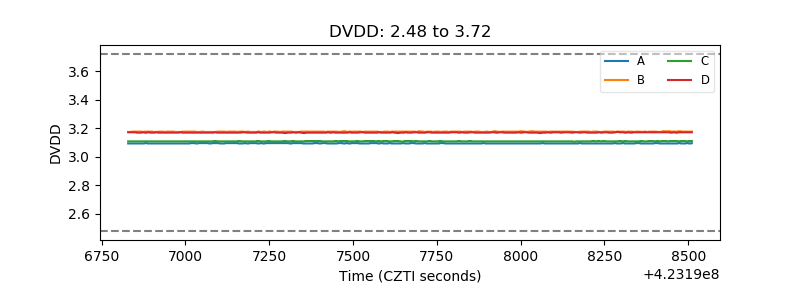 |
| Temperature 1 | 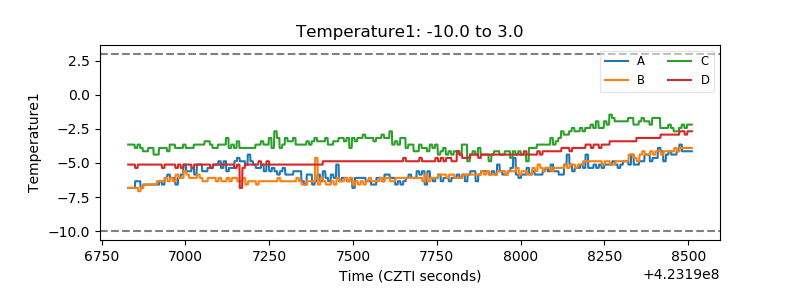 |
| Veto HV Monitor |  |
| Veto LLD | 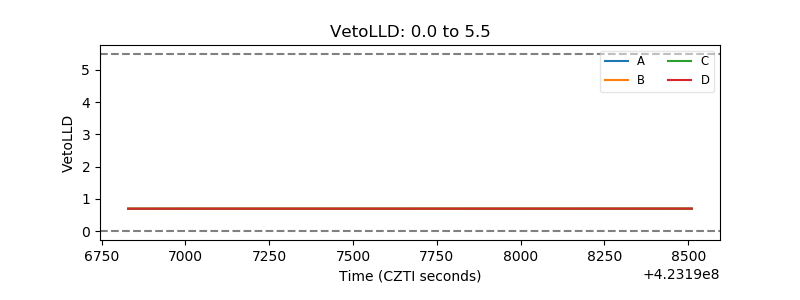 |
| Alpha Counter | 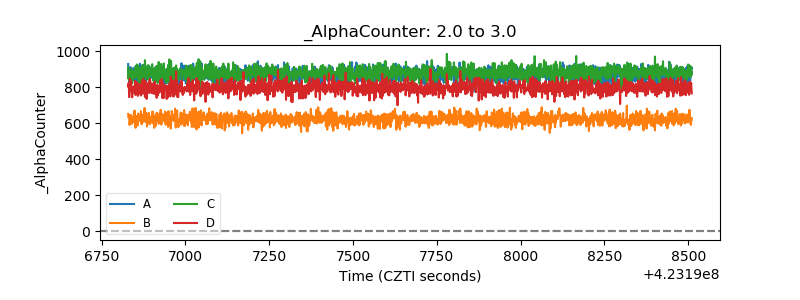 |
| _CPM_Rate | 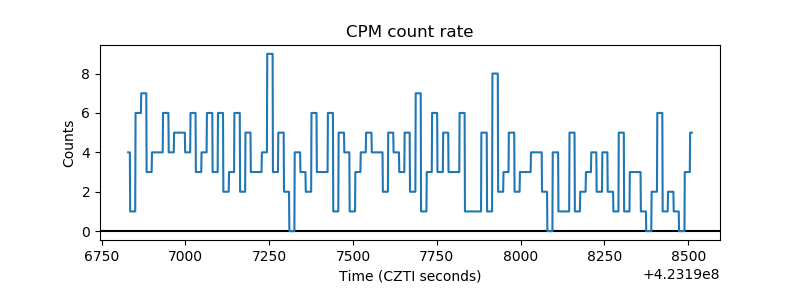 |
| CZT Counter | 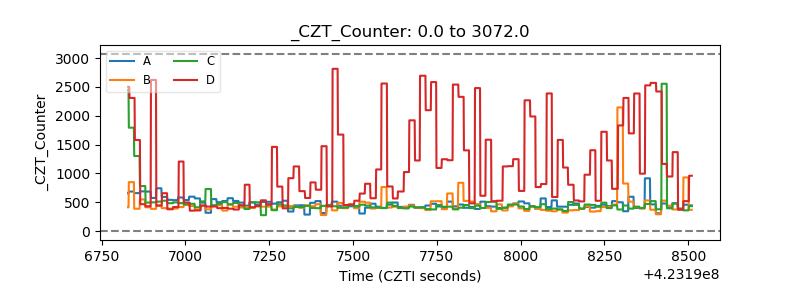 |
| +2.5 Volts monitor | 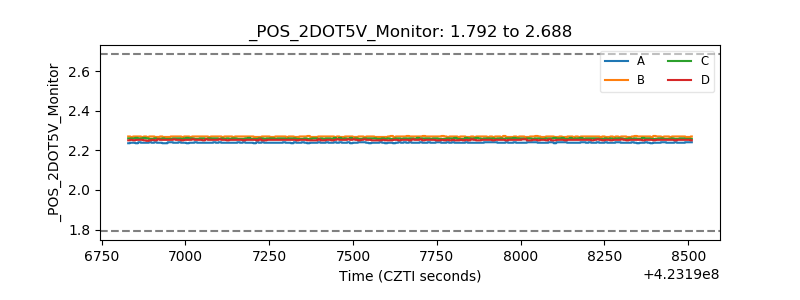 |
| +5 Volts monitor | 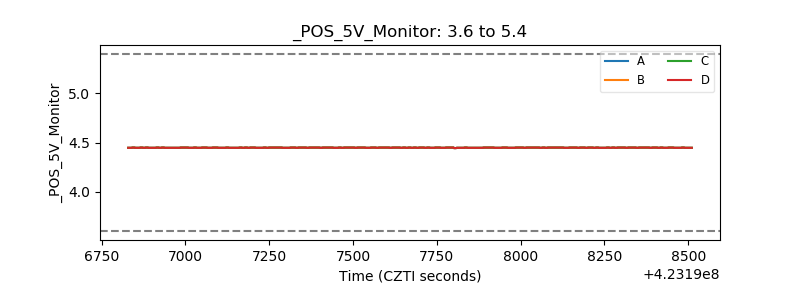 |
| _ROLL_ROT | 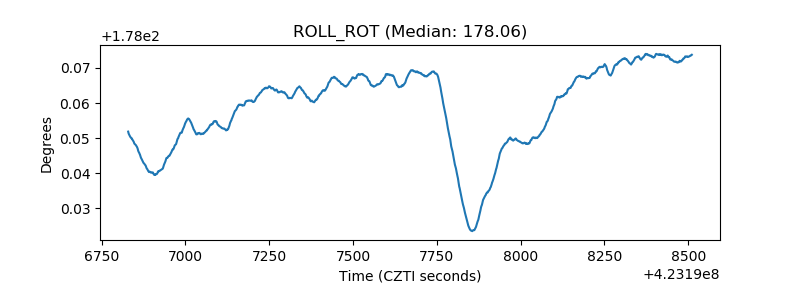 |
| _Roll_DEC | 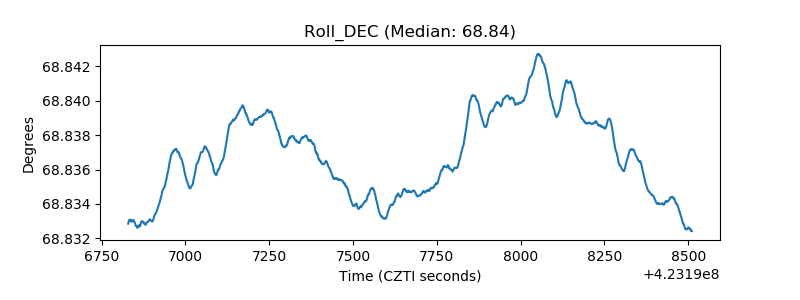 |
| _Roll_RA | 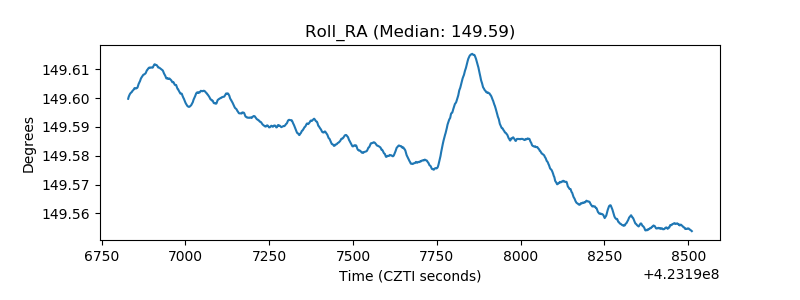 |
| Veto Counter | 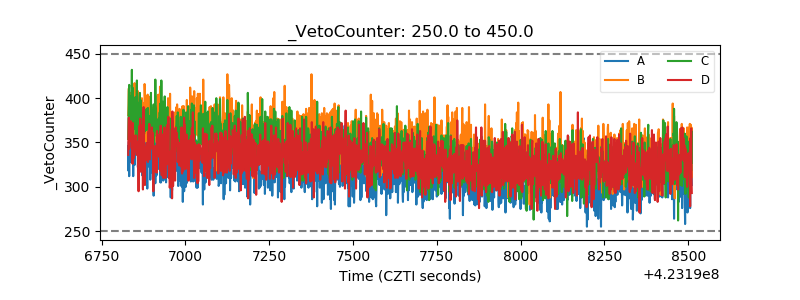 |