| Param | Original file | Final file |
|---|---|---|
| Filename | modeM0/AS1T05_110T01_9000005672_41465cztM0_level2.fits | modeM0/AS1T05_110T01_9000005672_41465cztM0_level2_quad_clean.evt |
| Size (bytes) | 185,005,440 | 46,967,040 |
| Size | 176.4 MB | 44.8 MB |
| Events in quadrant A | 1,557,307 | 316,202 |
| Events in quadrant B | 1,453,849 | 324,209 |
| Events in quadrant C | 1,638,464 | 303,497 |
| Events in quadrant D | 1,971,695 | 271,741 |
| Mode SS | |||
|---|---|---|---|
| Quadrant | BADHDUFLAG | Total packets | Discarded packets |
| A | 0 | 60 | 0 |
| B | 0 | 60 | 0 |
| C | 0 | 60 | 0 |
| D | 0 | 60 | 0 |
| Mode M0 | |||
|---|---|---|---|
| Quadrant | BADHDUFLAG | Total packets | Discarded packets |
| A | 0 | 6208 | 2 |
| B | 0 | 6263 | 1 |
| C | 0 | 6559 | 1 |
| D | 0 | 7851 | 1 |
| Mode M9 | |||
|---|---|---|---|
| Quadrant | BADHDUFLAG | Total packets | Discarded packets |
| A | 0 | 13 | 0 |
| B | 0 | 13 | 0 |
| C | 0 | 13 | 0 |
| D | 0 | 13 | 0 |
| Quadrant | Total seconds | Saturated seconds | Saturation percentage |
|---|---|---|---|
| A | 2892 | 8 | 0.276625% |
| B | 2892 | 4 | 0.138313% |
| C | 2892 | 86 | 2.973721% |
| D | 2892 | 186 | 6.431535% |
Noise dominated data is calculated using 1-second bins in cleaned event files. If a bin has >2000 counts, and if more than 50% of those come from <1% of pixels, then it is considered to be noise-dominated and hence unusable.
| Quadrant | # 1 sec bins | Bins with >0 counts | Bins with >2000 counts | High rate bins dominated by noise | Noise dominated (total time) | Noise dominated (detector-on time) | Marked lightcurve |
|---|---|---|---|---|---|---|---|
| A | 4205 | 2893 | 2 | 2 | 0.05% | 0.07% | 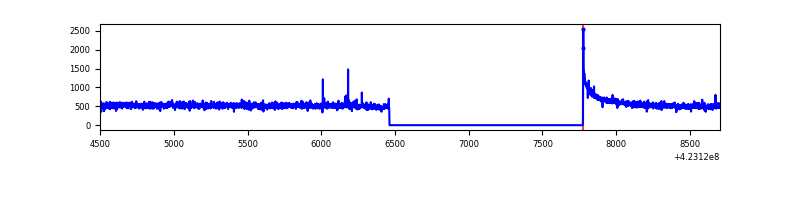 |
| B | 4205 | 2893 | 2 | 2 | 0.05% | 0.07% | 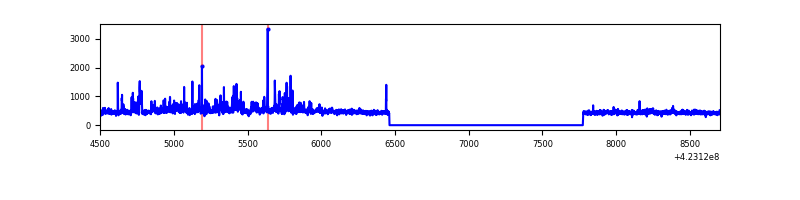 |
| C | 4205 | 2893 | 77 | 77 | 1.83% | 2.66% | 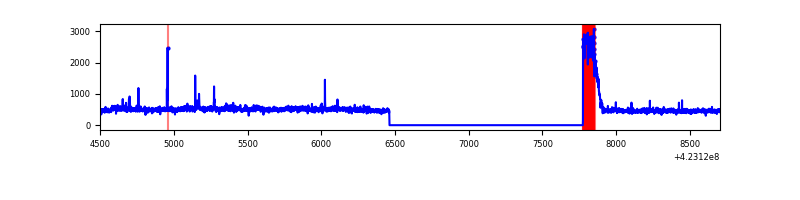 |
| D | 4205 | 2893 | 168 | 168 | 4.00% | 5.81% | 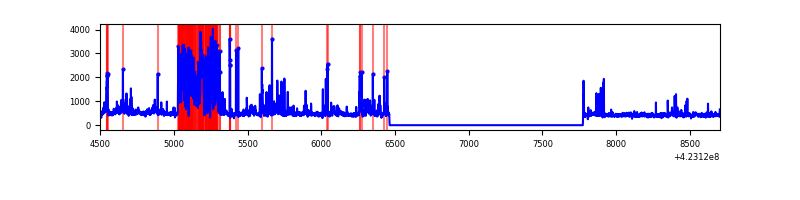 |
Top three noisy pixels from each quadrant. If the there are fewer than three noisy pixels in the level2.evt file, extra rows are filled as -1
| Pixel properties | Quadrant properties | ||||||
|---|---|---|---|---|---|---|---|
| Quadrant | DetID | PixID | Counts | Sigma | Mean | Median | Sigma |
| A | 10 | 83 | 304895 | 4542.53 | 318 | 311 | 67.1 |
| A | 13 | 6 | 8592 | 123.5 | 318 | 311 | 67.1 |
| A | 13 | 248 | 7940 | 113.78 | 318 | 311 | 67.1 |
| B | 0 | 190 | 83960 | 1319.62 | 320 | 311 | 63.4 |
| B | 5 | 255 | 66407 | 1042.71 | 320 | 311 | 63.4 |
| B | 0 | 245 | 27928 | 435.68 | 320 | 311 | 63.4 |
| C | 0 | 10 | 247350 | 3334.16 | 311 | 312 | 74.1 |
| C | 15 | 214 | 123351 | 1660.6 | 311 | 312 | 74.1 |
| C | 0 | 15 | 41524 | 556.22 | 311 | 312 | 74.1 |
| D | 12 | 233 | 468039 | 6113.94 | 305 | 296 | 76.5 |
| D | 13 | 249 | 66782 | 869.05 | 305 | 296 | 76.5 |
| D | 5 | 222 | 53571 | 696.37 | 305 | 296 | 76.5 |
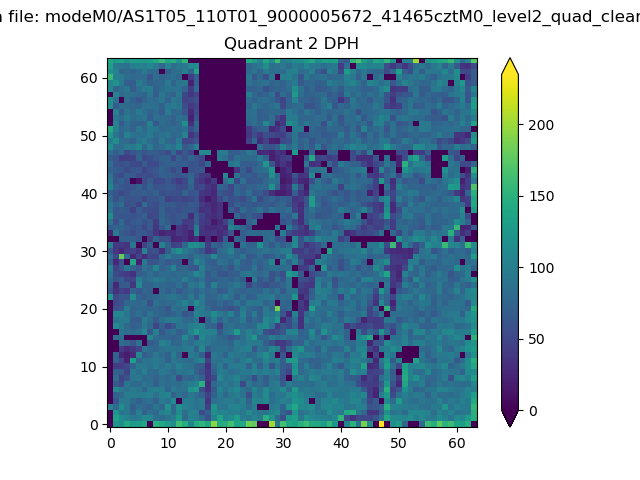
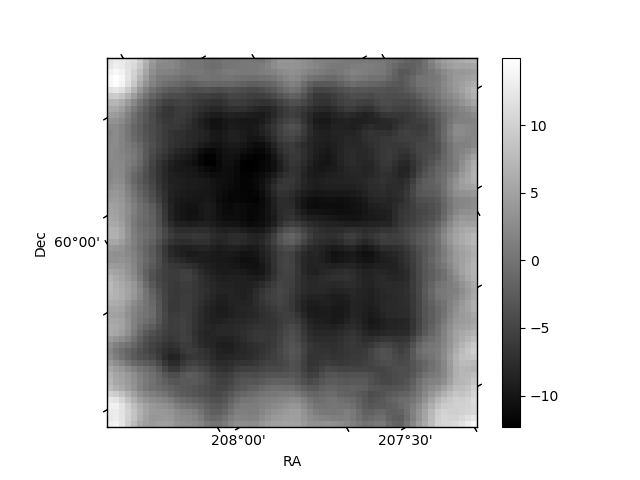
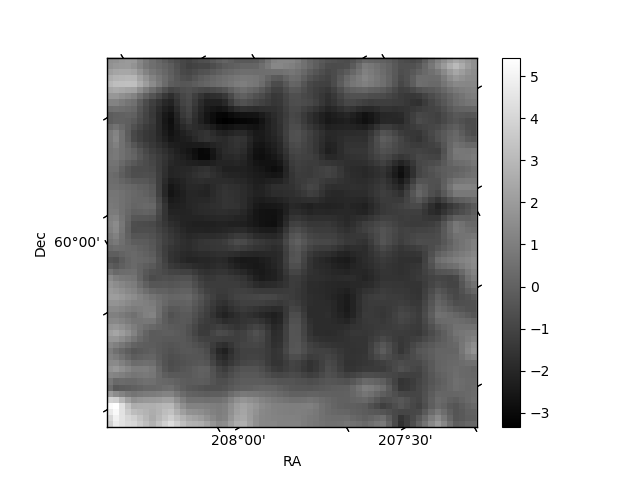
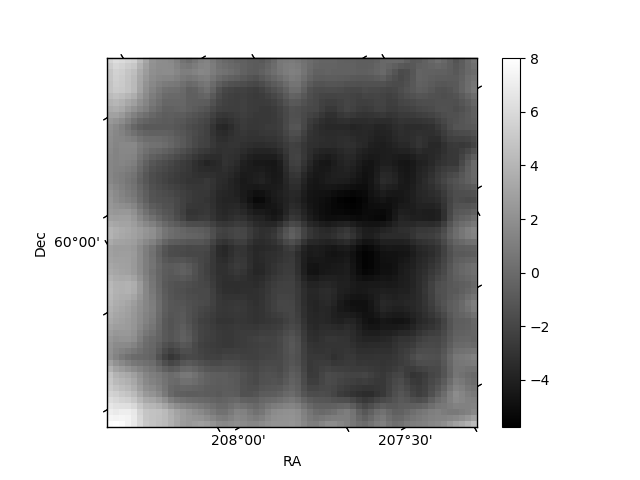
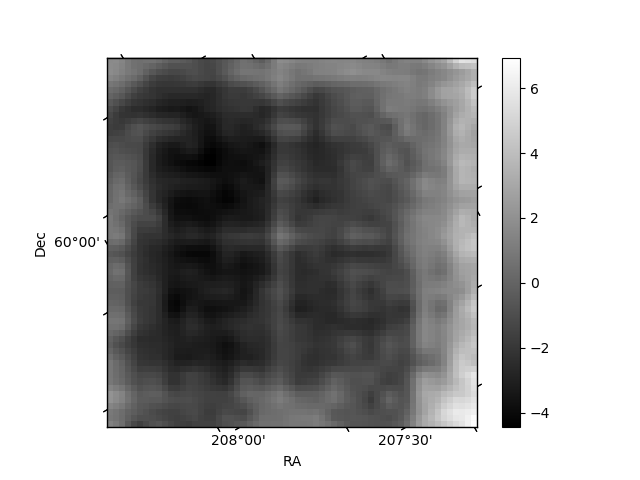
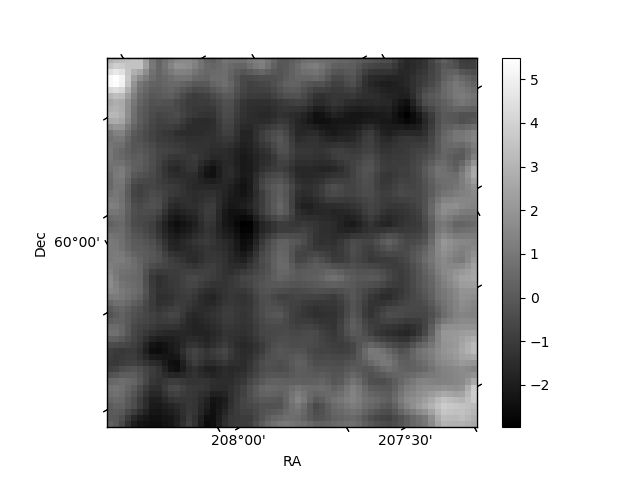
Histogram calculated using DETX and DETY for each event in the final _common_clean file
| Quadrant A | 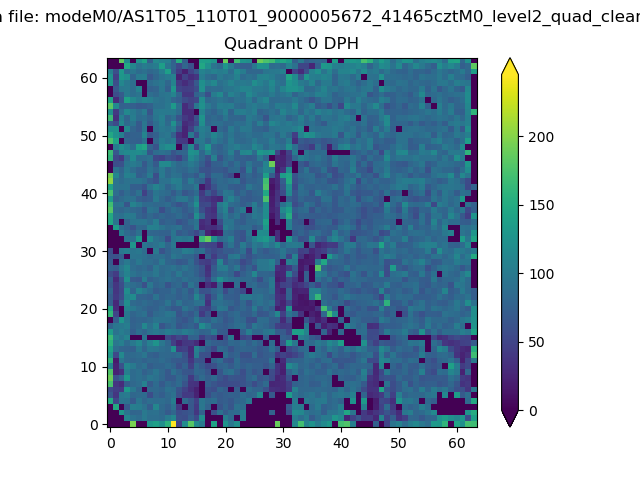 |
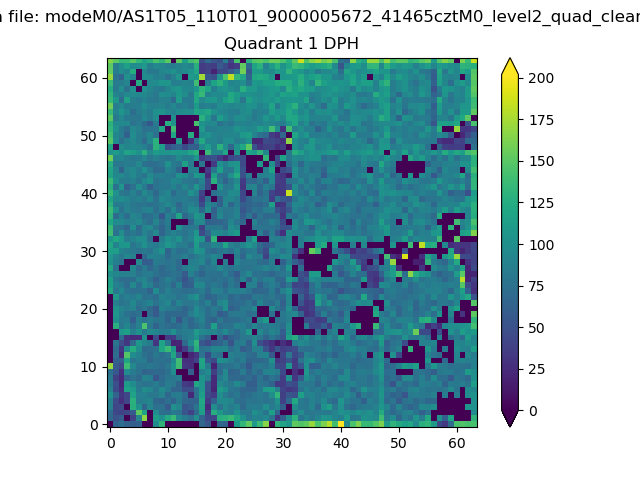 |
Quadrant B |
|---|---|---|---|
| Quadrant D | 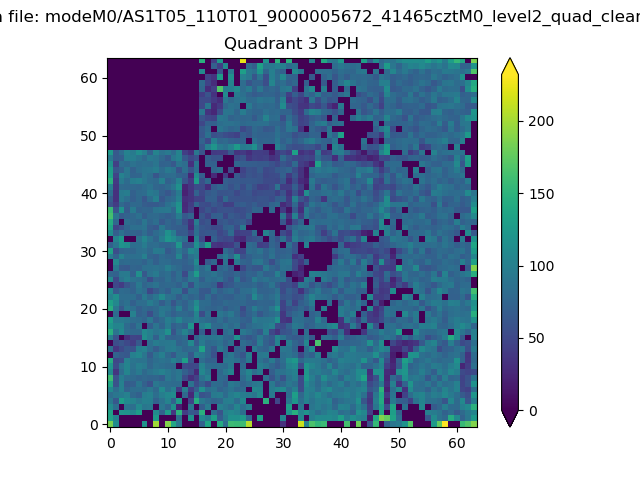 |
 |
Quadrant C |
| Plot type | Count rate plots | Images |
|---|---|---|
| Comparison with Poisson distribution Blue bars denote a histogram of data divided into 1 sec bins. Red curve is a Poisson curve with rate = median count rate of data. |
 |
 |
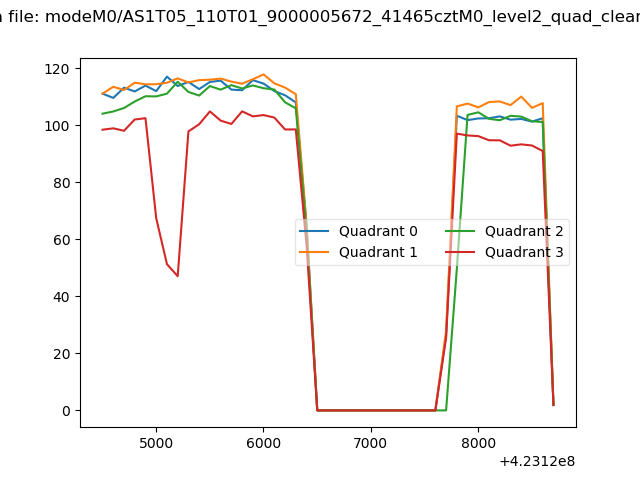
| Quadrant-wise count rates Data is divided into 100 sec bins |
 |
|
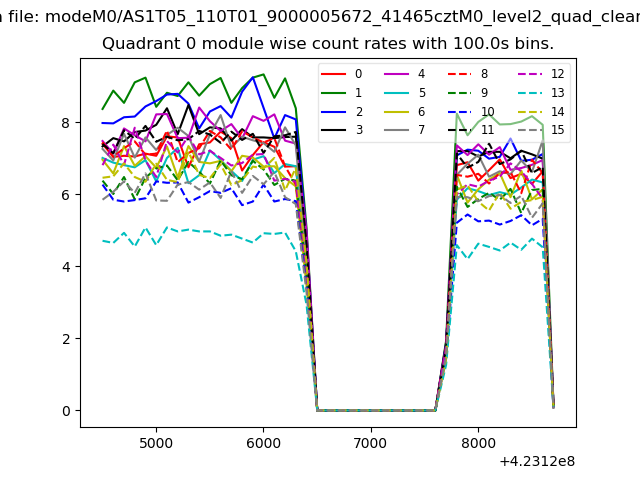
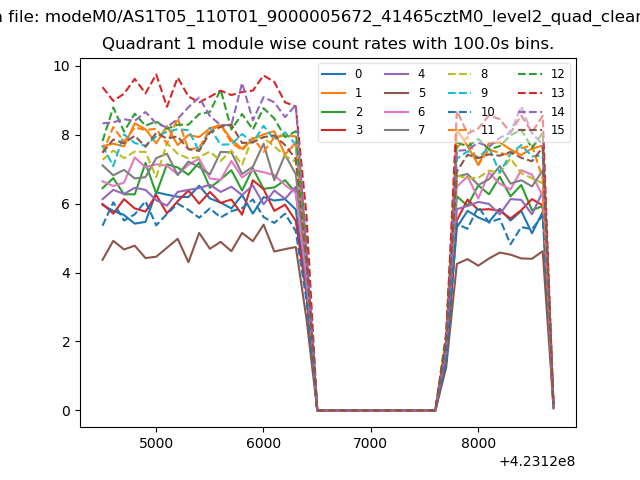
| Module-wise count rates for Quadrant A Data is divided into 100 sec bins |
 |
 |
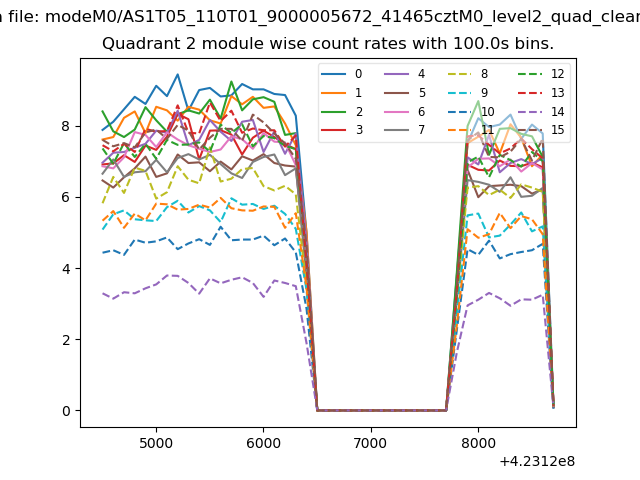
| Module-wise count rates for Quadrant B Data is divided into 100 sec bins |
 |
 |
| Module-wise count rates for Quadrant C Data is divided into 100 sec bins |
 |
 |
| Module-wise count rates for Quadrant D Data is divided into 100 sec bins |
 |
 |
| Parameter | Plot |
|---|---|
| CZT HV Monitor | 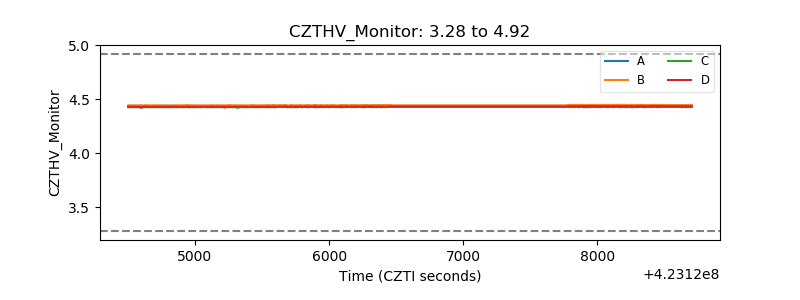 |
| D_VDD | 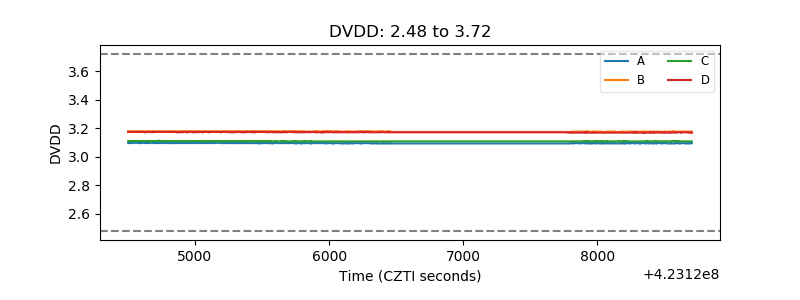 |
| Temperature 1 | 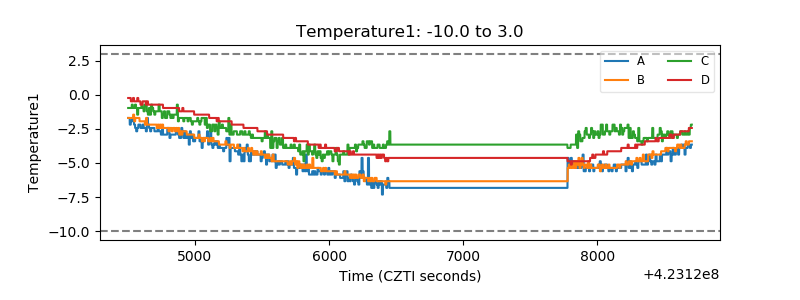 |
| Veto HV Monitor | 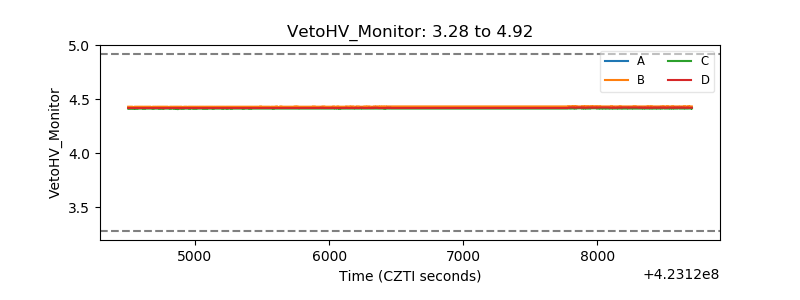 |
| Veto LLD | 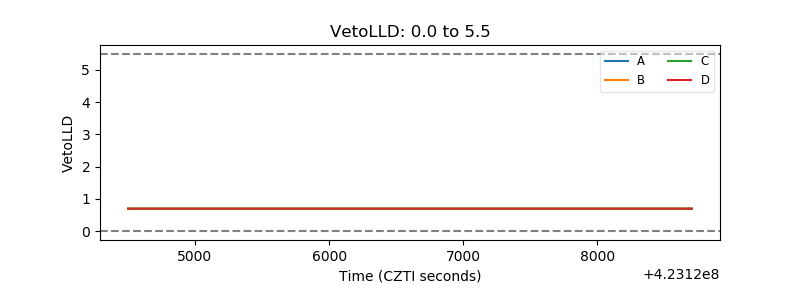 |
| Alpha Counter |  |
| _CPM_Rate | 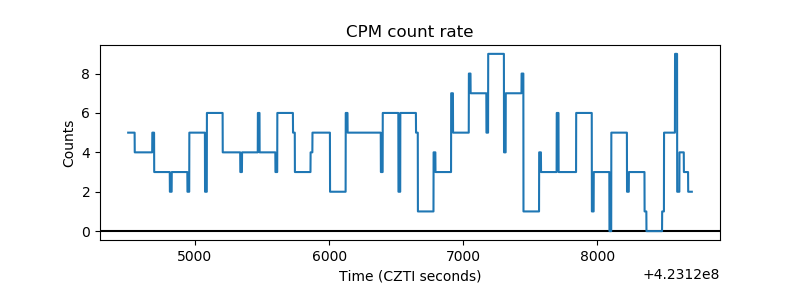 |
| CZT Counter | 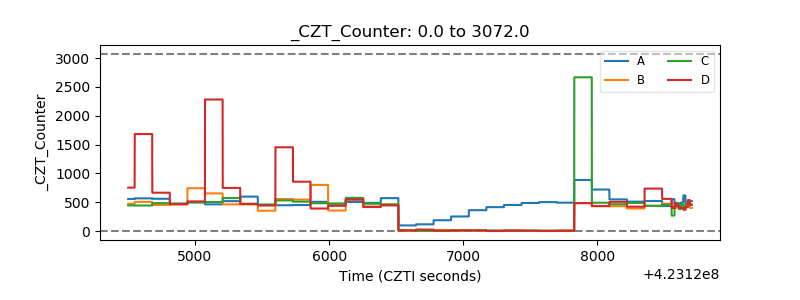 |
| +2.5 Volts monitor |  |
| +5 Volts monitor |  |
| _ROLL_ROT | 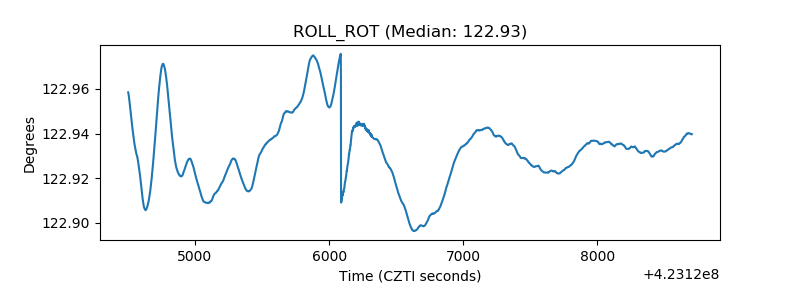 |
| _Roll_DEC | 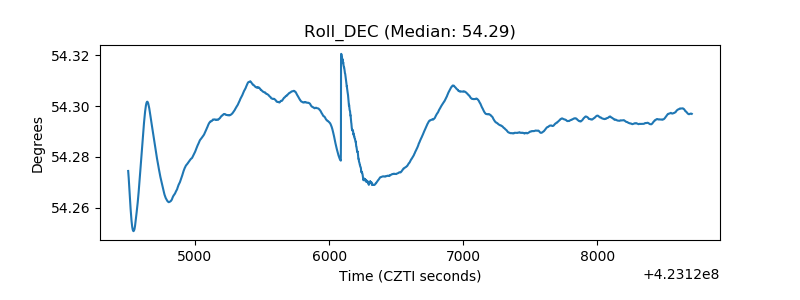 |
| _Roll_RA | 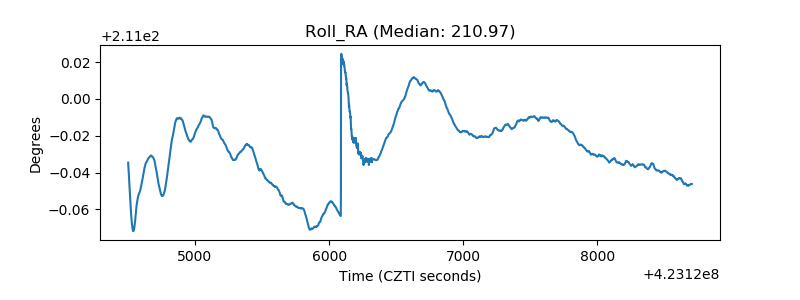 |
| Veto Counter |  |