| Param | Original file | Final file |
|---|---|---|
| Filename | modeM0/AS1T05_110T01_9000005672_41466cztM0_level2.fits | modeM0/AS1T05_110T01_9000005672_41466cztM0_level2_quad_clean.evt |
| Size (bytes) | 318,012,480 | 88,272,000 |
| Size | 303.3 MB | 84.2 MB |
| Events in quadrant A | 2,825,706 | 589,877 |
| Events in quadrant B | 2,571,619 | 606,900 |
| Events in quadrant C | 2,791,332 | 565,383 |
| Events in quadrant D | 3,156,661 | 527,135 |
| Mode SS | |||
|---|---|---|---|
| Quadrant | BADHDUFLAG | Total packets | Discarded packets |
| A | 0 | 112 | 0 |
| B | 0 | 112 | 0 |
| C | 0 | 112 | 0 |
| D | 0 | 112 | 0 |
| Mode M0 | |||
|---|---|---|---|
| Quadrant | BADHDUFLAG | Total packets | Discarded packets |
| A | 0 | 11471 | 1 |
| B | 0 | 11394 | 1 |
| C | 0 | 11647 | 1 |
| D | 0 | 13107 | 1 |
| Mode M9 | |||
|---|---|---|---|
| Quadrant | BADHDUFLAG | Total packets | Discarded packets |
| A | 0 | 14 | 0 |
| B | 0 | 13 | 0 |
| C | 0 | 13 | 0 |
| D | 0 | 13 | 0 |
| Quadrant | Total seconds | Saturated seconds | Saturation percentage |
|---|---|---|---|
| A | 5473 | 11 | 0.200987% |
| B | 5473 | 16 | 0.292344% |
| C | 5473 | 87 | 1.589622% |
| D | 5473 | 68 | 1.242463% |
Noise dominated data is calculated using 1-second bins in cleaned event files. If a bin has >2000 counts, and if more than 50% of those come from <1% of pixels, then it is considered to be noise-dominated and hence unusable.
| Quadrant | # 1 sec bins | Bins with >0 counts | Bins with >2000 counts | High rate bins dominated by noise | Noise dominated (total time) | Noise dominated (detector-on time) | Marked lightcurve |
|---|---|---|---|---|---|---|---|
| A | 6786 | 5474 | 3 | 3 | 0.04% | 0.05% | 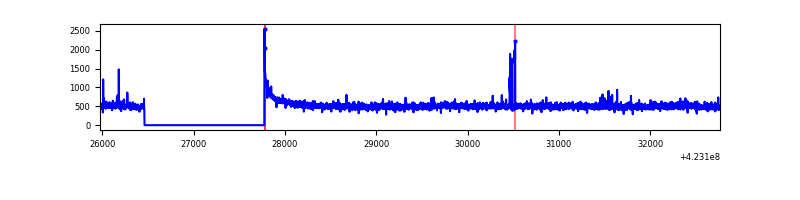 |
| B | 6786 | 5474 | 4 | 4 | 0.06% | 0.07% | 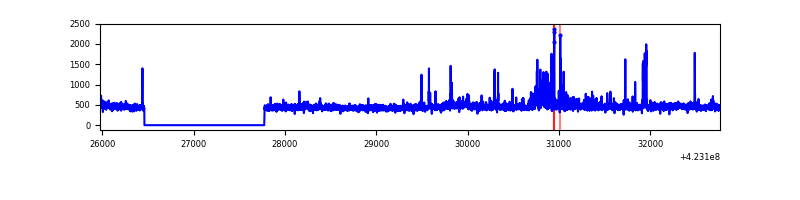 |
| C | 6786 | 5474 | 76 | 76 | 1.12% | 1.39% | 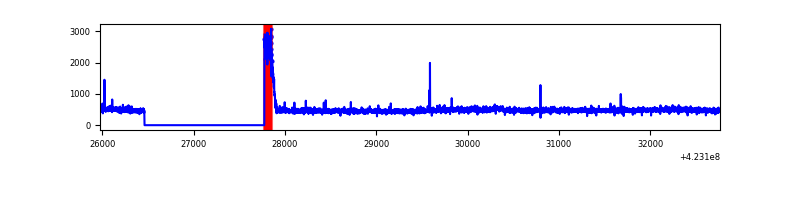 |
| D | 6786 | 5474 | 57 | 57 | 0.84% | 1.04% | 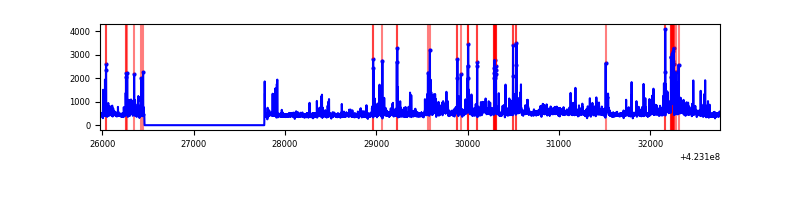 |
Top three noisy pixels from each quadrant. If the there are fewer than three noisy pixels in the level2.evt file, extra rows are filled as -1
| Pixel properties | Quadrant properties | ||||||
|---|---|---|---|---|---|---|---|
| Quadrant | DetID | PixID | Counts | Sigma | Mean | Median | Sigma |
| A | 10 | 83 | 466221 | 3763.43 | 597 | 584 | 123.7 |
| A | 2 | 79 | 32555 | 258.4 | 597 | 584 | 123.7 |
| A | 13 | 248 | 11891 | 91.39 | 597 | 584 | 123.7 |
| B | 5 | 255 | 75041 | 645.95 | 597 | 580 | 115.3 |
| B | 0 | 190 | 71385 | 614.24 | 597 | 580 | 115.3 |
| B | 0 | 245 | 41329 | 353.5 | 597 | 580 | 115.3 |
| C | 0 | 10 | 283051 | 2078.16 | 581 | 584 | 135.9 |
| C | 15 | 214 | 225939 | 1657.98 | 581 | 584 | 135.9 |
| C | 12 | 249 | 10923 | 76.07 | 581 | 584 | 135.9 |
| D | 13 | 249 | 288333 | 1996.88 | 583 | 566 | 144.1 |
| D | 5 | 222 | 210748 | 1458.5 | 583 | 566 | 144.1 |
| D | 1 | 52 | 153683 | 1062.51 | 583 | 566 | 144.1 |
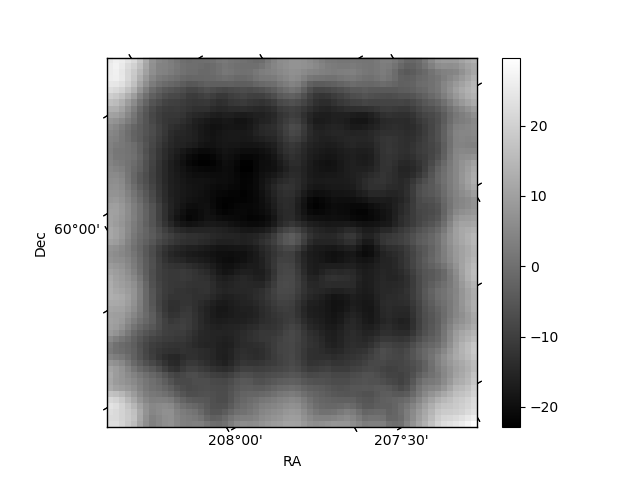
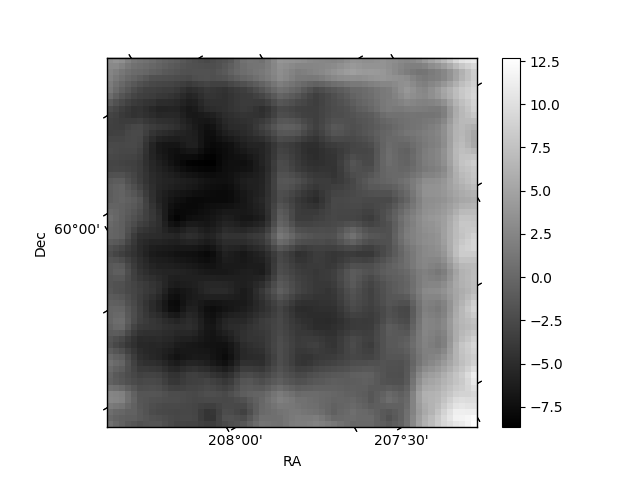
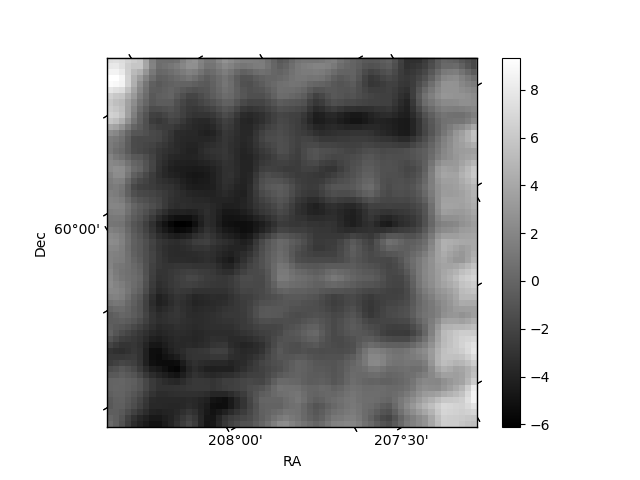
Histogram calculated using DETX and DETY for each event in the final _common_clean file
| Quadrant A | 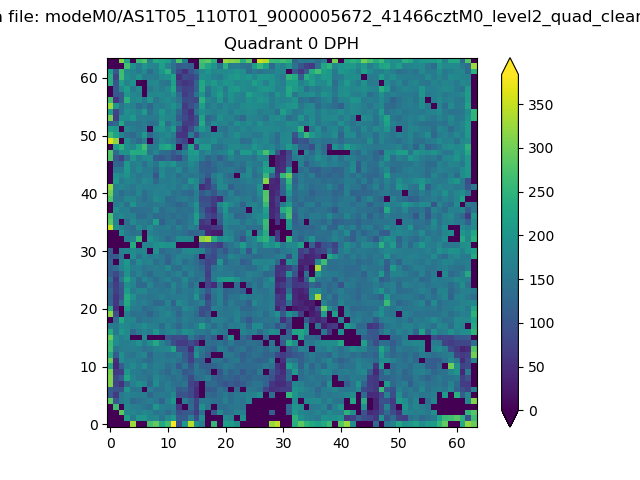 |
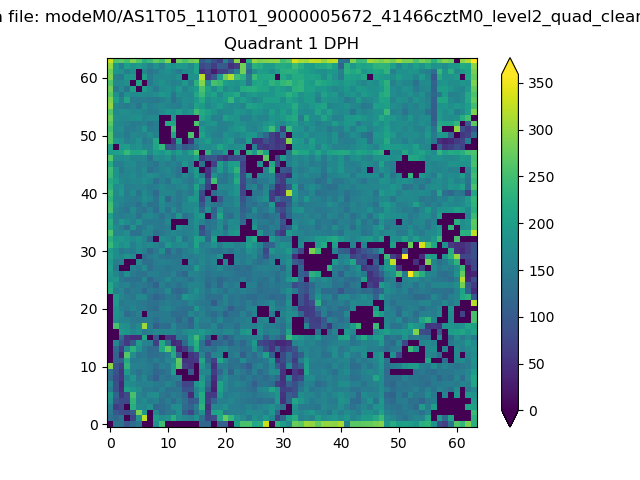 |
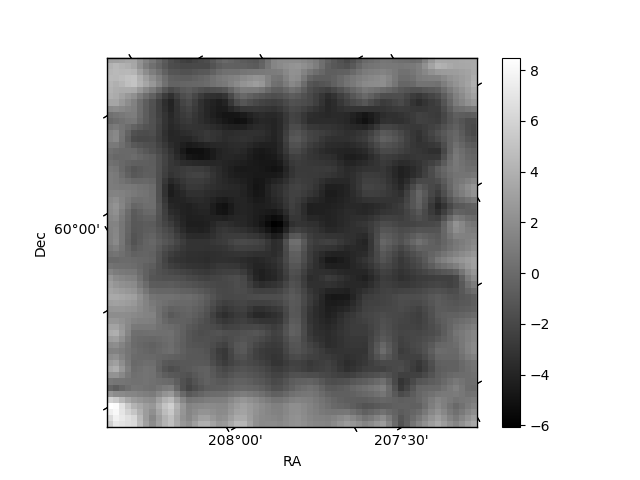
Quadrant B |
|---|---|---|---|
| Quadrant D | 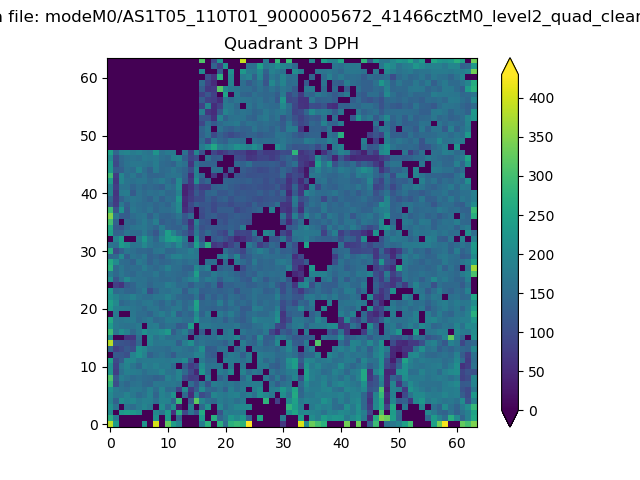 |
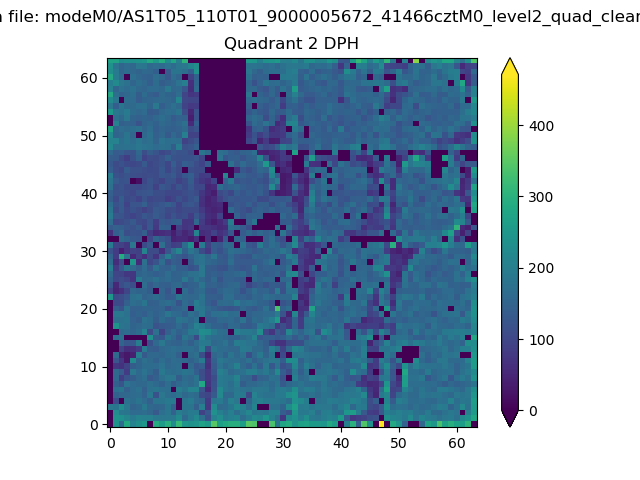 |
Quadrant C |
| Plot type | Count rate plots | Images |
|---|---|---|
| Comparison with Poisson distribution Blue bars denote a histogram of data divided into 1 sec bins. Red curve is a Poisson curve with rate = median count rate of data. |
 |
 |
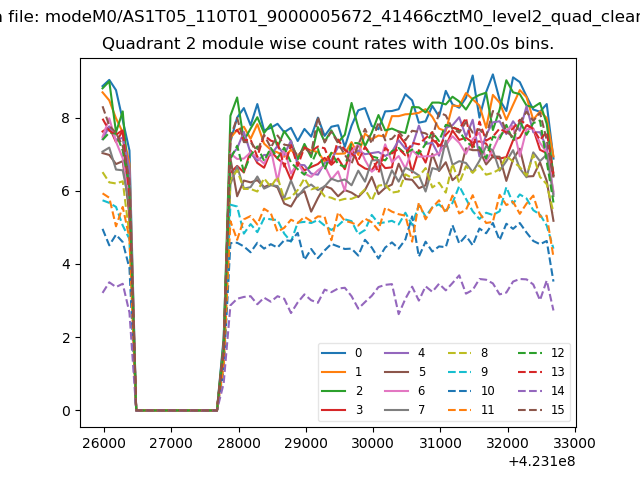
| Quadrant-wise count rates Data is divided into 100 sec bins |
 |
|
| Module-wise count rates for Quadrant A Data is divided into 100 sec bins |
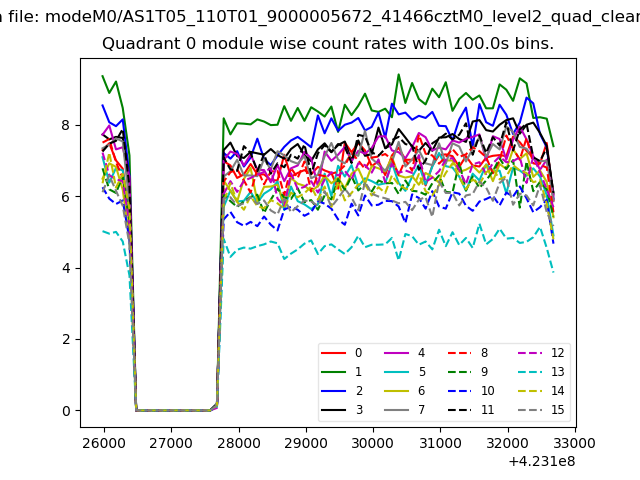 |
 |
| Module-wise count rates for Quadrant B Data is divided into 100 sec bins |
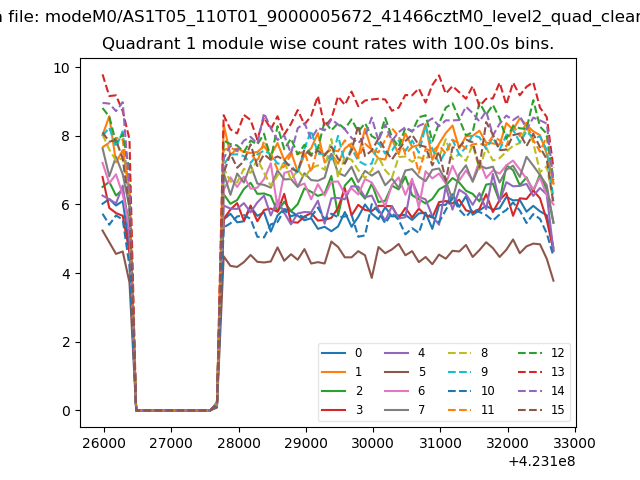 |
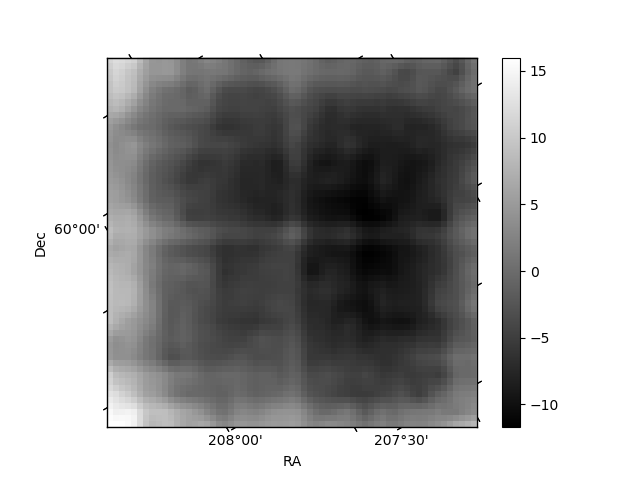 |
| Module-wise count rates for Quadrant C Data is divided into 100 sec bins |
 |
 |
| Module-wise count rates for Quadrant D Data is divided into 100 sec bins |
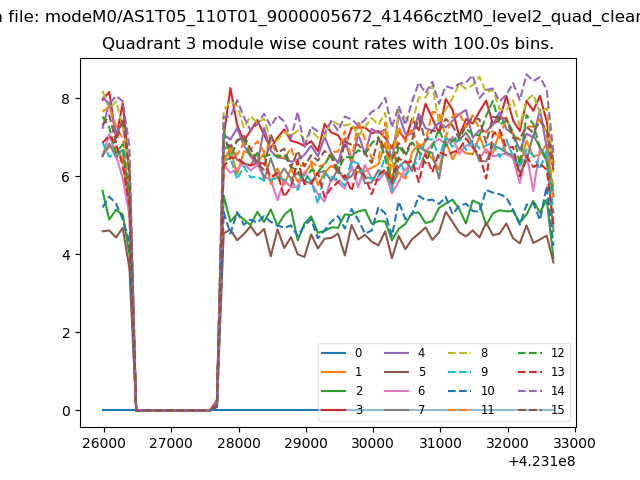 |
 |
| Parameter | Plot |
|---|---|
| CZT HV Monitor | 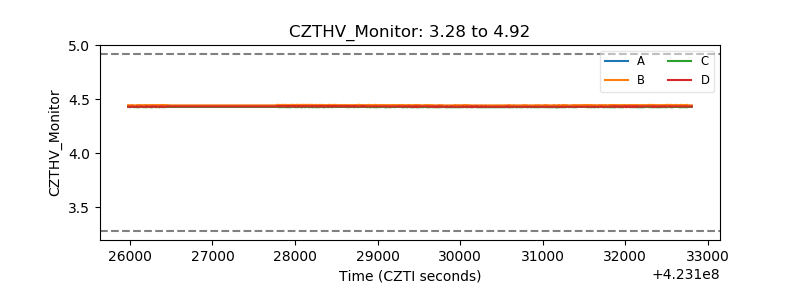 |
| D_VDD | 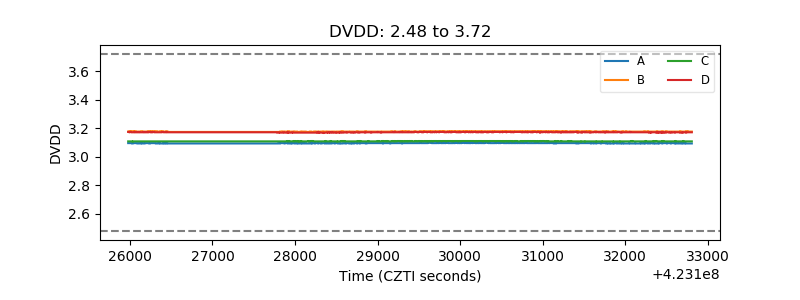 |
| Temperature 1 | 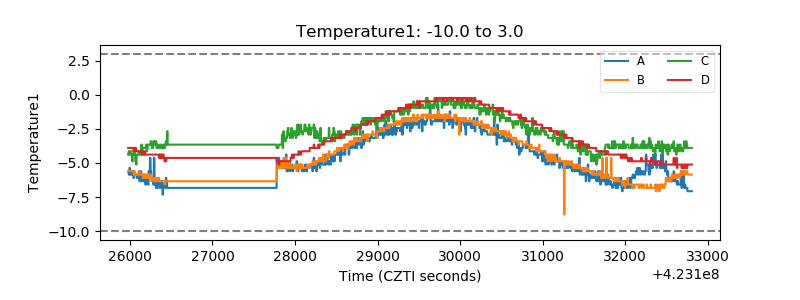 |
| Veto HV Monitor | 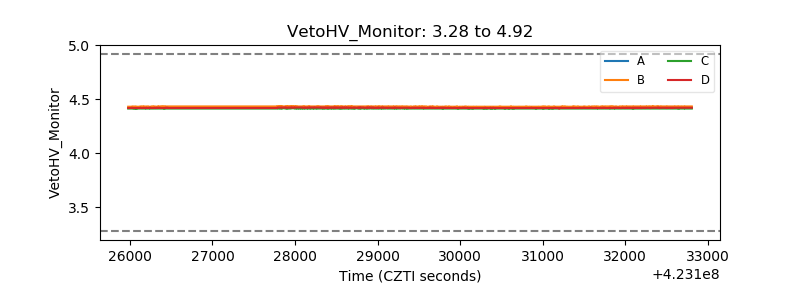 |
| Veto LLD | 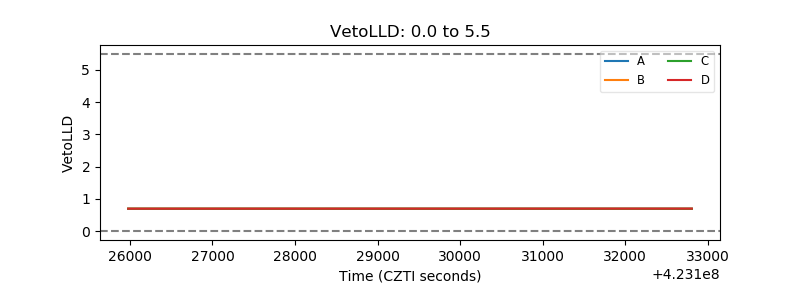 |
| Alpha Counter | 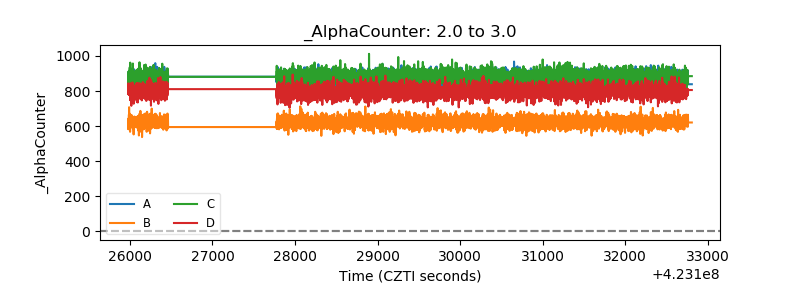 |
| _CPM_Rate | 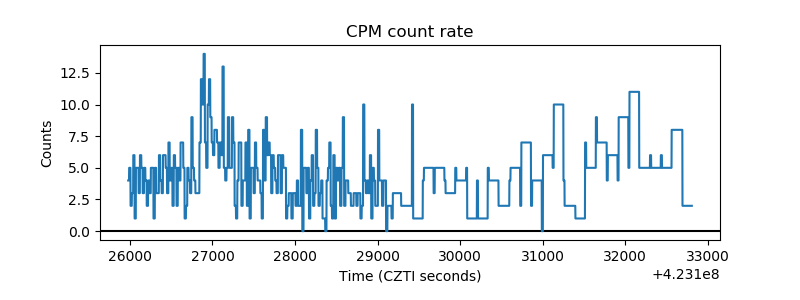 |
| CZT Counter | 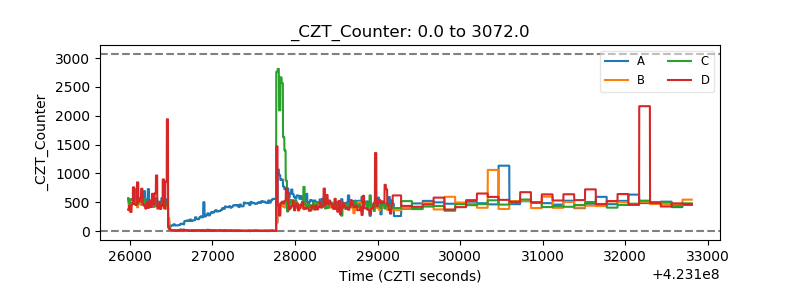 |
| +2.5 Volts monitor |  |
| +5 Volts monitor | 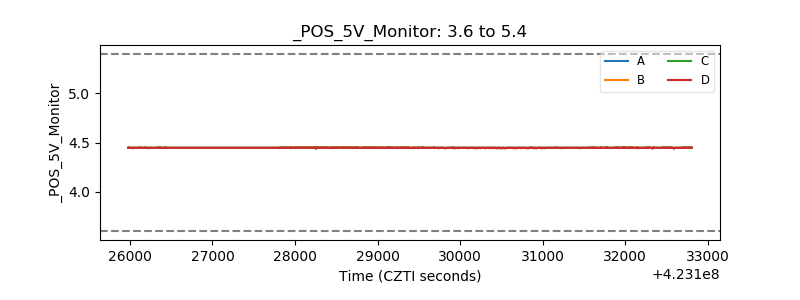 |
| _ROLL_ROT | 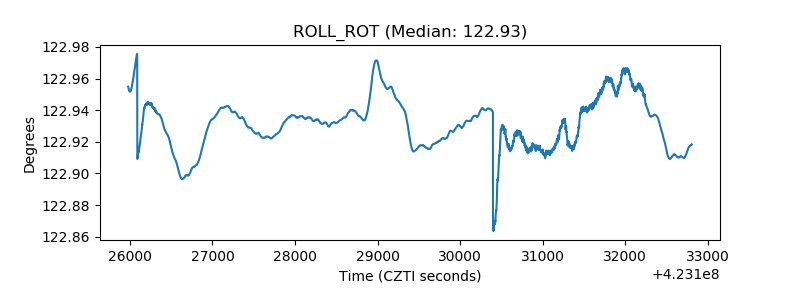 |
| _Roll_DEC | 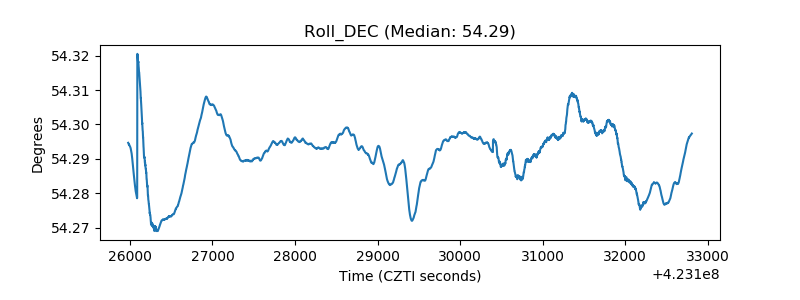 |
| _Roll_RA | 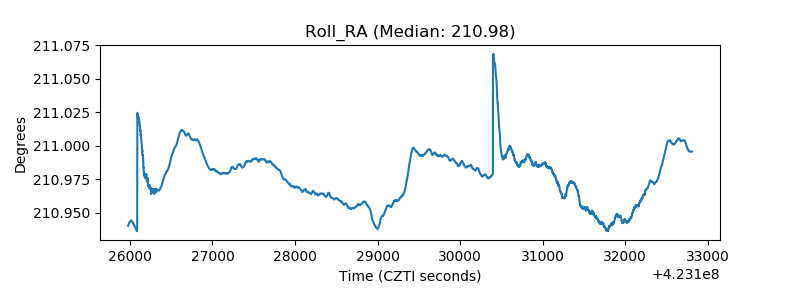 |
| Veto Counter | 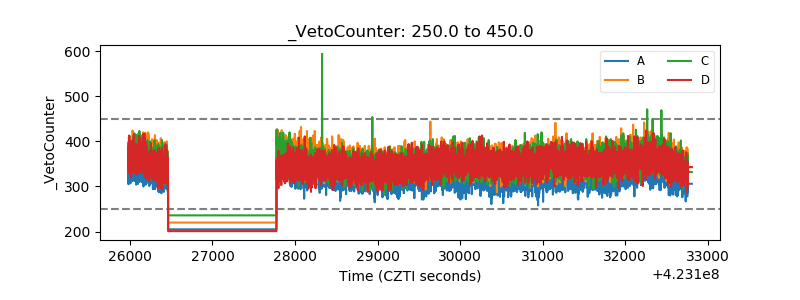 |