| Param | Original file | Final file |
|---|---|---|
| Filename | modeM0/AS1T05_110T01_9000005672_41468cztM0_level2.fits | modeM0/AS1T05_110T01_9000005672_41468cztM0_level2_quad_clean.evt |
| Size (bytes) | 660,646,080 | 176,117,760 |
| Size | 630.0 MB | 168.0 MB |
| Events in quadrant A | 5,861,275 | 1,183,720 |
| Events in quadrant B | 5,236,345 | 1,215,160 |
| Events in quadrant C | 6,053,939 | 1,119,186 |
| Events in quadrant D | 6,447,315 | 1,050,492 |
| Mode SS | |||
|---|---|---|---|
| Quadrant | BADHDUFLAG | Total packets | Discarded packets |
| A | 0 | 226 | 0 |
| B | 0 | 226 | 0 |
| C | 0 | 226 | 0 |
| D | 0 | 226 | 0 |
| Mode M0 | |||
|---|---|---|---|
| Quadrant | BADHDUFLAG | Total packets | Discarded packets |
| A | 0 | 23967 | 4 |
| B | 0 | 23051 | 3 |
| C | 0 | 24643 | 3 |
| D | 0 | 26615 | 3 |
| Mode M9 | |||
|---|---|---|---|
| Quadrant | BADHDUFLAG | Total packets | Discarded packets |
| A | 0 | 41 | 0 |
| B | 0 | 41 | 0 |
| C | 0 | 41 | 0 |
| D | 0 | 41 | 0 |
| Quadrant | Total seconds | Saturated seconds | Saturation percentage |
|---|---|---|---|
| A | 11035 | 49 | 0.444042% |
| B | 11035 | 36 | 0.326235% |
| C | 11035 | 340 | 3.081106% |
| D | 11035 | 237 | 2.147712% |
Noise dominated data is calculated using 1-second bins in cleaned event files. If a bin has >2000 counts, and if more than 50% of those come from <1% of pixels, then it is considered to be noise-dominated and hence unusable.
| Quadrant | # 1 sec bins | Bins with >0 counts | Bins with >2000 counts | High rate bins dominated by noise | Noise dominated (total time) | Noise dominated (detector-on time) | Marked lightcurve |
|---|---|---|---|---|---|---|---|
| A | 15094 | 11038 | 19 | 19 | 0.13% | 0.17% | 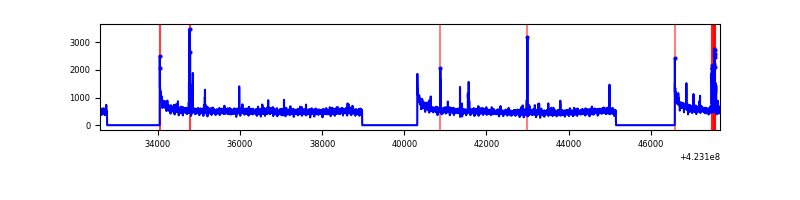 |
| B | 15094 | 11038 | 12 | 12 | 0.08% | 0.11% | 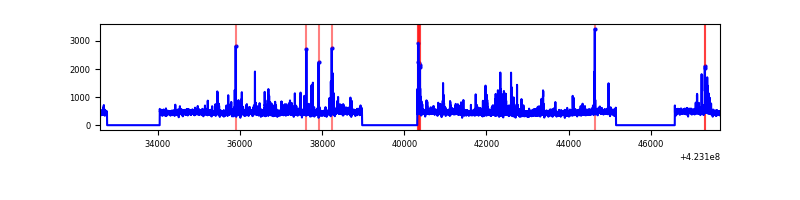 |
| C | 15094 | 11038 | 321 | 321 | 2.13% | 2.91% | 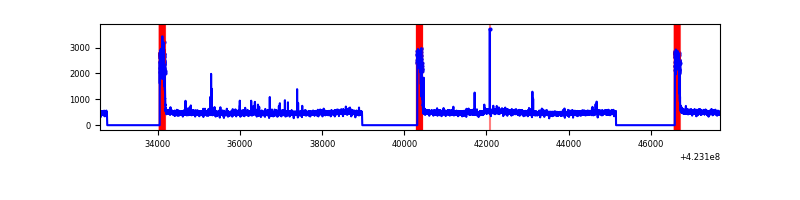 |
| D | 15094 | 11038 | 205 | 205 | 1.36% | 1.86% | 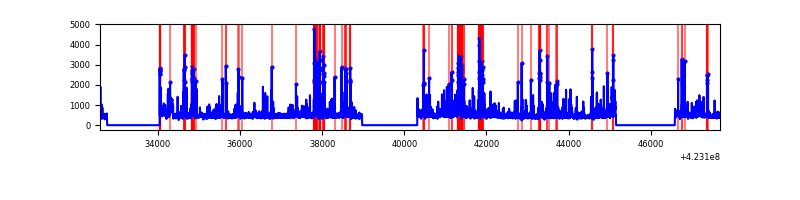 |
Top three noisy pixels from each quadrant. If the there are fewer than three noisy pixels in the level2.evt file, extra rows are filled as -1
| Pixel properties | Quadrant properties | ||||||
|---|---|---|---|---|---|---|---|
| Quadrant | DetID | PixID | Counts | Sigma | Mean | Median | Sigma |
| A | 10 | 83 | 1021089 | 4098.56 | 1208 | 1182 | 248.8 |
| A | 2 | 79 | 93726 | 371.89 | 1208 | 1182 | 248.8 |
| A | 13 | 248 | 62185 | 245.14 | 1208 | 1182 | 248.8 |
| B | 0 | 190 | 188959 | 814.08 | 1200 | 1164 | 230.7 |
| B | 5 | 255 | 168901 | 727.13 | 1200 | 1164 | 230.7 |
| B | 0 | 245 | 74697 | 318.76 | 1200 | 1164 | 230.7 |
| C | 0 | 10 | 936713 | 3497.0 | 1157 | 1162 | 267.5 |
| C | 15 | 214 | 455835 | 1699.52 | 1157 | 1162 | 267.5 |
| C | 0 | 15 | 103378 | 382.07 | 1157 | 1162 | 267.5 |
| D | 13 | 249 | 635080 | 2217.18 | 1169 | 1134 | 285.9 |
| D | 5 | 222 | 402261 | 1402.91 | 1169 | 1134 | 285.9 |
| D | 1 | 47 | 317804 | 1107.53 | 1169 | 1134 | 285.9 |
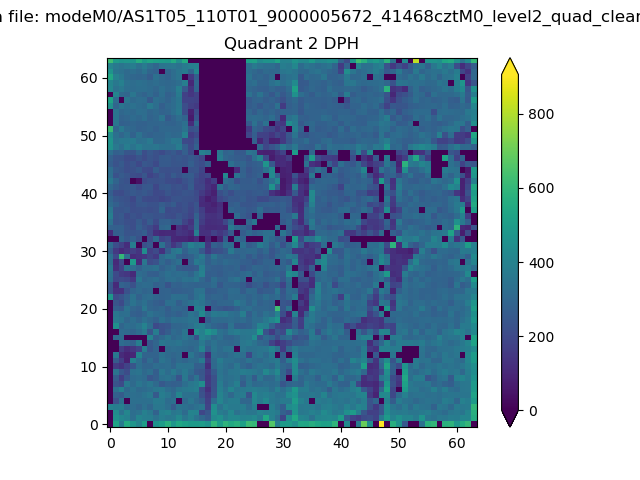
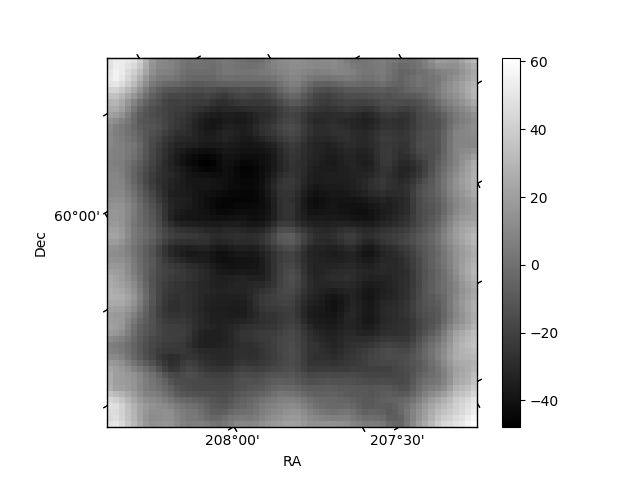
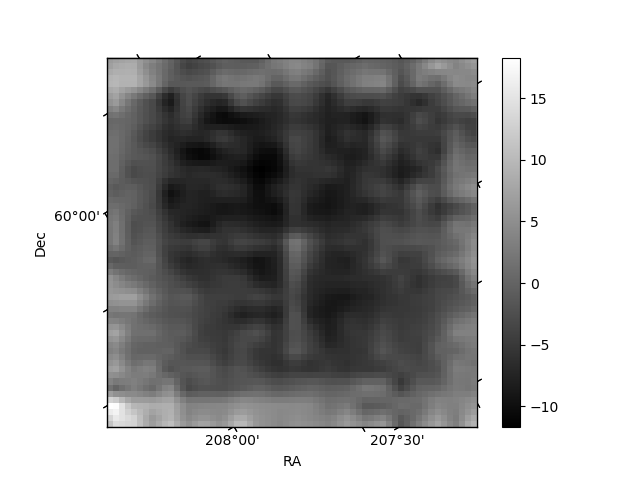
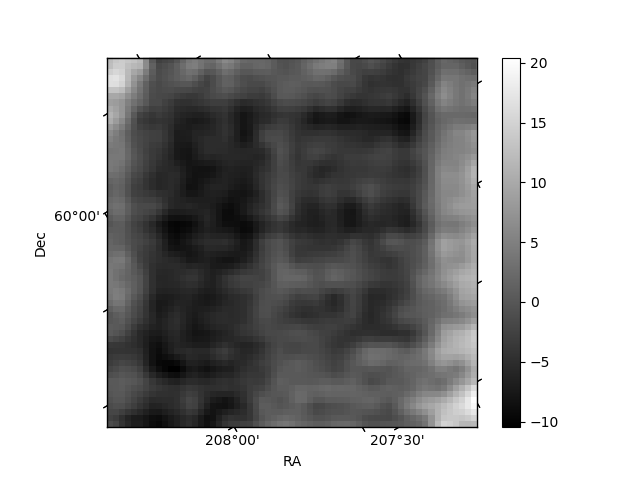
Histogram calculated using DETX and DETY for each event in the final _common_clean file
| Quadrant A | 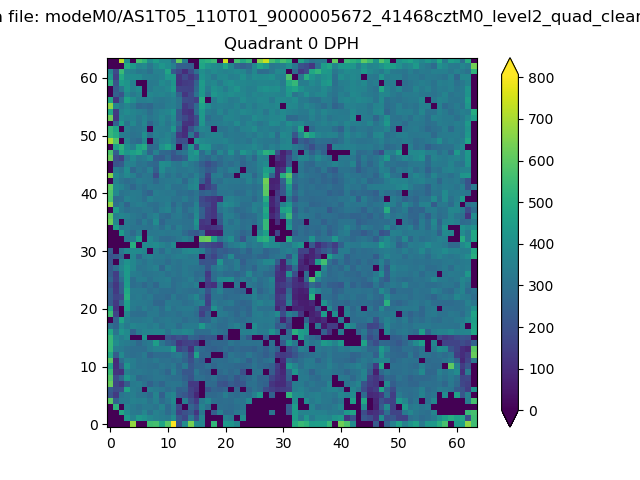 |
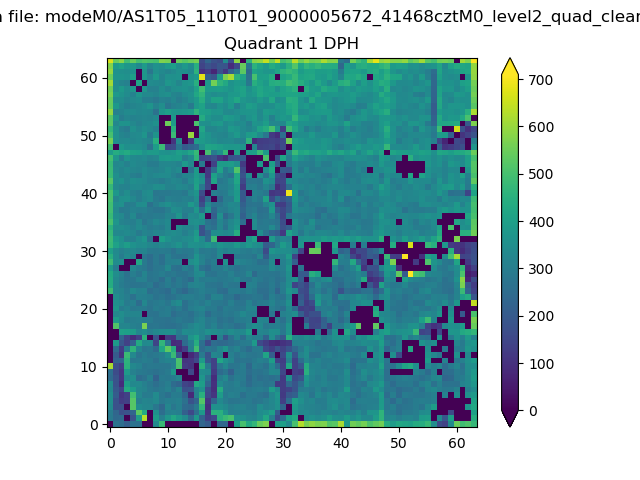 |
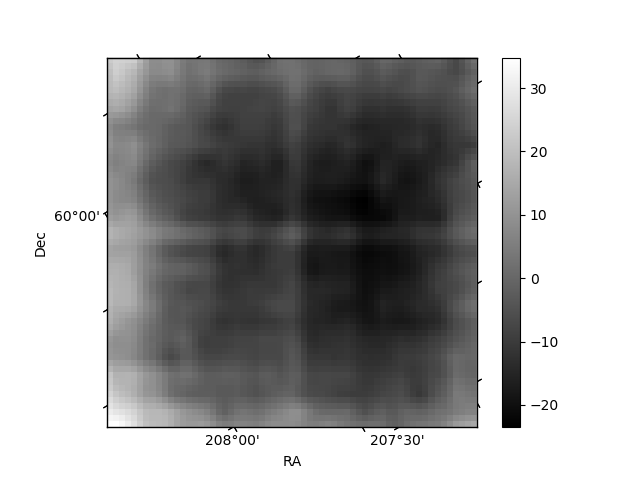
Quadrant B |
|---|---|---|---|
| Quadrant D | 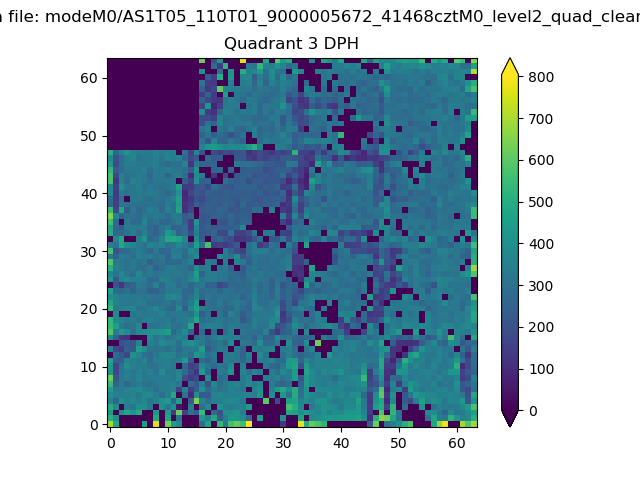 |
 |
Quadrant C |
| Plot type | Count rate plots | Images |
|---|---|---|
| Comparison with Poisson distribution Blue bars denote a histogram of data divided into 1 sec bins. Red curve is a Poisson curve with rate = median count rate of data. |
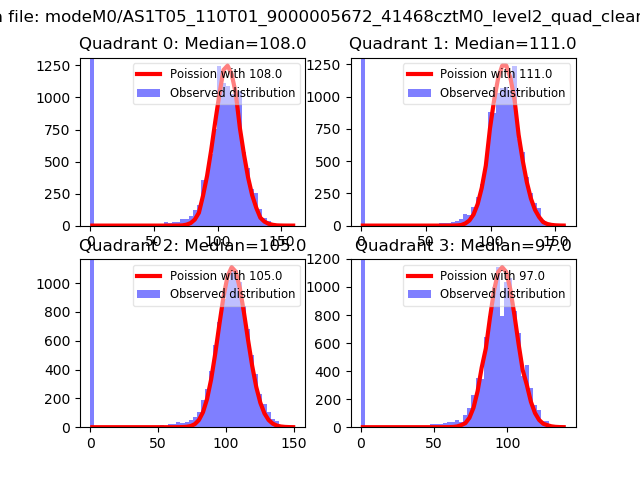 |
 |
| Quadrant-wise count rates Data is divided into 100 sec bins |
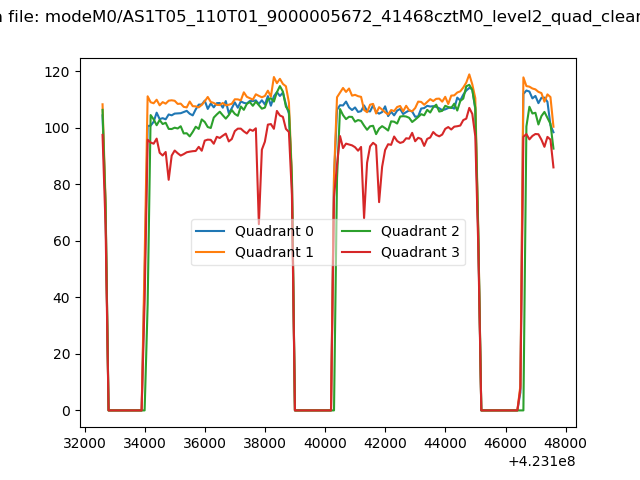 |
|
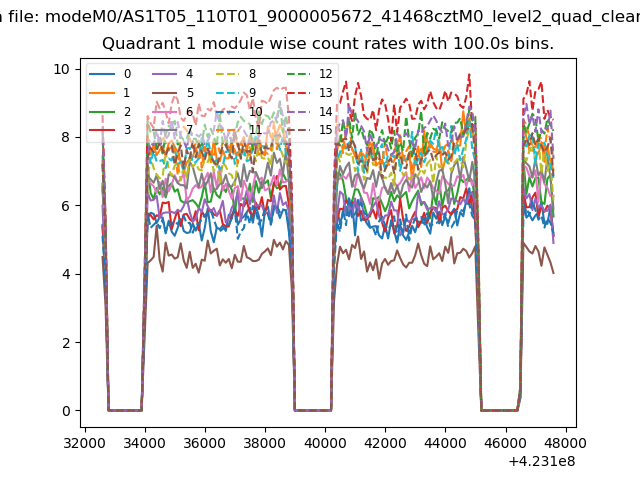
| Module-wise count rates for Quadrant A Data is divided into 100 sec bins |
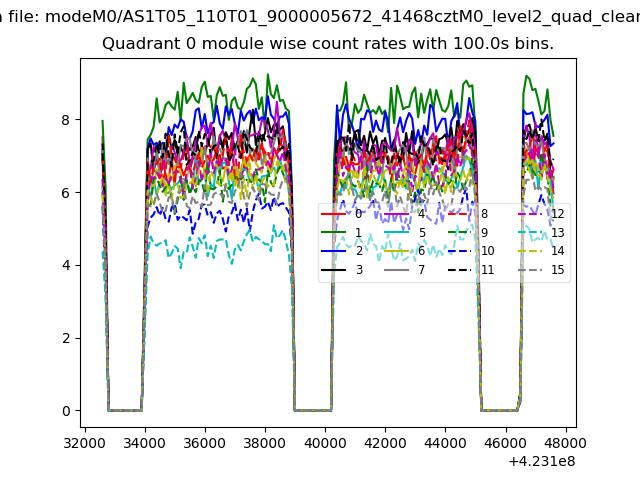 |
 |
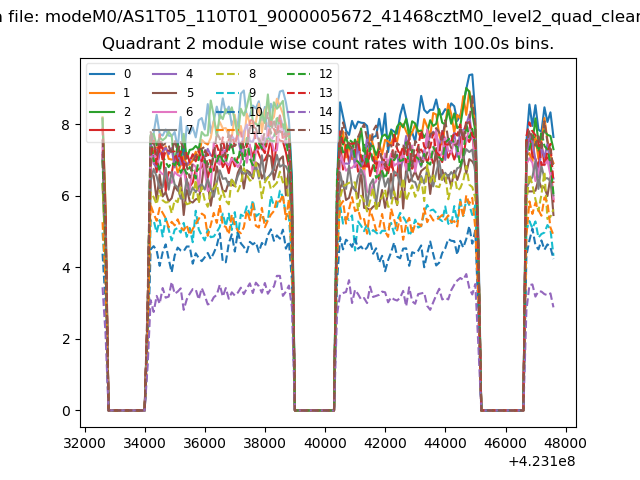
| Module-wise count rates for Quadrant B Data is divided into 100 sec bins |
 |
 |
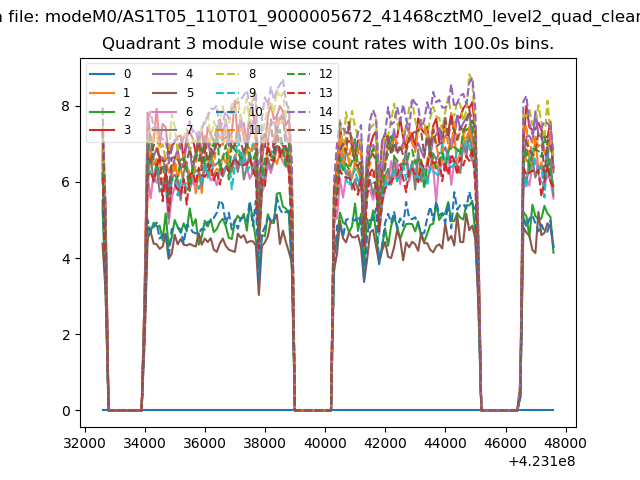
| Module-wise count rates for Quadrant C Data is divided into 100 sec bins |
 |
 |
| Module-wise count rates for Quadrant D Data is divided into 100 sec bins |
 |
 |
| Parameter | Plot |
|---|---|
| CZT HV Monitor | 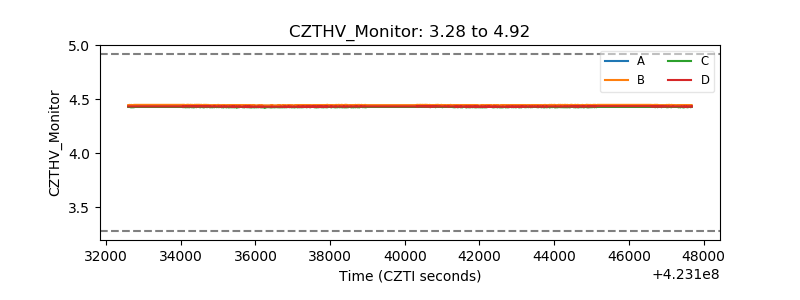 |
| D_VDD | 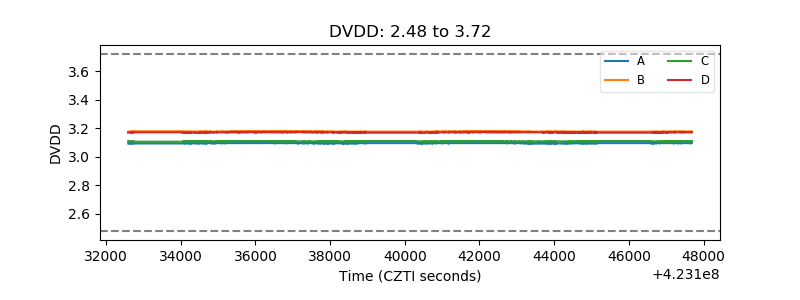 |
| Temperature 1 | 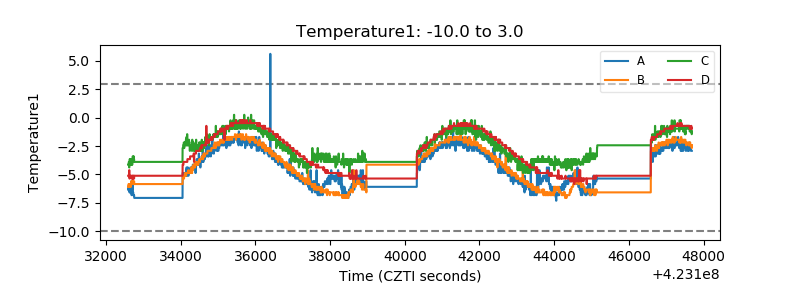 |
| Veto HV Monitor | 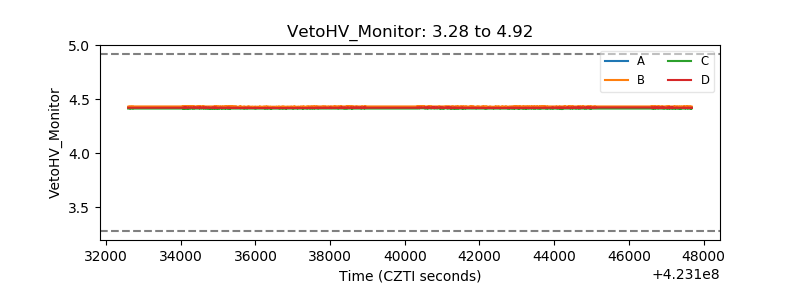 |
| Veto LLD | 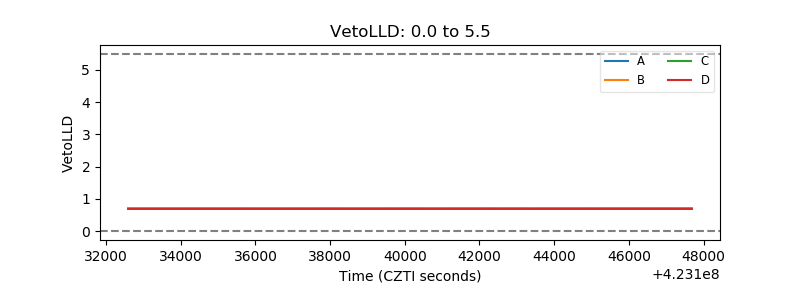 |
| Alpha Counter | 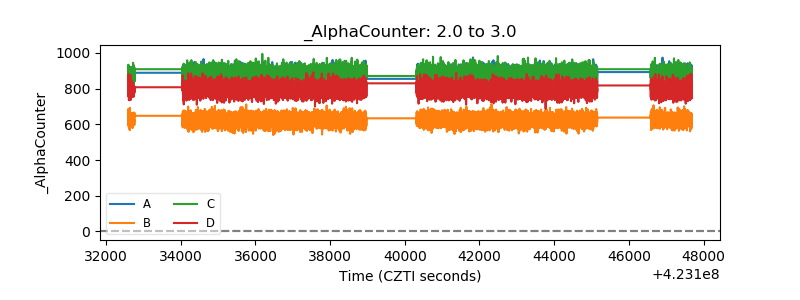 |
| _CPM_Rate | 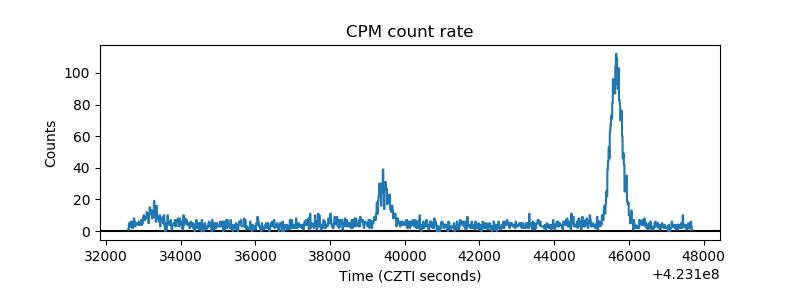 |
| CZT Counter | 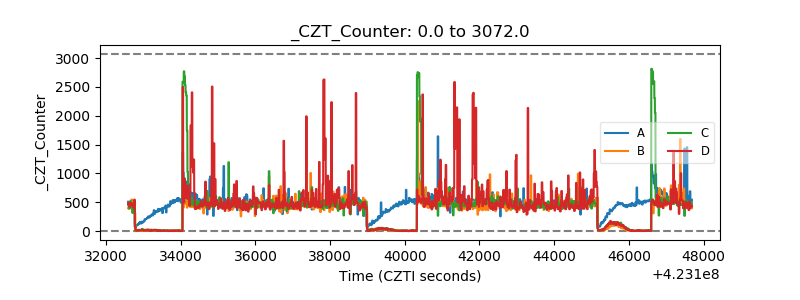 |
| +2.5 Volts monitor |  |
| +5 Volts monitor | 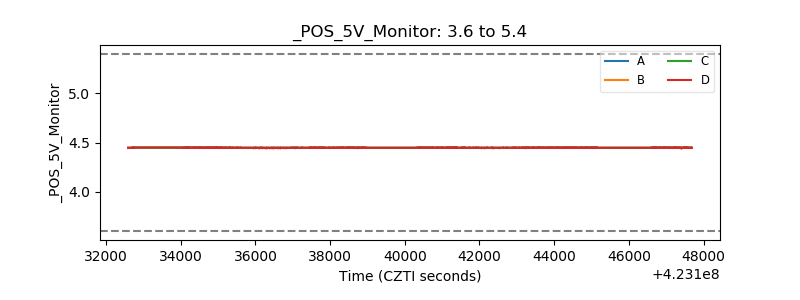 |
| _ROLL_ROT | 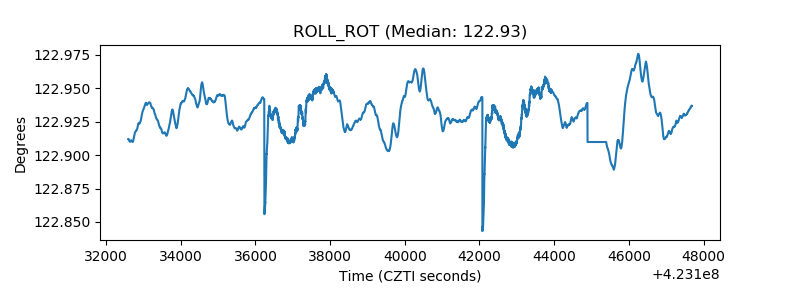 |
| _Roll_DEC |  |
| _Roll_RA | 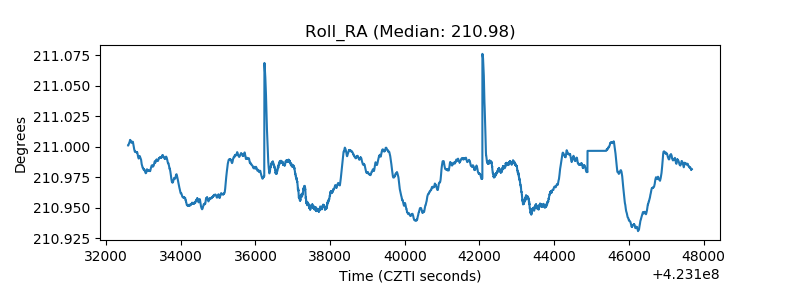 |
| Veto Counter | 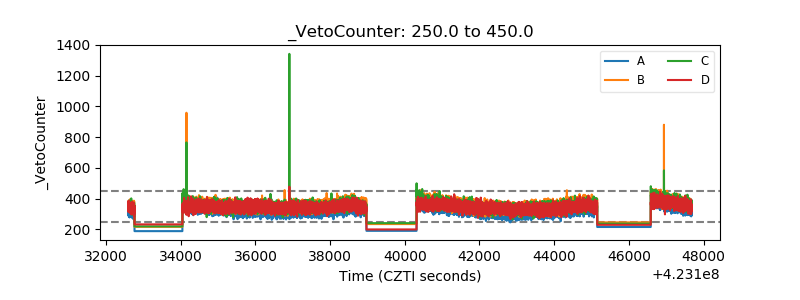 |