| Param | Original file | Final file |
|---|---|---|
| Filename | modeM0/AS1T05_110T01_9000005672_41469cztM0_level2.fits | modeM0/AS1T05_110T01_9000005672_41469cztM0_level2_quad_clean.evt |
| Size (bytes) | 112,979,520 | 29,165,760 |
| Size | 107.7 MB | 27.8 MB |
| Events in quadrant A | 1,120,329 | 197,843 |
| Events in quadrant B | 878,432 | 201,933 |
| Events in quadrant C | 1,133,009 | 175,956 |
| Events in quadrant D | 905,959 | 174,581 |
| Mode SS | |||
|---|---|---|---|
| Quadrant | BADHDUFLAG | Total packets | Discarded packets |
| A | 0 | 38 | 0 |
| B | 0 | 38 | 0 |
| C | 0 | 38 | 0 |
| D | 0 | 38 | 0 |
| Mode M0 | |||
|---|---|---|---|
| Quadrant | BADHDUFLAG | Total packets | Discarded packets |
| A | 0 | 4481 | 1 |
| B | 0 | 3834 | 1 |
| C | 0 | 4433 | 1 |
| D | 0 | 3934 | 1 |
| Mode M9 | |||
|---|---|---|---|
| Quadrant | BADHDUFLAG | Total packets | Discarded packets |
| A | 0 | 14 | 0 |
| B | 0 | 14 | 0 |
| C | 0 | 14 | 0 |
| D | 0 | 14 | 0 |
| Quadrant | Total seconds | Saturated seconds | Saturation percentage |
|---|---|---|---|
| A | 1820 | 23 | 1.263736% |
| B | 1820 | 6 | 0.329670% |
| C | 1820 | 117 | 6.428571% |
| D | 1820 | 12 | 0.659341% |
Noise dominated data is calculated using 1-second bins in cleaned event files. If a bin has >2000 counts, and if more than 50% of those come from <1% of pixels, then it is considered to be noise-dominated and hence unusable.
| Quadrant | # 1 sec bins | Bins with >0 counts | Bins with >2000 counts | High rate bins dominated by noise | Noise dominated (total time) | Noise dominated (detector-on time) | Marked lightcurve |
|---|---|---|---|---|---|---|---|
| A | 3253 | 1821 | 15 | 15 | 0.46% | 0.82% | 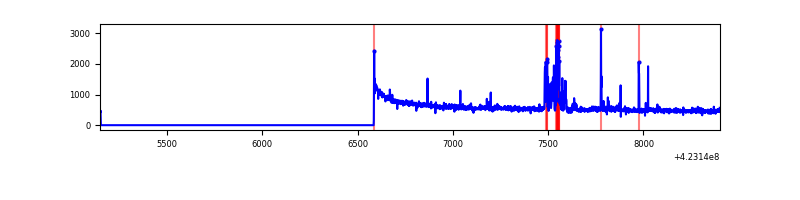 |
| B | 3253 | 1821 | 2 | 2 | 0.06% | 0.11% | 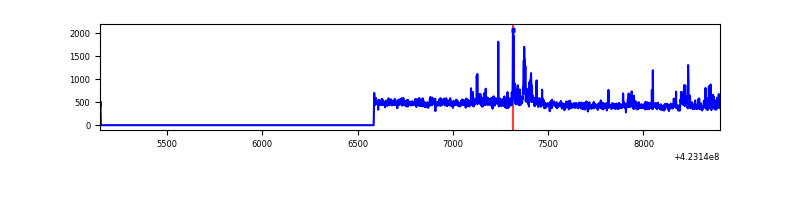 |
| C | 3253 | 1821 | 109 | 109 | 3.35% | 5.99% | 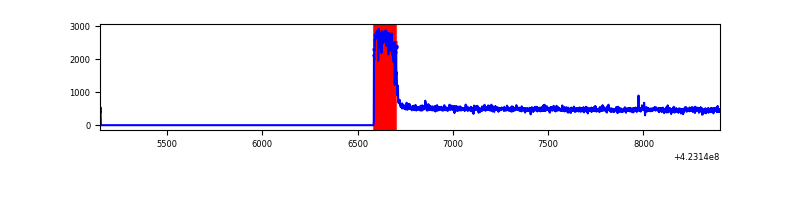 |
| D | 3253 | 1821 | 9 | 9 | 0.28% | 0.49% | 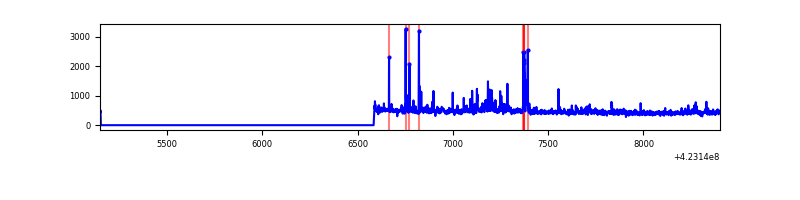 |
Top three noisy pixels from each quadrant. If the there are fewer than three noisy pixels in the level2.evt file, extra rows are filled as -1
| Pixel properties | Quadrant properties | ||||||
|---|---|---|---|---|---|---|---|
| Quadrant | DetID | PixID | Counts | Sigma | Mean | Median | Sigma |
| A | 10 | 83 | 221564 | 4983.46 | 205 | 200 | 44.4 |
| A | 2 | 79 | 75300 | 1690.69 | 205 | 200 | 44.4 |
| A | 13 | 248 | 26624 | 594.87 | 205 | 200 | 44.4 |
| B | 5 | 255 | 46706 | 1136.14 | 201 | 195 | 40.9 |
| B | 0 | 190 | 34003 | 825.84 | 201 | 195 | 40.9 |
| B | 4 | 81 | 4712 | 110.34 | 201 | 195 | 40.9 |
| C | 0 | 10 | 307629 | 6670.99 | 190 | 190 | 46.1 |
| C | 15 | 214 | 76611 | 1658.23 | 190 | 190 | 46.1 |
| C | 10 | 70 | 2118 | 41.83 | 190 | 190 | 46.1 |
| D | 13 | 249 | 51712 | 1010.3 | 200 | 193 | 51.0 |
| D | 1 | 52 | 25658 | 499.37 | 200 | 193 | 51.0 |
| D | 10 | 199 | 17095 | 331.45 | 200 | 193 | 51.0 |
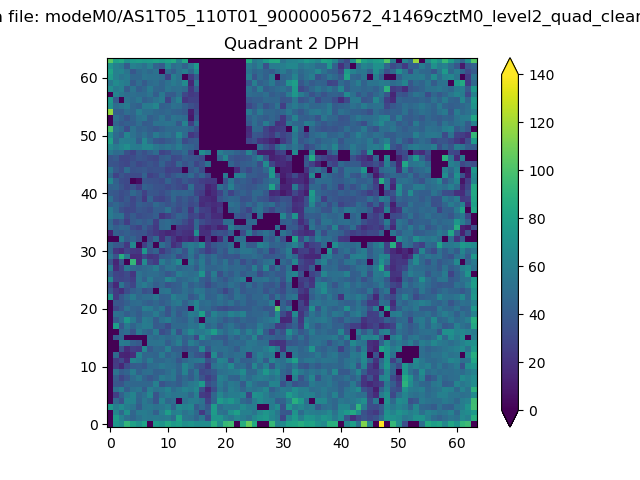
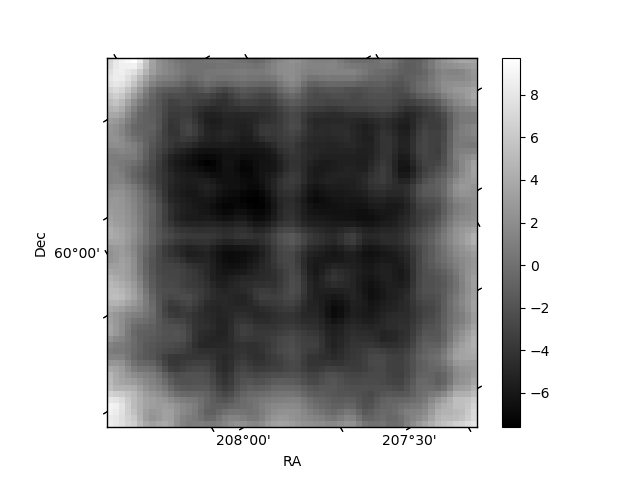
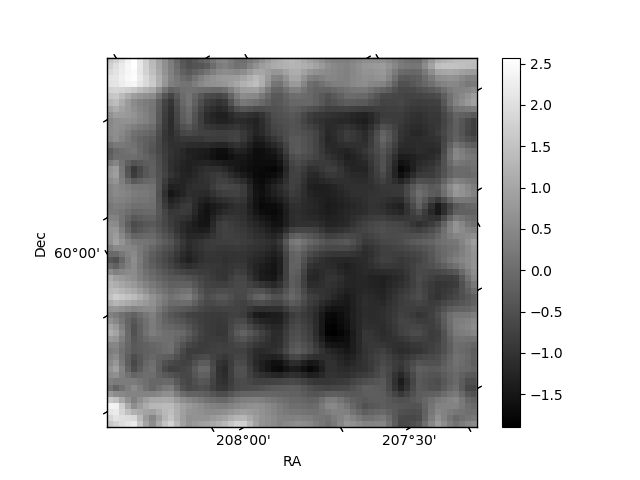
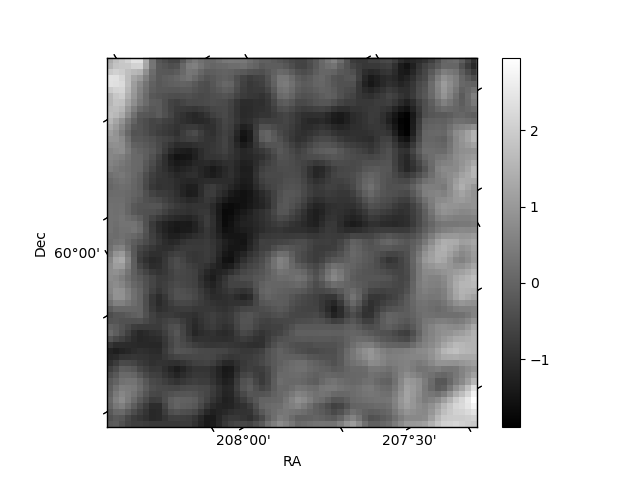
Histogram calculated using DETX and DETY for each event in the final _common_clean file
| Quadrant A | 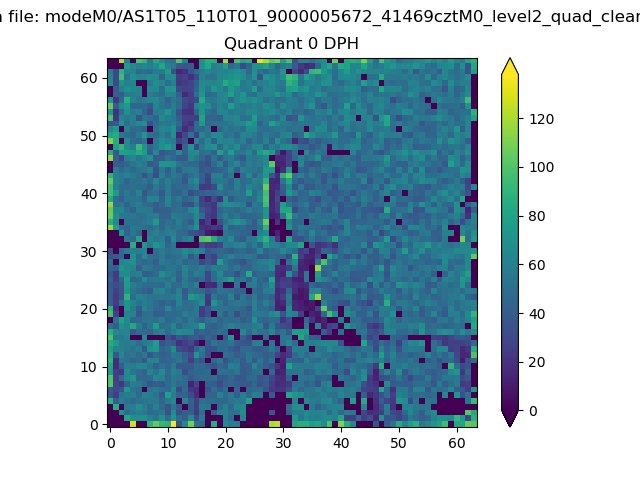 |
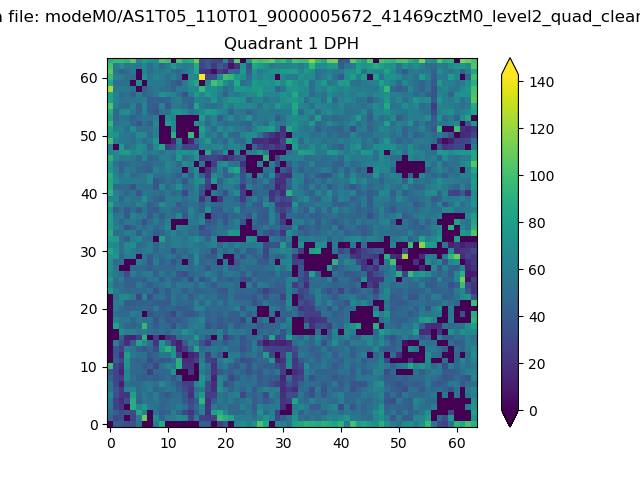 |
Quadrant B |
|---|---|---|---|
| Quadrant D | 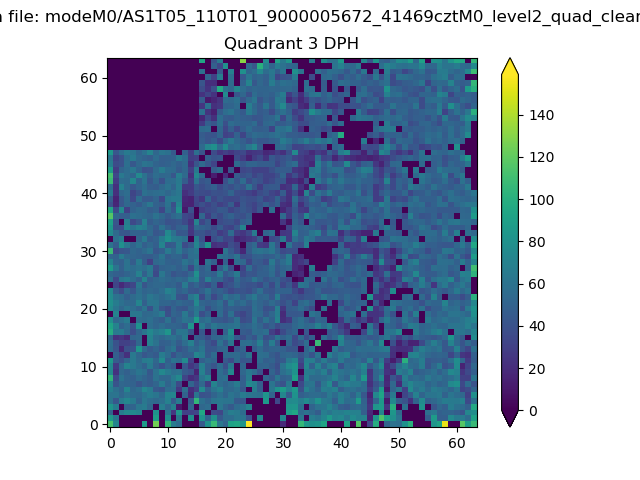 |
 |
Quadrant C |
| Plot type | Count rate plots | Images |
|---|---|---|
| Comparison with Poisson distribution Blue bars denote a histogram of data divided into 1 sec bins. Red curve is a Poisson curve with rate = median count rate of data. |
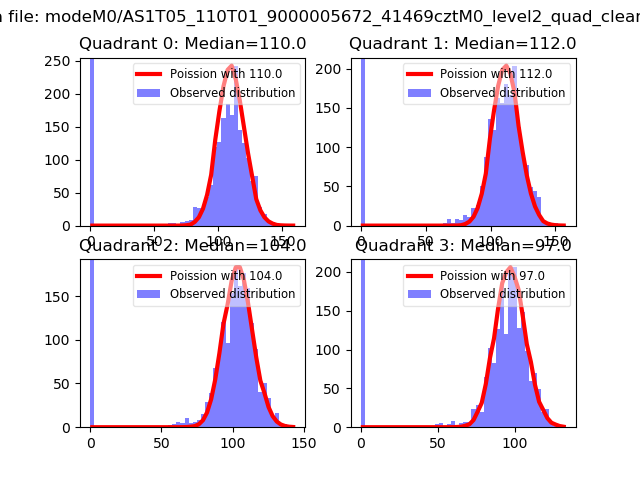 |
 |
| Quadrant-wise count rates Data is divided into 100 sec bins |
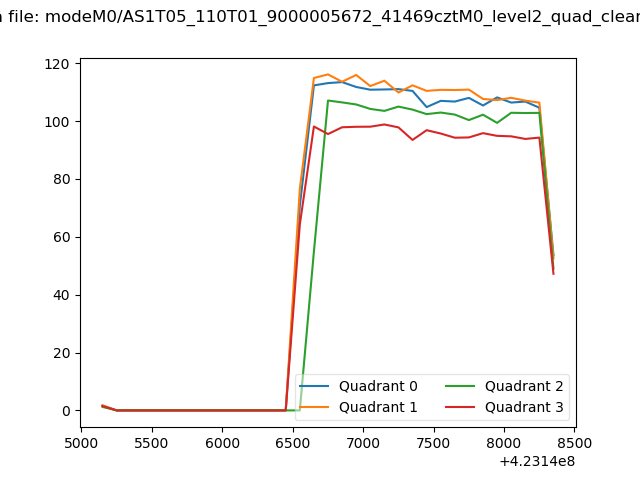 |
|
| Module-wise count rates for Quadrant A Data is divided into 100 sec bins |
 |
 |
| Module-wise count rates for Quadrant B Data is divided into 100 sec bins |
 |
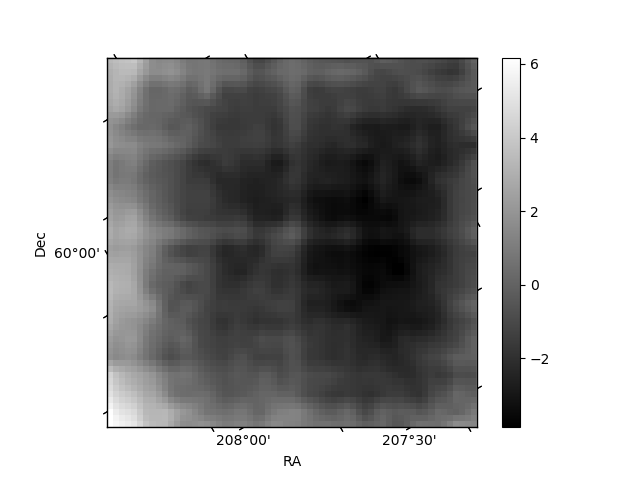 |
| Module-wise count rates for Quadrant C Data is divided into 100 sec bins |
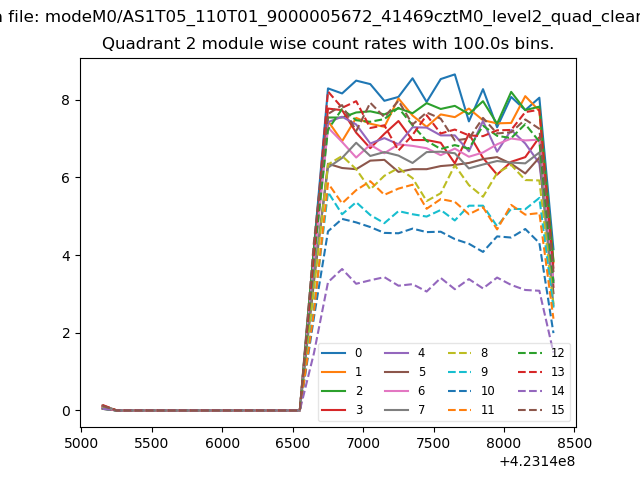 |
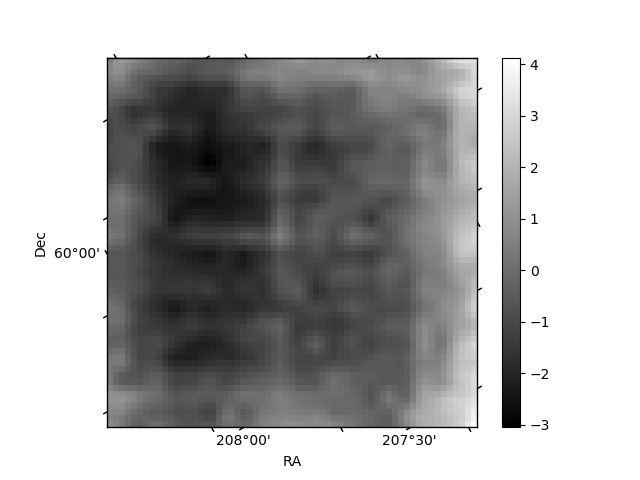 |
| Module-wise count rates for Quadrant D Data is divided into 100 sec bins |
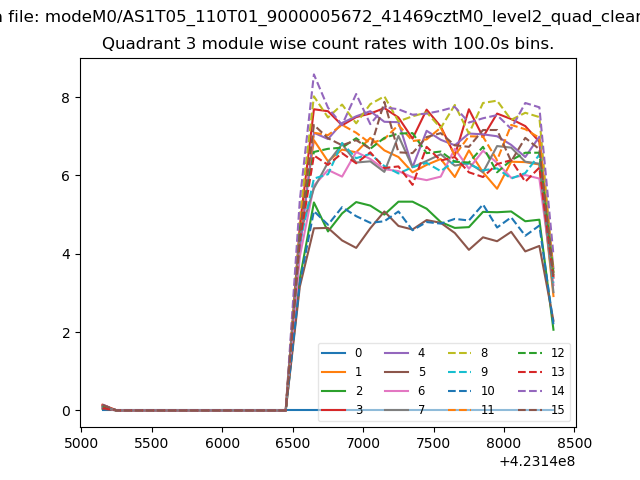 |
 |
| Parameter | Plot |
|---|---|
| CZT HV Monitor | 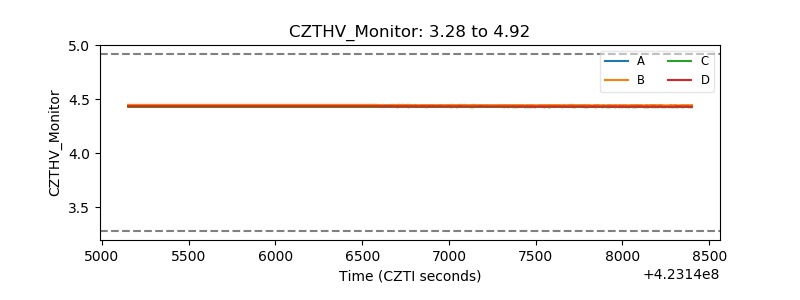 |
| D_VDD | 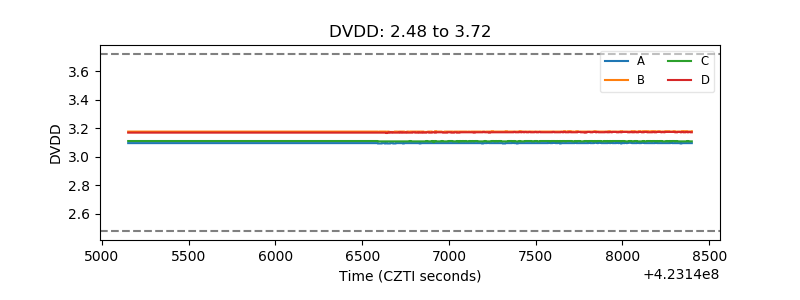 |
| Temperature 1 | 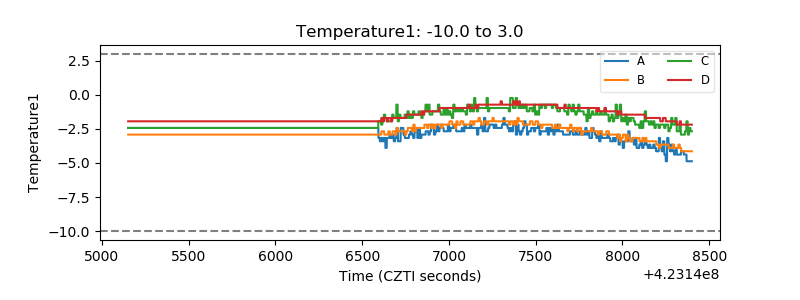 |
| Veto HV Monitor | 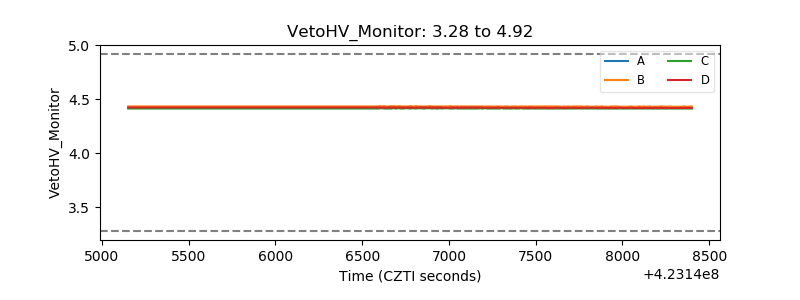 |
| Veto LLD | 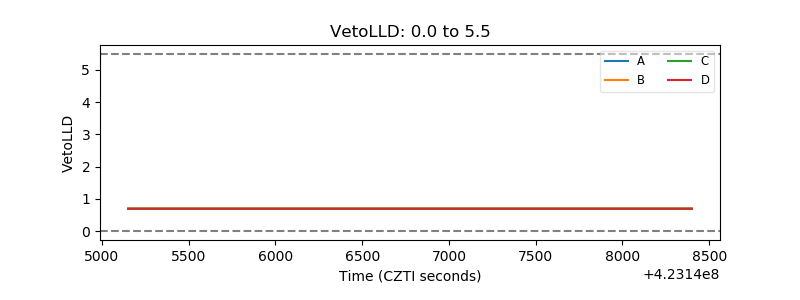 |
| Alpha Counter | 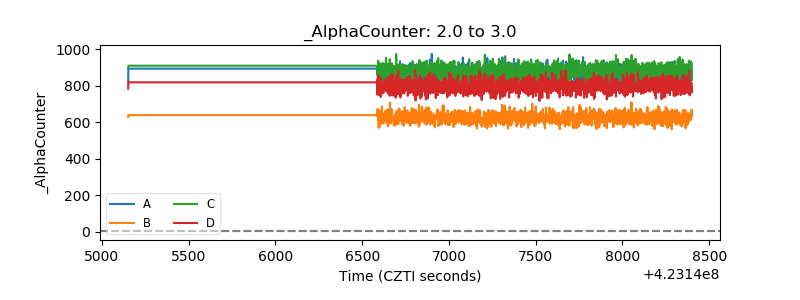 |
| _CPM_Rate | 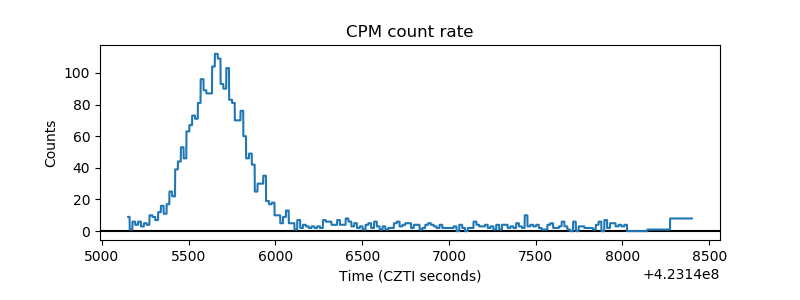 |
| CZT Counter | 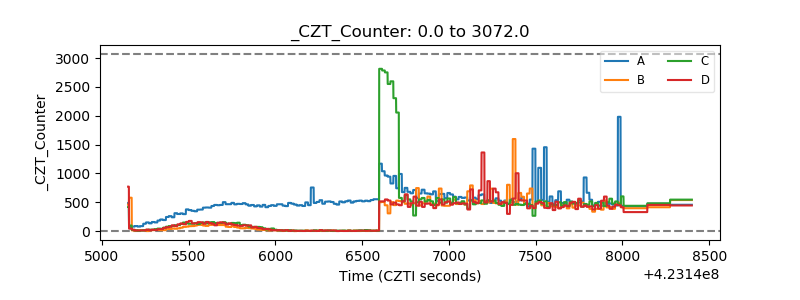 |
| +2.5 Volts monitor |  |
| +5 Volts monitor | 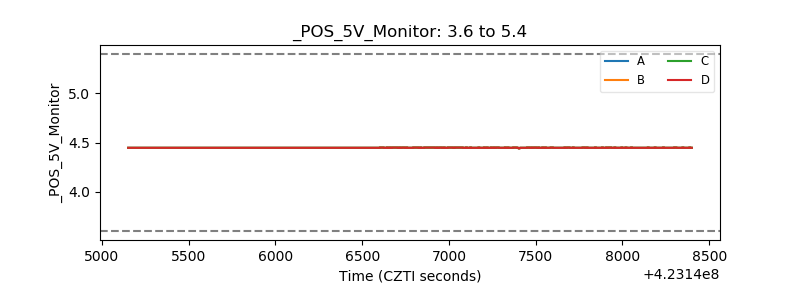 |
| _ROLL_ROT | 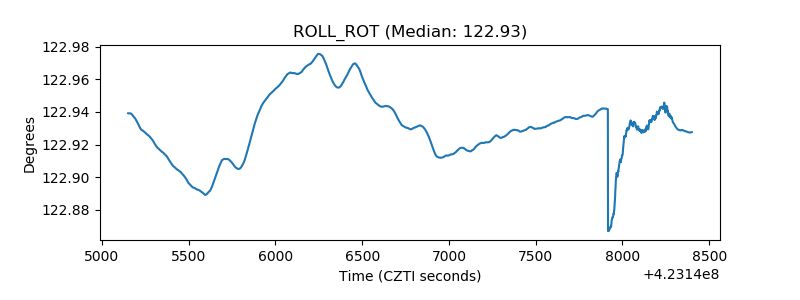 |
| _Roll_DEC | 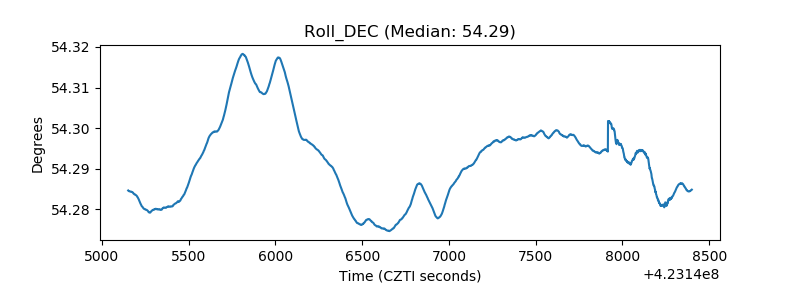 |
| _Roll_RA | 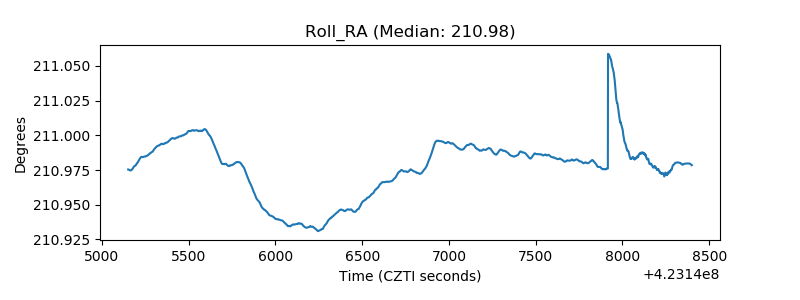 |
| Veto Counter | 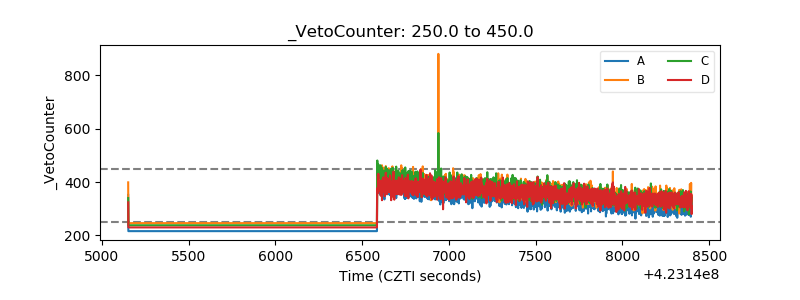 |