| Param | Original file | Final file |
|---|---|---|
| Filename | modeM0/AS1A12_035T02_9000005676_41478cztM0_level2.fits | modeM0/AS1A12_035T02_9000005676_41478cztM0_level2_quad_clean.evt |
| Size (bytes) | 159,503,040 | 35,213,760 |
| Size | 152.1 MB | 33.6 MB |
| Events in quadrant A | 1,235,435 | 240,311 |
| Events in quadrant B | 1,122,507 | 243,857 |
| Events in quadrant C | 1,575,619 | 216,240 |
| Events in quadrant D | 1,801,597 | 210,804 |
| Mode SS | |||
|---|---|---|---|
| Quadrant | BADHDUFLAG | Total packets | Discarded packets |
| A | 0 | 44 | 0 |
| B | 0 | 44 | 0 |
| C | 0 | 44 | 0 |
| D | 0 | 44 | 0 |
| Mode M0 | |||
|---|---|---|---|
| Quadrant | BADHDUFLAG | Total packets | Discarded packets |
| A | 0 | 4874 | 2 |
| B | 0 | 4775 | 1 |
| C | 0 | 5932 | 1 |
| D | 0 | 6835 | 1 |
| Mode M9 | |||
|---|---|---|---|
| Quadrant | BADHDUFLAG | Total packets | Discarded packets |
| A | 0 | 17 | 0 |
| B | 0 | 17 | 0 |
| C | 0 | 17 | 0 |
| D | 0 | 17 | 0 |
| Quadrant | Total seconds | Saturated seconds | Saturation percentage |
|---|---|---|---|
| A | 2146 | 7 | 0.326188% |
| B | 2146 | 15 | 0.698975% |
| C | 2146 | 176 | 8.201305% |
| D | 2146 | 126 | 5.871389% |
Noise dominated data is calculated using 1-second bins in cleaned event files. If a bin has >2000 counts, and if more than 50% of those come from <1% of pixels, then it is considered to be noise-dominated and hence unusable.
| Quadrant | # 1 sec bins | Bins with >0 counts | Bins with >2000 counts | High rate bins dominated by noise | Noise dominated (total time) | Noise dominated (detector-on time) | Marked lightcurve |
|---|---|---|---|---|---|---|---|
| A | 3819 | 2147 | 2 | 2 | 0.05% | 0.09% | 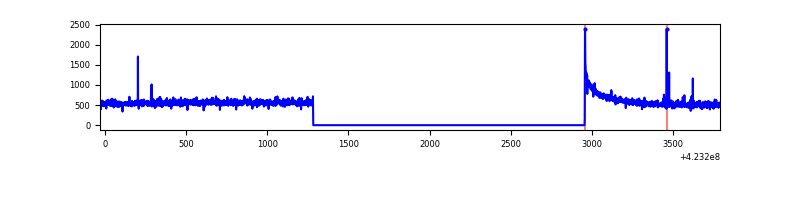 |
| B | 3819 | 2147 | 8 | 8 | 0.21% | 0.37% | 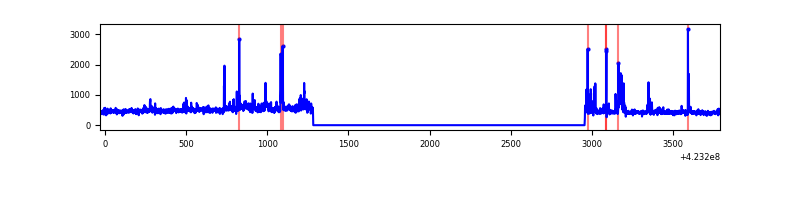 |
| C | 3819 | 2147 | 164 | 164 | 4.29% | 7.64% | 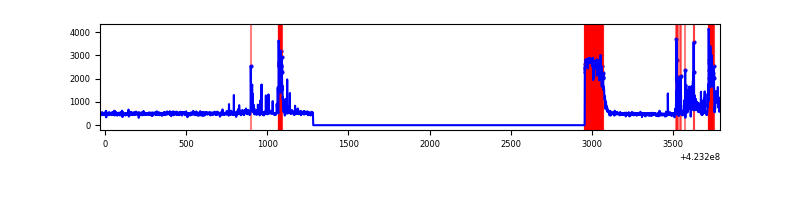 |
| D | 3819 | 2147 | 107 | 107 | 2.80% | 4.98% | 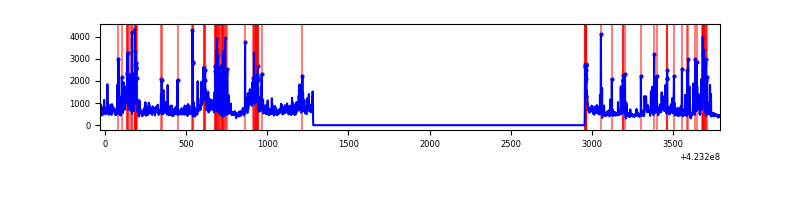 |
Top three noisy pixels from each quadrant. If the there are fewer than three noisy pixels in the level2.evt file, extra rows are filled as -1
| Pixel properties | Quadrant properties | ||||||
|---|---|---|---|---|---|---|---|
| Quadrant | DetID | PixID | Counts | Sigma | Mean | Median | Sigma |
| A | 10 | 83 | 261659 | 4978.88 | 246 | 240 | 52.5 |
| A | 2 | 79 | 11863 | 221.36 | 246 | 240 | 52.5 |
| A | 13 | 248 | 5104 | 92.63 | 246 | 240 | 52.5 |
| B | 5 | 255 | 70180 | 1427.63 | 244 | 239 | 49.0 |
| B | 0 | 190 | 39088 | 792.98 | 244 | 239 | 49.0 |
| B | 15 | 85 | 22420 | 452.76 | 244 | 239 | 49.0 |
| C | 0 | 10 | 293700 | 5381.68 | 228 | 230 | 54.5 |
| C | 4 | 254 | 276184 | 5060.47 | 228 | 230 | 54.5 |
| C | 15 | 214 | 92628 | 1694.4 | 228 | 230 | 54.5 |
| D | 5 | 222 | 221364 | 3827.56 | 233 | 226 | 57.8 |
| D | 12 | 16 | 172137 | 2975.51 | 233 | 226 | 57.8 |
| D | 6 | 239 | 170944 | 2954.86 | 233 | 226 | 57.8 |
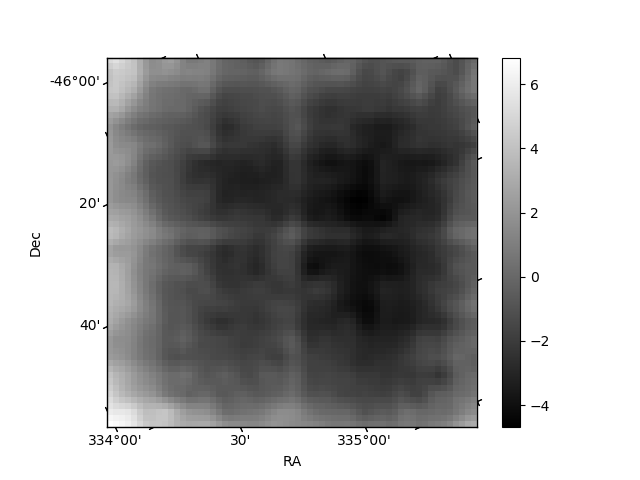
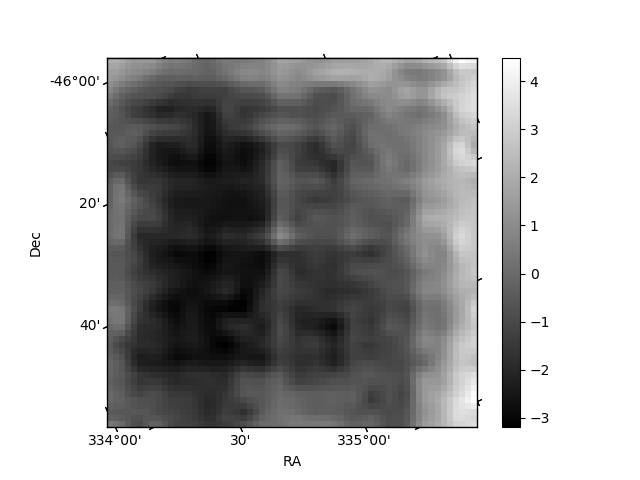
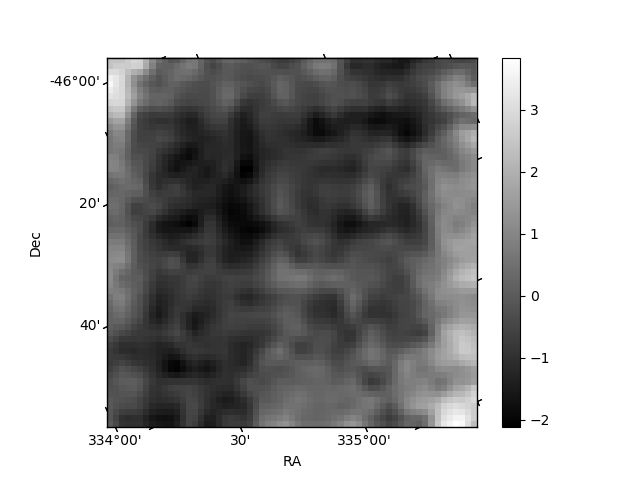
Histogram calculated using DETX and DETY for each event in the final _common_clean file
| Quadrant A | 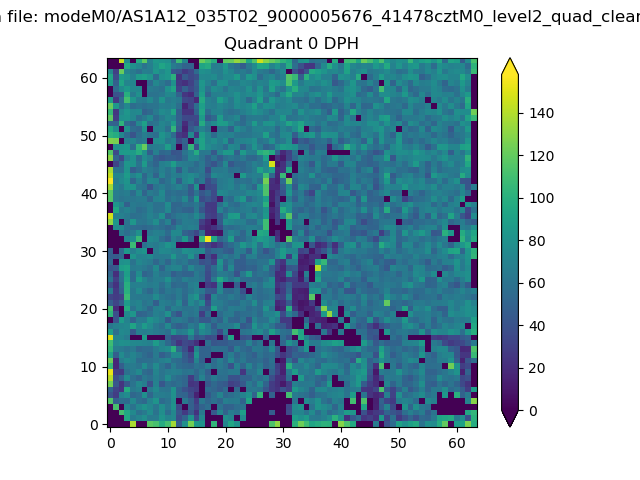 |
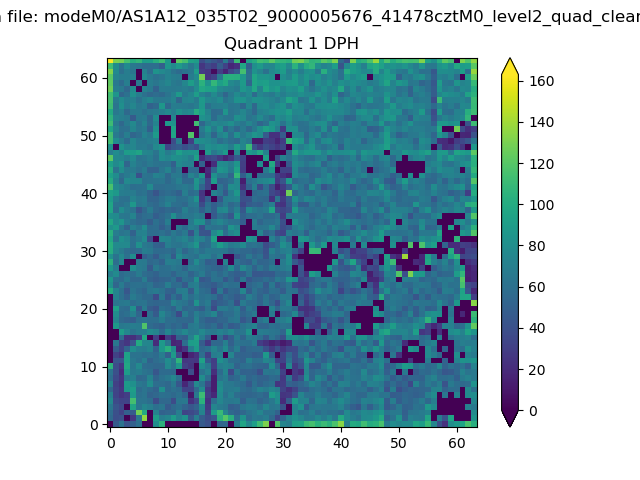 |
Quadrant B |
|---|---|---|---|
| Quadrant D | 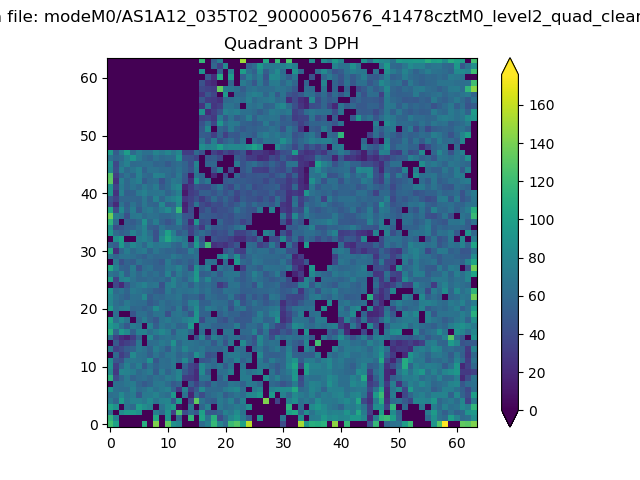 |
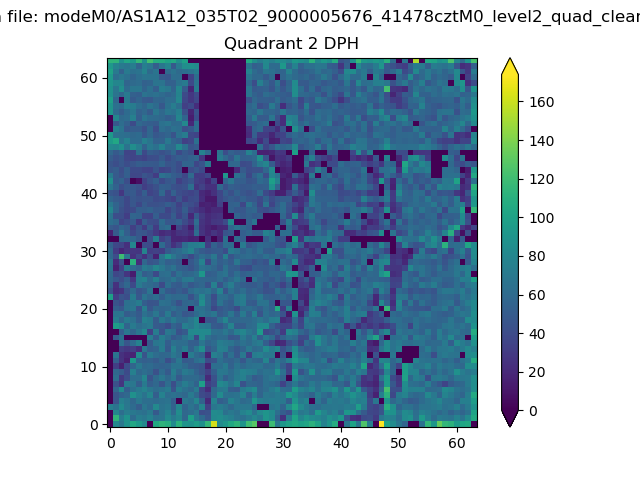 |
Quadrant C |
| Plot type | Count rate plots | Images |
|---|---|---|
| Comparison with Poisson distribution Blue bars denote a histogram of data divided into 1 sec bins. Red curve is a Poisson curve with rate = median count rate of data. |
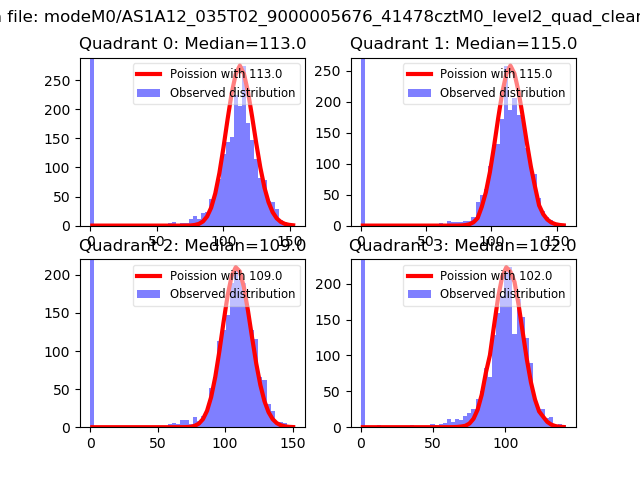 |
 |
| Quadrant-wise count rates Data is divided into 100 sec bins |
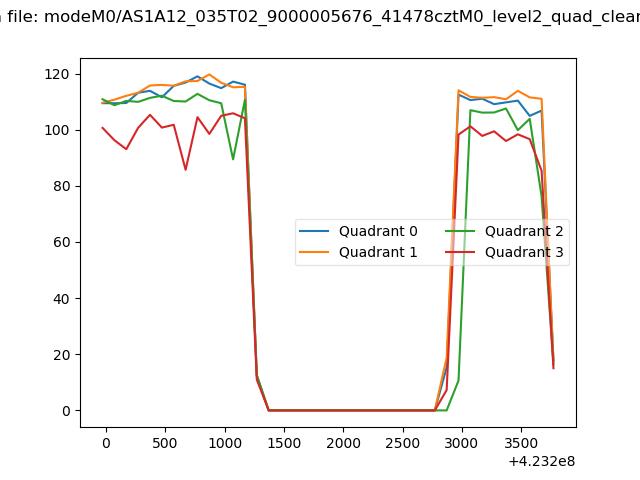 |
|
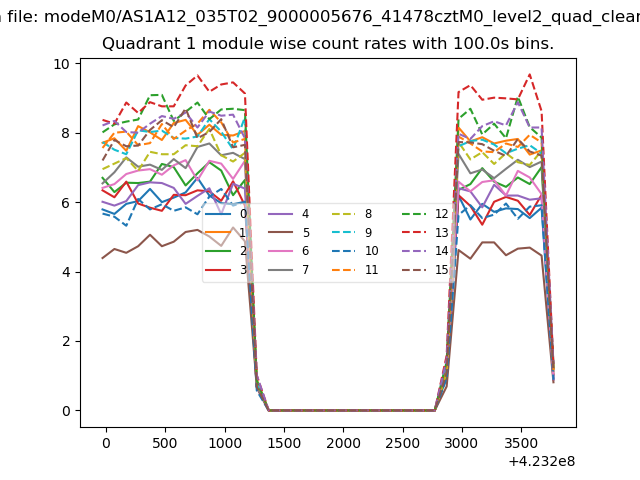
| Module-wise count rates for Quadrant A Data is divided into 100 sec bins |
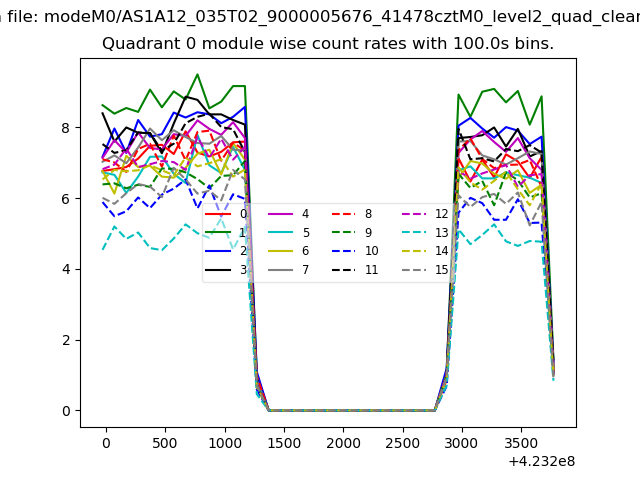 |
 |
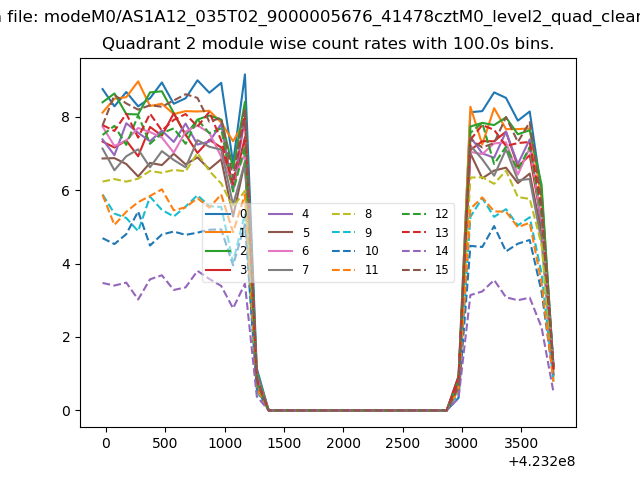
| Module-wise count rates for Quadrant B Data is divided into 100 sec bins |
 |
 |
| Module-wise count rates for Quadrant C Data is divided into 100 sec bins |
 |
 |
| Module-wise count rates for Quadrant D Data is divided into 100 sec bins |
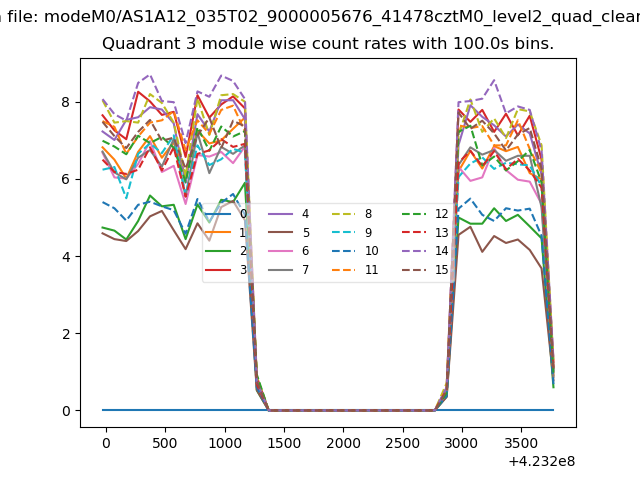 |
 |
| Parameter | Plot |
|---|---|
| CZT HV Monitor | 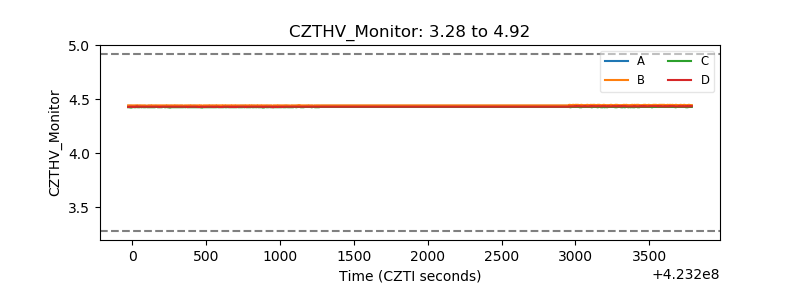 |
| D_VDD | 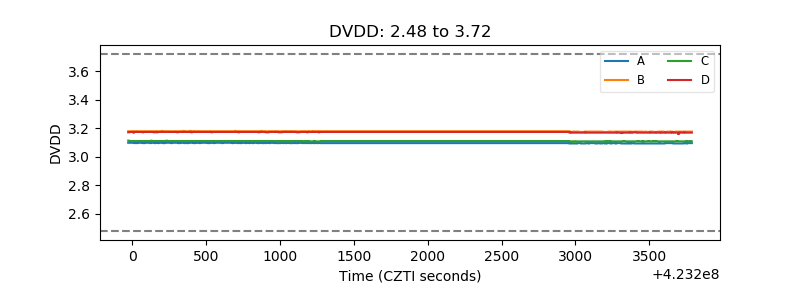 |
| Temperature 1 | 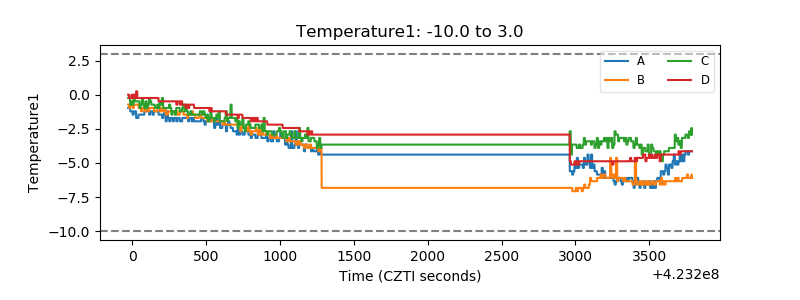 |
| Veto HV Monitor | 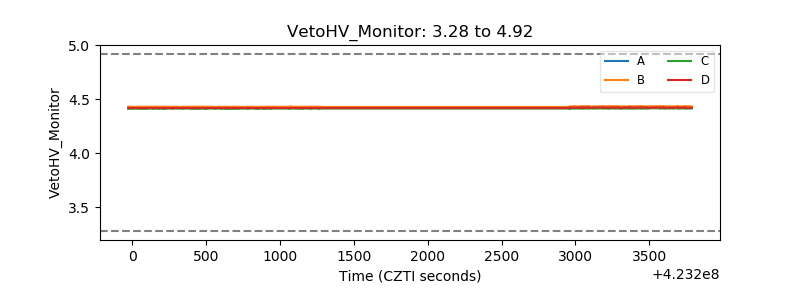 |
| Veto LLD | 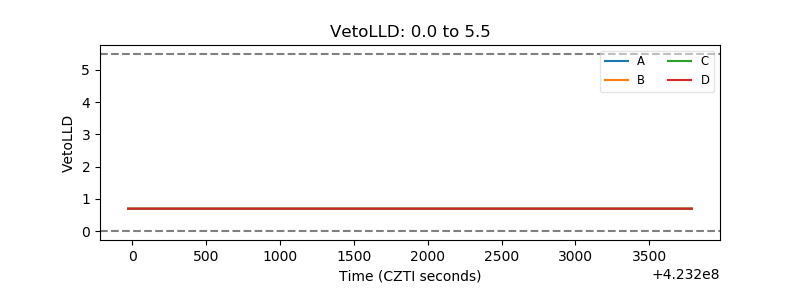 |
| Alpha Counter | 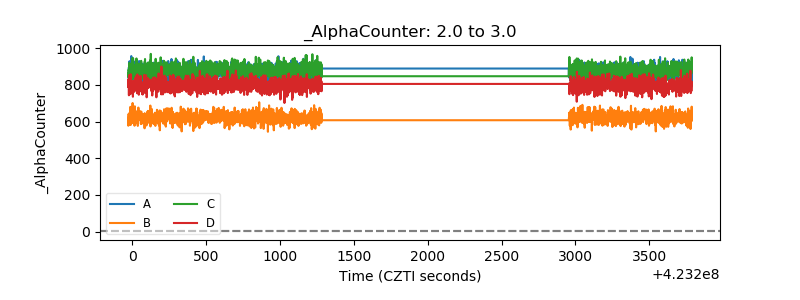 |
| _CPM_Rate | 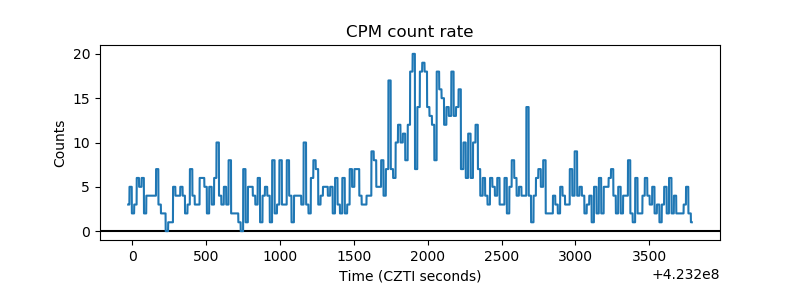 |
| CZT Counter | 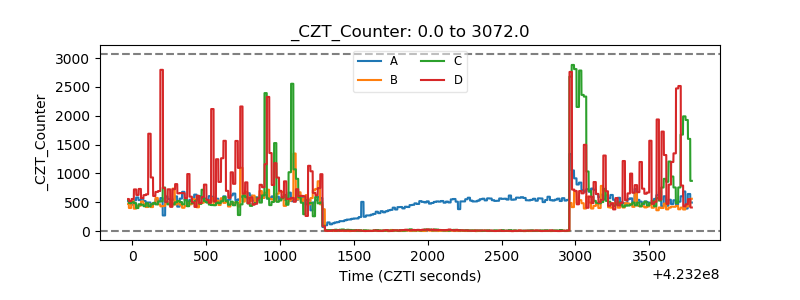 |
| +2.5 Volts monitor | 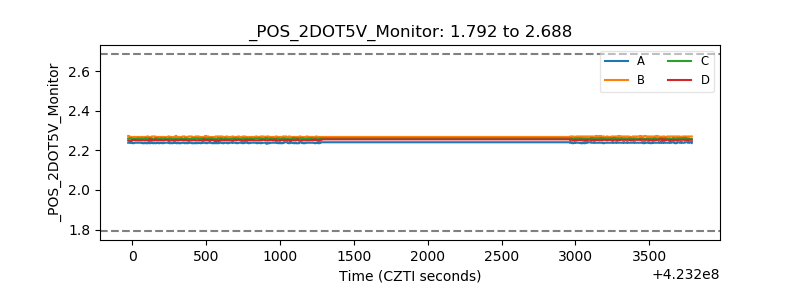 |
| +5 Volts monitor | 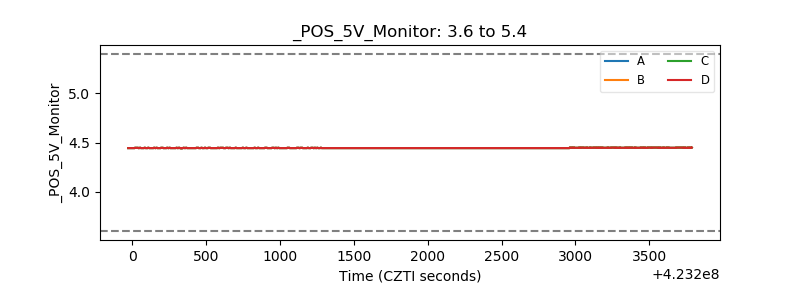 |
| _ROLL_ROT | 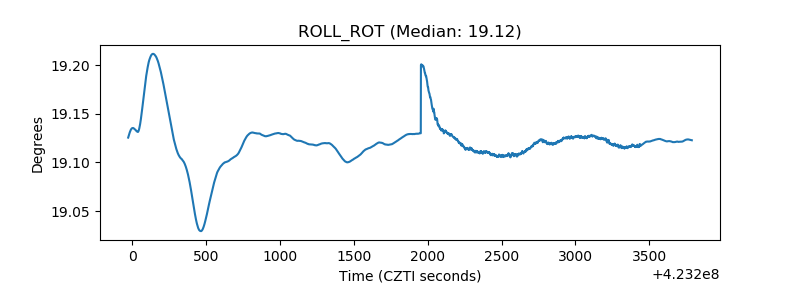 |
| _Roll_DEC | 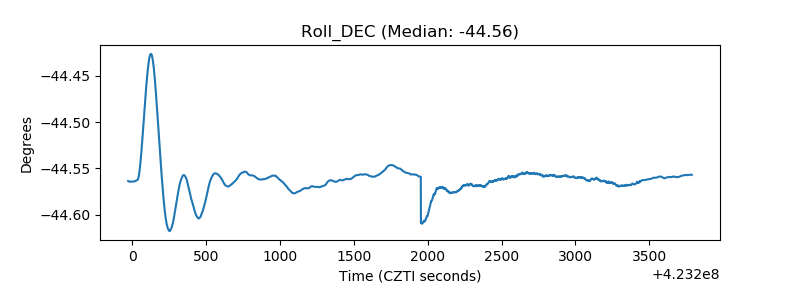 |
| _Roll_RA |  |
| Veto Counter | 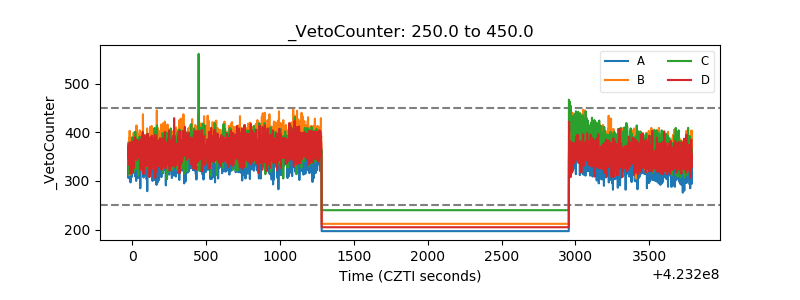 |